0%
0 / 15 answered
Interpreting Data from Graphs Practice Test
•15 QuestionsQuestion
1 / 15
Q1
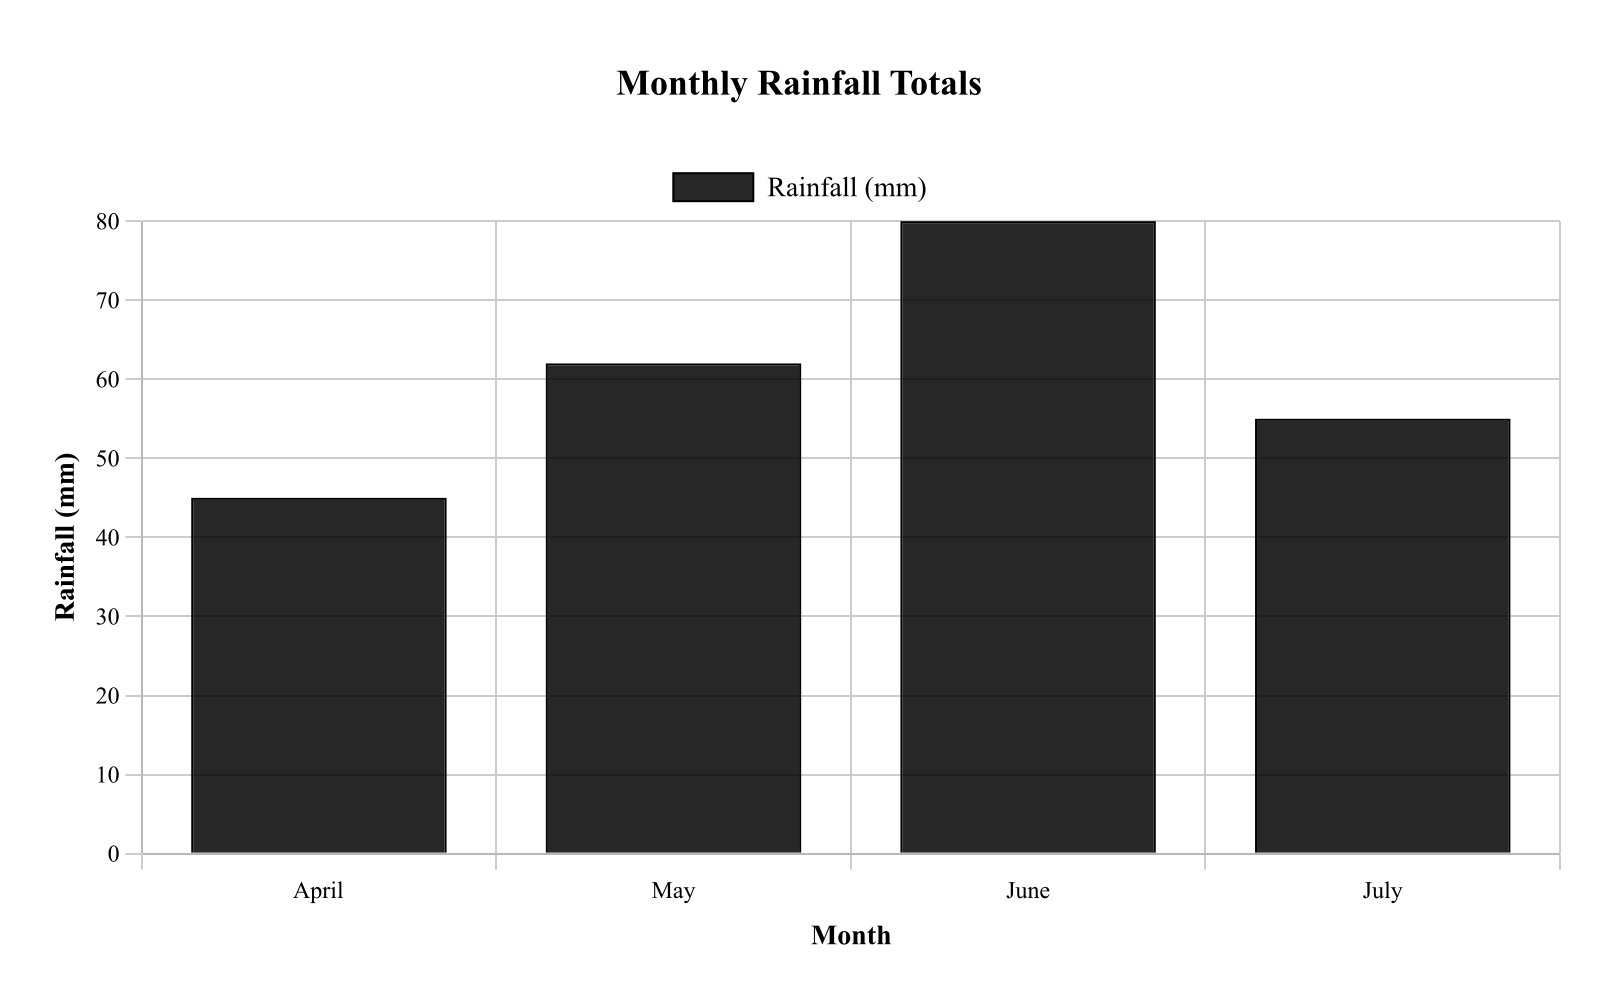
A meteorologist compared total rainfall across four months at one location. Figure 1 shows monthly rainfall totals. According to the graph, which month had rainfall closest to 60 mm?
Bar heights are approximately: April 45 mm, May 62 mm, June 80 mm, July 55 mm. Caption: Each bar represents the total rainfall measured for that month; values can be compared by bar height.