What this quiz covers
This quiz focuses on Evaluating Trends And Making Predictions, giving you a quick way to practice the rules, question types, and explanations that matter most for ACT Science.
PASSAGE IV
GEOPHYSICS: This passage is adapted from a study on the structure of Earth's interior using seismic waves.
Seismologists study the interior of the Earth by analyzing the propagation of seismic waves generated by earthquakes. There are two main types of body waves:
•P-waves (Primary waves): Compressional waves that travel through solids, liquids, and gases.
•S-waves (Secondary waves): Shear waves that travel only through solids.
The velocity of these waves depends on the density and physical state (solid or liquid) of the material they travel through. Abrupt changes in velocity indicate boundaries between Earth's layers.
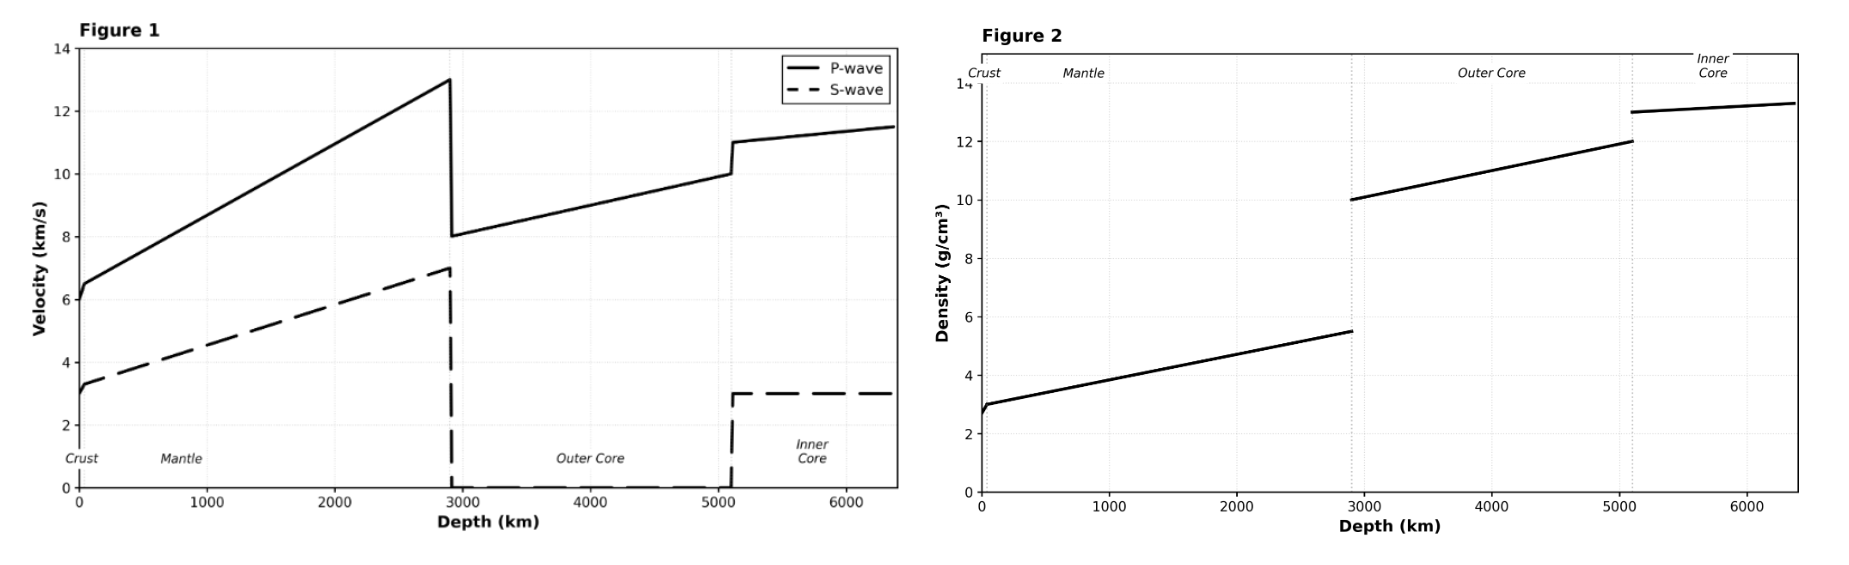
Which of the following statements best describes the relationship between depth and density within the Mantle (0-2,900 km), according to Figure 2?
ACT Science Quiz
Practice Evaluating Trends And Making Predictions in ACT Science with focused quiz questions that help you check what you know, review explanations, and build confidence with test-style prompts.
This quiz focuses on Evaluating Trends And Making Predictions, giving you a quick way to practice the rules, question types, and explanations that matter most for ACT Science.
Try each quiz question before looking at the correct answer. Use the explanations to review missed ideas, then come back to similar questions until the pattern feels familiar.
PASSAGE IV
GEOPHYSICS: This passage is adapted from a study on the structure of Earth's interior using seismic waves.
Seismologists study the interior of the Earth by analyzing the propagation of seismic waves generated by earthquakes. There are two main types of body waves:
•P-waves (Primary waves): Compressional waves that travel through solids, liquids, and gases.
•S-waves (Secondary waves): Shear waves that travel only through solids.
The velocity of these waves depends on the density and physical state (solid or liquid) of the material they travel through. Abrupt changes in velocity indicate boundaries between Earth's layers.
Which of the following statements best describes the relationship between depth and density within the Mantle (0-2,900 km), according to Figure 2?
Explanation: This is a trend description question. Figure 2 shows that within the Mantle region (from the surface to 2,900 km), density increases from approximately 3.0 g/cm³ to 5.5 g/cm³. This is a steady upward trend. Choice B (density increases) correctly describes this relationship. Choice A (decreases) is opposite of the actual trend. Choice C (constant) would require a flat horizontal line. Choice D (fluctuates) would require up-and-down variation not present in the data. Pro tip: For relationship questions, focus on the overall direction of change within the specified range.
PASSAGE V
BIOLOGY: This passage is adapted from a study on the metabolic rates of vertebrates. Introduction
Metabolism is the set of chemical reactions that occur in living organisms to maintain life. The metabolic rate is often measured by the amount of oxygen (O2) consumed per gram of body mass per hour.
Animals can be classified based on how they regulate body temperature:
•Endotherms (e.g., mammals, birds) generate their own body heat to maintain a constant internal temperature.
•Ectotherms (e.g., reptiles, amphibians) rely on external heat sources to regulate their body temperature.
Students conducted two studies to compare the metabolic rates of a Mouse (Endotherm) and a Lizard (Ectotherm) of similar body mass.
Study 1
The students placed the mouse and the lizard in separate metabolic chambers. They varied the environmental temperature from 5°C to 35°C in 10°C increments. The animals were kept at rest. The rate of oxygen consumption (mL O2/g⋅hr) was measured after the animals had acclimated to each temperature for 30 minutes. Findings were reported in Figure 1.
Study 2
The students investigated the effect of activity level on metabolic rate. They maintained the environmental temperature at 25°C for both animals. They measured the oxygen consumption while the animals were at rest and while they were running on a treadmill at 1.0 km/hr. Findings were reported in Table 1.
Study 3
To determine if body mass affects metabolic rate within the same group, students measured the resting metabolic rate of three different lizards at 25°C. Findings were reported in Table 2.
Consider the data for the Mouse at 35°C in Figure 1. If the temperature were increased further to 45°C, which of the following predictions is most biologically likely?
Explanation: This is an extrapolation/prediction question requiring biological reasoning. Figure 1 shows the Mouse's metabolic rate decreases from 5°C to a minimum at 25°C, then slightly increases at 35°C (from 1.5 to 2.0). This upturn suggests the beginning of heat stress. At 45°C (well above normal), the mouse would experience severe heat stress and need to activate cooling mechanisms (panting, increased blood flow to extremities for heat dissipation). These cooling processes require energy, increasing metabolic rate. Choice C correctly predicts this biologically realistic response. Choice A (drop to 0) would mean death, not a gradual response. Choice B (continue decreasing) ignores the upturn already visible at 35°C. Choice D (identical to Lizard) is unrealistic—endotherms and ectotherms have fundamentally different metabolic strategies. Pro tip: When extrapolating trends, consider biological limits and stress responses, not just mathematical continuation.
A materials scientist measured the thickness of a coating after each pass of a sprayer. Based on the pattern in the table, what thickness would most likely be measured after 6 passes?
Explanation: The data show a linear accumulation in coating thickness with each sprayer pass. The thicknesses are 4.5 µm after 1 pass, 9 µm after 2, 13.5 µm after 3, 18 µm after 4, and 22.5 µm after 5, increasing by 4.5 µm per pass. This quantifies the pattern as a constant addition of 4.5 µm each pass. To predict the thickness after 6 passes, add 4.5 µm to the 5-pass value: 22.5 + 4.5 = 27 µm. Some might assume doubling instead, leading to 45 µm, but the data confirm additive growth.
An engineer recorded the distance a test cart traveled after different numbers of identical pushes on a smooth track. Based on the pattern in the table, what distance would most likely be traveled after 6 pushes?
Explanation: The data indicate a linear increase in the distance traveled by the cart with each additional push. The distances are 4 m after 1 push, 8 m after 2 pushes, 12 m after 3, 16 m after 4, and 20 m after 5, with a consistent addition of 4 m per push. This quantifies the pattern as a linear relationship where each push adds 4 m to the total distance. To predict the distance after 6 pushes, add 4 m to the 5-push distance: 20 + 4 = 24 m. One might mistakenly assume a multiplicative pattern, such as doubling, which would incorrectly predict 40 m, but the data show additive increases.
PASSAGE II
BIOLOGY: This passage is adapted from a study on the factors affecting the rate of photosynthesis in aquatic plants.
Introduction
Photosynthesis is the process by which green plants use sunlight to synthesize nutrients from carbon dioxide (CO2) and water (H2O). The process releases oxygen (O2) as a byproduct according to the following chemical equation: 6CO2+6H2O+light energy→C6H12O6+6O2 Students conducted three studies to investigate how different environmental factors affect the rate of photosynthesis in Elodea, an aquatic plant. The rate was measured by counting the number of oxygen bubbles produced by a cut stem of Elodea submerged in water over a 5-minute period.
Study 1
To test the effect of light intensity, students placed a 10 cm sprig of Elodea into a test tube filled with a 0.5% sodium bicarbonate (NaHCO3) solution (a source of CO2). A light source was placed at various distances from the test tube. The temperature was maintained at 25°C. The number of bubbles produced in 5 minutes was recorded.
Study 2
To test the effect of light color (wavelength), students used the same setup as in Study 1. The light source was kept at a constant distance of 10 cm. Colored filters were placed between the light and the plant to isolate specific wavelengths. Clear cellophane was used as a control.
Study 3
To test the effect of CO2 availability, students prepared five test tubes with different concentrations of sodium bicarbonate (NaHCO3). A 10 cm sprig of Elodea was placed in each. The light source was kept constant at 10 cm (white light).
Based on Table 1, as the distance of the light source from the plant increases, the rate of photosynthesis:
Explanation: This is a trend identification question. Table 1 shows that as distance increases from 10 cm to 50 cm, the number of bubbles decreases from 45 to 5. This is a clear, consistent downward trend with no reversals or plateaus. Choice B (decreases only) is correct. Choice A (increases) is opposite of the data. Choice C (decreases then increases) would require the trend to reverse, which doesn't happen. Choice D (constant) would require the same value at all distances. Pro tip: For trend questions, look at the overall pattern from first to last data point.
PASSAGE V
BIOLOGY: This passage is adapted from a study on the metabolic rates of vertebrates. Introduction
Metabolism is the set of chemical reactions that occur in living organisms to maintain life. The metabolic rate is often measured by the amount of oxygen (O2) consumed per gram of body mass per hour.
Animals can be classified based on how they regulate body temperature:
•Endotherms (e.g., mammals, birds) generate their own body heat to maintain a constant internal temperature.
•Ectotherms (e.g., reptiles, amphibians) rely on external heat sources to regulate their body temperature.
Students conducted two studies to compare the metabolic rates of a Mouse (Endotherm) and a Lizard (Ectotherm) of similar body mass.
Study 1
The students placed the mouse and the lizard in separate metabolic chambers. They varied the environmental temperature from 5°C to 35°C in 10°C increments. The animals were kept at rest. The rate of oxygen consumption (mL O2/g⋅hr) was measured after the animals had acclimated to each temperature for 30 minutes. Findings were reported in Figure 1.
Study 2
The students investigated the effect of activity level on metabolic rate. They maintained the environmental temperature at 25°C for both animals. They measured the oxygen consumption while the animals were at rest and while they were running on a treadmill at 1.0 km/hr. Findings were reported in Table 1.
Study 3
To determine if body mass affects metabolic rate within the same group, students measured the resting metabolic rate of three different lizards at 25°C. Findings were reported in Table 2.
Based on Table 2, what is the relationship between body mass and metabolic rate per gram for lizards?
Explanation: This is a trend identification question. Table 2 shows three lizards: as mass increases from 20 g to 50 g to 100 g, the metabolic rate per gram decreases from 0.80 to 0.50 to 0.35 mL O₂/g·hr. This is a clear inverse relationship—larger lizards have lower mass-specific metabolic rates. Choice B correctly describes this inverse trend. Choice A (increases) is opposite. Choice C (independent) would show no pattern. Choice D (doubles) is factually wrong and describes an increase, not decrease. Pro tip: This inverse relationship reflects a biological principle (Kleiber's Law)—larger animals have lower per-gram metabolic rates due to surface area to volume ratios.
PASSAGE II
BIOLOGY: Research Summary
Introduction
Transpiration is the process by which moisture is carried through plants from roots to small pores on the underside of leaves, where it changes to vapor and is released to the atmosphere. A botanist conducted two studies to investigate how environmental factors affect the transpiration rate of Spathiphyllum (peace lily) plants.
Study 1
The botanist placed 5 identical Spathiphyllum plants into 5 identical environmentally controlled chambers. The relative humidity inside all chambers was kept constant at 40%, and the temperature was kept constant at 22°C. The botanist varied the light intensity—measured in micromoles of photons per square meter per second (μmol/m2/s)—in each chamber. After 4 hours, the botanist measured the mass of water lost by each plant to calculate the transpiration rate in milligrams of water per square centimeter of leaf area per hour (mg/cm2/hr). Results are shown in Table 1.
Study 2
The botanist obtained 5 new, identical Spathiphyllum plants and placed them in the chambers. This time, the light intensity in all chambers was kept constant at 400 μmol/m2/s and the temperature at 22°C. The botanist varied the relative humidity in each chamber. The transpiration rates were calculated after 4 hours. Results are shown in Table 2.
Suppose the botanist conducted a third study where a Spathiphyllum plant was exposed to a relative humidity of 50% and a light intensity of 400 μmol/m²/s. Based on Table 2, the transpiration rate for this plant would most likely be:
Explanation: The correct answer is B. Table 2 shows that at 40% humidity the transpiration rate is 4.8 mg/cm²/hr, and at 60% humidity it is 3.1 mg/cm²/hr. Since 50% falls exactly between 40% and 60%, the transpiration rate must fall between 3.1 and 4.8 mg/cm²/hr. A is wrong — a rate less than 3.1 would require humidity higher than 60%. C is wrong — a rate between 4.8 and 6.5 would require humidity lower than 40%. D is wrong — a rate above 6.5 would require humidity below 20%. Pro tip: Interpolation questions test whether a value between two known data points produces a result between those data points. Always identify your bracketing values first.
PASSAGE I
EARTH SCIENCE: Data Representation
Earth's atmosphere is divided into distinct layers based on how temperature changes with altitude. The boundary between each layer is called a pause (e.g., the tropopause separates the troposphere from the stratosphere). Figure 1 shows how average atmospheric temperature varies with altitude. Table 1 shows how average atmospheric pressure, measured in atmospheres (atm), changes with altitude.
A weather balloon is launched from sea level and ascends to an altitude of 25 km. Based on the provided data, during the balloon's flight, the atmospheric pressure it experiences will most likely:
Explanation: The correct answer is A. The balloon starts at sea level (1.0 atm) and ascends to 25 km. Table 1 shows that at 20 km the pressure is 0.05 atm and at 30 km it is 0.01 atm. Since 25 km falls between these two values, the pressure at that altitude must fall between 0.05 and 0.01 atm. The balloon starts at 1.0 atm and drops to that intermediate value. B is wrong because 0.01 atm corresponds to exactly 30 km, not 25 km. C is wrong because pressure decreases as altitude increases — it cannot rise during an ascent. D is wrong because Table 1 clearly shows pressure decreasing continuously from sea level, not remaining constant. Pro tip: Interpolation questions require identifying the two data points that bracket your target value and confirming your answer falls between them.
PASSAGE VI
PHYSICS: This passage is adapted from a study on the forces acting on an object on an inclined plane. Introduction
A student conducted experiments to determine the factors that affect the force required to pull a block up an inclined plane at a constant velocity. The force (F) required depends on the mass of the block (m), the angle of the incline (θ), and the friction between the block and the surface.
The experimental setup consisted of a wooden board (the inclined plane) and a spring scale attached to a rectangular block. The student pulled the block up the incline at a steady speed and recorded the force in Newtons (N).
Study 1
To test how the angle of the incline affects the force, the student used a standard wooden block with a mass of 1.0 kg. The surface of the inclined plane was smooth wood. The student varied the angle of the incline from 10° to 60°. Results were recorded in Table 1.
Study 2
To test how the surface material (friction) affects the force, the student fixed the angle of the incline at 30° and used the same 1.0 kg block. The student covered the wooden board with different materials: Sandpaper, Rubber, and Plastic. The force was measured for each surface. Results were recorded in Table 2.
Study 3
To test how the mass of the block affects the force, the student used the smooth wood surface and fixed the angle at 30°. The student added weights to the block to increase its total mass. Results were recorded in Table 3.
According to the results of Study 1, as the angle of the incline increases, the force required to pull the block:
Explanation: This is a trend identification question. Table 1 shows that as the angle increases from 10° to 60°, the force increases from 2.5 N to 9.4 N. This is a consistent upward trend with no reversals or plateaus. Choice A (increases only) is correct. Choice B (decreases) is opposite. Choice C (increases then decreases) would require the trend to reverse, which doesn't happen. Choice D (constant) would show the same force at all angles. Pro tip: Check from first to last data point for the overall trend direction.
PASSAGE VI
PHYSICS: This passage is adapted from a study on the forces acting on an object on an inclined plane. Introduction
A student conducted experiments to determine the factors that affect the force required to pull a block up an inclined plane at a constant velocity. The force (F) required depends on the mass of the block (m), the angle of the incline (θ), and the friction between the block and the surface.
The experimental setup consisted of a wooden board (the inclined plane) and a spring scale attached to a rectangular block. The student pulled the block up the incline at a steady speed and recorded the force in Newtons (N).
Study 1
To test how the angle of the incline affects the force, the student used a standard wooden block with a mass of 1.0 kg. The surface of the inclined plane was smooth wood. The student varied the angle of the incline from 10° to 60°. Results were recorded in Table 1.
Study 2
To test how the surface material (friction) affects the force, the student fixed the angle of the incline at 30° and used the same 1.0 kg block. The student covered the wooden board with different materials: Sandpaper, Rubber, and Plastic. The force was measured for each surface. Results were recorded in Table 2.
Study 3
To test how the mass of the block affects the force, the student used the smooth wood surface and fixed the angle at 30°. The student added weights to the block to increase its total mass. Results were recorded in Table 3.
Based on the results of Study 3, if the student used a block with a mass of 5.0 kg on the smooth wood surface at 30°, the force required would be closest to:
Explanation: This is an extrapolation question requiring pattern recognition. Table 3 shows a perfect linear relationship: Force = Mass × 5.8. You can verify: 1.0 kg → 5.8 N (5.8 × 1), 2.0 kg → 11.6 N (5.8 × 2), 3.0 kg → 17.4 N (5.8 × 3), 4.0 kg → 23.2 N (5.8 × 4). Continuing this pattern: 5.0 kg → 5.8 × 5 = 29.0 N. Choice B is correct. Choice A (25.0 N) doesn't follow the pattern (would be 5.0 × 5). Choice C (32.0 N) is too high. Choice D (35.0 N) is way too high. Pro tip: When data show perfect linear relationships, extend the pattern using the same mathematical rule.
PASSAGE V
BIOLOGY: Data Representation
Introduction
Photosynthesis is the process by which plants use light energy to synthesize glucose. Plants capture light energy using pigment molecules located in their leaves. Different pigments absorb different wavelengths of visible light. The visible light spectrum ranges from 400 nanometers (nm), which is violet light, to 700 nm, which is red light. Light that is not absorbed is reflected (which determines the color the plant appears to the human eye).
A botanist investigated the light absorption and photosynthetic activity of a specific species of green plant.
Study 1
The botanist extracted the three primary photosynthetic pigments from the plant's leaves: Chlorophyll a, Chlorophyll b, and Carotenoids. Figure 1 shows the absorption spectrum for each pigment, which indicates the relative amount of light absorbed by each pigment at different wavelengths.
Study 2
The botanist then measured the overall action spectrum of the living, intact plant. The action spectrum shows the actual relative rate of photosynthesis (measured by oxygen production) for the whole plant when it is exposed to different wavelengths of light. Findings are shown in Figure 2
Suppose the engineers conducted an additional trial in Study 2 using a pitch angle of 25°. Based on the data in Table 2, the power output would most likely be:
Explanation: The correct answer is C. Table 2 shows that at 20°, the power output is 115.0 mW, and at 30°, it is 80.0 mW. An angle of 25° falls exactly between these two data points, so the power output must fall between 80.0 and 115.0 mW. A (35.0–80.0 mW) is the range between 30° and 40° — too low for 25°. B (75.0–100.0 mW) is the range between 10° and 15° — also the wrong region. D (greater than 115.0 mW) would require the peak to continue rising past 20°, but the data shows it has already peaked and is declining. Pro tip: Interpolation questions require identifying the two data points that bracket your target input. An input between 20° and 30° must produce an output between their corresponding values.
PASSAGE IV
CHEMISTRY: Research Summary
Introduction
Colligative properties are properties of a solution that depend on the ratio of the number of solute particles to the number of solvent molecules, and not on the identity of the solute. Two common colligative properties are freezing point depression (a lowering of the freezing point) and boiling point elevation (an increase in the boiling point).
At standard atmospheric pressure (1 atm), pure liquid water (H2O) has a freezing point of 0.00∘C and a boiling point of 100.00∘C. Students conducted two studies to investigate how adding different solutes to 1.00 kilogram (kg) of water affects these points.
Study 1
Sodium chloride (NaCl) is a salt that completely dissociates (breaks apart) into two separate ions (Na+ and Cl−) when dissolved in water. The students added varying amounts of NaCl, measured in moles (mol), to 1.00 kg of water. They measured the resulting freezing point and boiling point of the solutions. Measurements are shown in Table 1.
Study 2
The students wanted to see how the number of particles a molecule dissociates into (n) affects the freezing and boiling points. They gathered three different solutes:
•Sucrose (C12H22O11): Does not dissociate in water (n \= 1).
•Sodium chloride (NaCl): Dissociates into 2 ions (n \= 2).
•Magnesium chloride (MgCl2): Dissociates into 3 ions (Mg2+ and two Cl− ions) (n \= 3).
They added exactly 1.00 mole of each solute to separate beakers containing 1.00 kg of water and recorded the results. Findings are shown in Table 2.
Based on the data in Study 2, if 1.00 mole of a hypothetical solute that completely dissociates into 4 ions (n = 4) were added to 1.00 kg of water, the boiling point of the solution would most likely be:
Explanation: The correct answer is D. Table 2 reveals that each particle (each unit of n) raises the boiling point by 0.51°C. For n=1: +0.51°C; n=2: +1.02°C; n=3: +1.53°C. The pattern is linear: boiling point elevation = n × 0.51°C. For n=4: 4 × 0.51 = 2.04°C above the baseline of 100.00°C, giving 102.04°C. A (100.51°C) applies n=1 instead of n=4 — confusing the sucrose result with the n=4 prediction. B (103.06°C) applies n=6, not n=4. C (104.08°C) doubles the n=4 answer incorrectly. Pro tip: Pattern extrapolation questions reward students who identify the per-unit change and multiply by the new value. Always verify your pattern by checking that it correctly reproduces at least two known data points.
PASSAGE V
BIOLOGY: This passage is adapted from a study on the metabolic rates of vertebrates. Introduction
Metabolism is the set of chemical reactions that occur in living organisms to maintain life. The metabolic rate is often measured by the amount of oxygen (O2) consumed per gram of body mass per hour.
Animals can be classified based on how they regulate body temperature:
•Endotherms (e.g., mammals, birds) generate their own body heat to maintain a constant internal temperature.
•Ectotherms (e.g., reptiles, amphibians) rely on external heat sources to regulate their body temperature.
Students conducted two studies to compare the metabolic rates of a Mouse (Endotherm) and a Lizard (Ectotherm) of similar body mass.
Study 1
The students placed the mouse and the lizard in separate metabolic chambers. They varied the environmental temperature from 5°C to 35°C in 10°C increments. The animals were kept at rest. The rate of oxygen consumption (mL O2/g⋅hr) was measured after the animals had acclimated to each temperature for 30 minutes. Findings were reported in Figure 1.
Study 2
The students investigated the effect of activity level on metabolic rate. They maintained the environmental temperature at 25°C for both animals. They measured the oxygen consumption while the animals were at rest and while they were running on a treadmill at 1.0 km/hr. Findings were reported in Table 1.
Study 3
To determine if body mass affects metabolic rate within the same group, students measured the resting metabolic rate of three different lizards at 25°C. Findings were reported in Table 2.
Based on Table 2, what is the relationship between body mass and metabolic rate per gram for lizards?
Explanation: This is a trend identification question. Table 2 shows three lizards: as mass increases from 20 g to 50 g to 100 g, the metabolic rate per gram decreases from 0.80 to 0.50 to 0.35 mL O₂/g·hr. This is a clear inverse relationship—larger lizards have lower mass-specific metabolic rates. Choice B correctly describes this inverse trend. Choice A (increases) is opposite. Choice C (independent) would show no pattern. Choice D (doubles) is factually wrong and describes an increase, not decrease. Pro tip: This inverse relationship reflects a biological principle (Kleiber's Law)—larger animals have lower per-gram metabolic rates due to surface area to volume ratios.
PASSAGE IV
CHEMISTRY: Research Summary
Introduction
Colligative properties are properties of a solution that depend on the ratio of the number of solute particles to the number of solvent molecules, and not on the identity of the solute. Two common colligative properties are freezing point depression (a lowering of the freezing point) and boiling point elevation (an increase in the boiling point).
At standard atmospheric pressure (1 atm), pure liquid water (H2O) has a freezing point of 0.00∘C and a boiling point of 100.00∘C. Students conducted two studies to investigate how adding different solutes to 1.00 kilogram (kg) of water affects these points.
Study 1
Sodium chloride (NaCl) is a salt that completely dissociates (breaks apart) into two separate ions (Na+ and Cl−) when dissolved in water. The students added varying amounts of NaCl, measured in moles (mol), to 1.00 kg of water. They measured the resulting freezing point and boiling point of the solutions. Measurements are shown in Table 1.
Study 2
The students wanted to see how the number of particles a molecule dissociates into (n) affects the freezing and boiling points. They gathered three different solutes:
•Sucrose (C12H22O11): Does not dissociate in water (n \= 1).
•Sodium chloride (NaCl): Dissociates into 2 ions (n \= 2).
•Magnesium chloride (MgCl2): Dissociates into 3 ions (Mg2+ and two Cl− ions) (n \= 3).
They added exactly 1.00 mole of each solute to separate beakers containing 1.00 kg of water and recorded the results. Findings are shown in Table 2.
Based on Table 1, if the students were to add 2.50 moles of NaCl to 1.00 kg of water, the freezing point of the resulting solution would most likely be:
Explanation: The correct answer is B. Table 1 reveals a perfectly linear pattern: each additional 0.50 moles of NaCl lowers the freezing point by exactly 1.86°C. At 2.00 moles, the freezing point is −7.44°C. Adding 0.50 more moles (reaching 2.50 moles) would lower the freezing point by another 1.86°C: −7.44 − 1.86 = −9.30°C. A (−8.30°C) represents a drop of only 0.86°C — an arithmetic error that doesn't apply the full 1.86°C interval. C (−10.51°C) confuses the boiling point elevation value with the freezing point calculation. D (−11.16°C) adds two full intervals instead of one. Pro tip: Linear extrapolation questions require identifying the constant change per interval, then applying it once to the last known data point.
PASSAGE II
BIOLOGY: This passage is adapted from a study on the factors affecting the rate of photosynthesis in aquatic plants.
Introduction
Photosynthesis is the process by which green plants use sunlight to synthesize nutrients from carbon dioxide (CO2) and water (H2O). The process releases oxygen (O2) as a byproduct according to the following chemical equation: 6CO2+6H2O+light energy→C6H12O6+6O2 Students conducted three studies to investigate how different environmental factors affect the rate of photosynthesis in Elodea, an aquatic plant. The rate was measured by counting the number of oxygen bubbles produced by a cut stem of Elodea submerged in water over a 5-minute period.
Study 1
To test the effect of light intensity, students placed a 10 cm sprig of Elodea into a test tube filled with a 0.5% sodium bicarbonate (NaHCO3) solution (a source of CO2). A light source was placed at various distances from the test tube. The temperature was maintained at 25°C. The number of bubbles produced in 5 minutes was recorded.
Study 2
To test the effect of light color (wavelength), students used the same setup as in Study 1. The light source was kept at a constant distance of 10 cm. Colored filters were placed between the light and the plant to isolate specific wavelengths. Clear cellophane was used as a control.
Study 3
To test the effect of CO2 availability, students prepared five test tubes with different concentrations of sodium bicarbonate (NaHCO3). A 10 cm sprig of Elodea was placed in each. The light source was kept constant at 10 cm (white light).
Based on Table 1, as the distance of the light source from the plant increases, the rate of photosynthesis:
Explanation: This is a trend identification question. Table 1 shows that as distance increases from 10 cm to 50 cm, the number of bubbles decreases from 45 to 5. This is a clear, consistent downward trend with no reversals or plateaus. Choice B (decreases only) is correct. Choice A (increases) is opposite of the data. Choice C (decreases then increases) would require the trend to reverse, which doesn't happen. Choice D (constant) would require the same value at all distances. Pro tip: For trend questions, look at the overall pattern from first to last data point.
PASSAGE V
BIOLOGY: This passage is adapted from a study on the metabolic rates of vertebrates. Introduction
Metabolism is the set of chemical reactions that occur in living organisms to maintain life. The metabolic rate is often measured by the amount of oxygen (O2) consumed per gram of body mass per hour.
Animals can be classified based on how they regulate body temperature:
•Endotherms (e.g., mammals, birds) generate their own body heat to maintain a constant internal temperature.
•Ectotherms (e.g., reptiles, amphibians) rely on external heat sources to regulate their body temperature.
Students conducted two studies to compare the metabolic rates of a Mouse (Endotherm) and a Lizard (Ectotherm) of similar body mass.
Study 1
The students placed the mouse and the lizard in separate metabolic chambers. They varied the environmental temperature from 5°C to 35°C in 10°C increments. The animals were kept at rest. The rate of oxygen consumption (mL O2/g⋅hr) was measured after the animals had acclimated to each temperature for 30 minutes. Findings were reported in Figure 1.
Study 2
The students investigated the effect of activity level on metabolic rate. They maintained the environmental temperature at 25°C for both animals. They measured the oxygen consumption while the animals were at rest and while they were running on a treadmill at 1.0 km/hr. Findings were reported in Table 1.
Study 3
To determine if body mass affects metabolic rate within the same group, students measured the resting metabolic rate of three different lizards at 25°C. Findings were reported in Table 2.
Consider the data for the Mouse at 35°C in Figure 1. If the temperature were increased further to 45°C, which of the following predictions is most biologically likely?
Explanation: This is an extrapolation/prediction question requiring biological reasoning. Figure 1 shows the Mouse's metabolic rate decreases from 5°C to a minimum at 25°C, then slightly increases at 35°C (from 1.5 to 2.0). This upturn suggests the beginning of heat stress. At 45°C (well above normal), the mouse would experience severe heat stress and need to activate cooling mechanisms (panting, increased blood flow to extremities for heat dissipation). These cooling processes require energy, increasing metabolic rate. Choice C correctly predicts this biologically realistic response. Choice A (drop to 0) would mean death, not a gradual response. Choice B (continue decreasing) ignores the upturn already visible at 35°C. Choice D (identical to Lizard) is unrealistic—endotherms and ectotherms have fundamentally different metabolic strategies. Pro tip: When extrapolating trends, consider biological limits and stress responses, not just mathematical continuation.
PASSAGE I
CHEMISTRY: This passage is adapted from a study on the solubility of various substances in water.
Solubility is defined as the maximum amount of a solute (substance being dissolved) that can dissolve in a specific amount of solvent (usually water) at a given temperature. The solubility of most solids increases with temperature, while the solubility of most gases decreases with temperature. A student performed an experiment to measure the solubility of three solid salts—Potassium Nitrate (KNO3), Sodium Chloride (NaCl), and Cerium(III) Sulfate (Ce2(SO4)3)—and one gas, Oxygen (O2).
Suppose the student wants to dissolve 10 g of Ce₂(SO₄)₃ in 100 g of water. According to Figure 1, to ensure all the solid dissolves, the temperature of the water must be:
Explanation: This is a threshold reading question with an inverse relationship. Ce₂(SO₄)₃ has unusual retrograde solubility (decreases with temperature). According to Figure 1, at 0°C the solubility is 20 g, and it decreases to about 10 g somewhere around 60-70°C. To dissolve 10 g, you need the solubility to be at least 10 g. Since solubility DECREASES as temperature increases for this substance, higher temperatures mean LESS dissolves. Therefore, to dissolve 10 g, you need to be at or below the temperature where solubility equals 10 g (approximately 65°C). Choice D (less than 70°C) is correct. Choice A (less than 20°C) is overly restrictive—any temp below ~65°C works. Choice B (greater than 80°C) is wrong—at 80°C solubility is only about 8 g. Choice C (exactly 100°C) is wrong—at 100°C solubility is only 5 g. Pro tip: For inverse relationships, remember that higher temperature = lower solubility.
PASSAGE VII
PHYSICS: Research Summary
Introduction
When an object falls through a fluid (like air), it experiences a downward gravitational force (Fg) and an upward air resistance, or drag force (Fd). As the object's falling speed increases, Fd also increases. Eventually, Fd becomes exactly equal to Fg. At this point, the net force on the object is zero, and it stops accelerating, falling at a constant maximum speed known as terminal velocity (vt). Students investigated terminal velocity by dropping standard paper coffee filters from a height of 5 meters.
Study 1
The students nested (stacked) different numbers of coffee filters (N) together. Nesting the filters increased the total mass (m) of the falling object without significantly changing its cross-sectional area. They dropped the nested filters and used a motion sensor to record the terminal velocity (vt) in meters per second (m/s). Findings are shown in Table 1.
Study 2
The students investigated how cross-sectional area (A) affects terminal velocity. They built 4 small parachutes of different cross-sectional areas. They attached a constant 10.0-gram mass to each parachute and dropped them from 5 meters, recording the vt. Findings are shown in Table 2.
Based on the trend in Study 2, if the students built a 5th parachute with a cross-sectional area of 500 cm² and attached the same 10.0-gram mass, the terminal velocity would most likely be:
Explanation: The correct answer is D. Table 2 shows that as cross-sectional area increases, terminal velocity decreases: Parachute W (100 cm², 4.0 m/s), X (200 cm², 2.8 m/s), Y (300 cm², 2.3 m/s), Z (400 cm², 2.0 m/s). A 500 cm² parachute has a larger area than Z (400 cm²), so its terminal velocity must be lower than Z's 2.0 m/s. A is wrong — greater area produces lower, not higher, terminal velocity. B is wrong — 2.8 m/s corresponds to Parachute X (200 cm²), not 500 cm². C is wrong — the range 2.0–2.3 falls between Parachutes Y and Z (300–400 cm²); 500 cm² is beyond both. Pro tip: Extrapolation beyond the last data point requires confirming the direction of the trend and predicting a value that continues that trend.
PASSAGE I
CHEMISTRY: This passage is adapted from a study on the solubility of various substances in water.
Solubility is defined as the maximum amount of a solute (substance being dissolved) that can dissolve in a specific amount of solvent (usually water) at a given temperature. The solubility of most solids increases with temperature, while the solubility of most gases decreases with temperature. A student performed an experiment to measure the solubility of three solid salts—Potassium Nitrate (KNO3), Sodium Chloride (NaCl), and Cerium(III) Sulfate (Ce2(SO4)3)—and one gas, Oxygen (O2).
According to Figure 1, which of the three solid substances shows the least change in solubility as the temperature increases from 0°C to 100°C?
Explanation: This is a trend comparison question asking you to identify which curve is flattest (least change). NaCl shows almost no change in solubility across the entire temperature range—starting at 35 g at 0°C and only rising to 39 g at 100°C (a change of just 4 g). In contrast, KNO₃ changes dramatically (13 g to over 200 g), and Ce₂(SO₄)₃ also changes substantially (20 g to 5 g, a 15 g decrease). Choice B (NaCl) is correct because its curve is nearly horizontal (flat), indicating minimal change. Choice A (KNO₃) shows the MOST change with its steep upward curve. Choice C (Ce₂(SO₄)₃) shows significant change (downward). Choice D is obviously wrong—the curves have very different slopes. Pro tip: For least/greatest change questions, compare the total vertical distance each curve travels.
PASSAGE IV
GEOPHYSICS: This passage is adapted from a study on the structure of Earth's interior using seismic waves.
Seismologists study the interior of the Earth by analyzing the propagation of seismic waves generated by earthquakes. There are two main types of body waves:
•P-waves (Primary waves): Compressional waves that travel through solids, liquids, and gases.
•S-waves (Secondary waves): Shear waves that travel only through solids.
The velocity of these waves depends on the density and physical state (solid or liquid) of the material they travel through. Abrupt changes in velocity indicate boundaries between Earth's layers.
Which of the following statements best describes the relationship between depth and density within the Mantle (0-2,900 km), according to Figure 2?
Explanation: This is a trend description question. Figure 2 shows that within the Mantle region (from the surface to 2,900 km), density increases from approximately 3.0 g/cm³ to 5.5 g/cm³. This is a steady upward trend. Choice B (density increases) correctly describes this relationship. Choice A (decreases) is opposite of the actual trend. Choice C (constant) would require a flat horizontal line. Choice D (fluctuates) would require up-and-down variation not present in the data. Pro tip: For relationship questions, focus on the overall direction of change within the specified range.