Interpreting Data from Tables
Help Questions
ACT Science › Interpreting Data from Tables
Based on the passage, which of the following fragments from Table 1 would migrate the furthest distance from the starting well during electrophoresis?
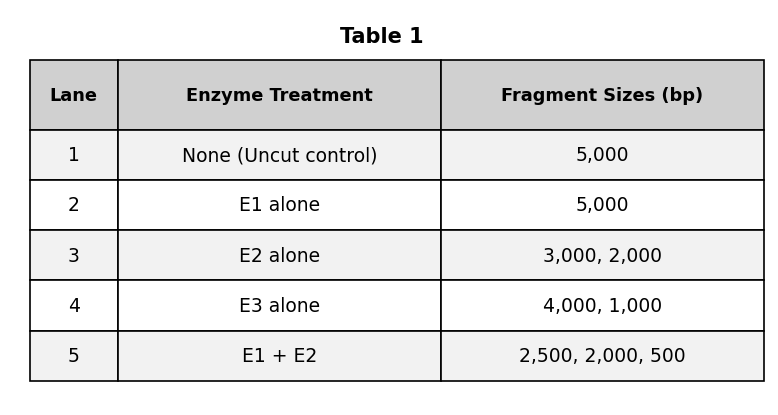
The 500 bp fragment in Lane 5
The 2,000 bp fragment in Lane 5
The 3,000 bp fragment in Lane 3
The 5,000 bp fragment in Lane 2
Explanation
The correct answer is D (the 500 bp fragment in Lane 5). The passage states that smaller fragments travel further during electrophoresis. Among all the fragments listed in Table 1 — 5,000 bp, 3,000 bp, 2,000 bp, 4,000 bp, 1,000 bp, 2,500 bp, and 500 bp — the smallest is 500 bp in Lane 5. The smallest fragment experiences the least resistance passing through the gel matrix, moves fastest under the electrical current, and therefore travels the greatest distance from the starting well. A (5,000 bp) is the largest fragment and would travel the least distance. B (3,000 bp) and C (2,000 bp) are intermediate sizes. On migration distance questions, identify the smallest fragment across all lanes in the table.
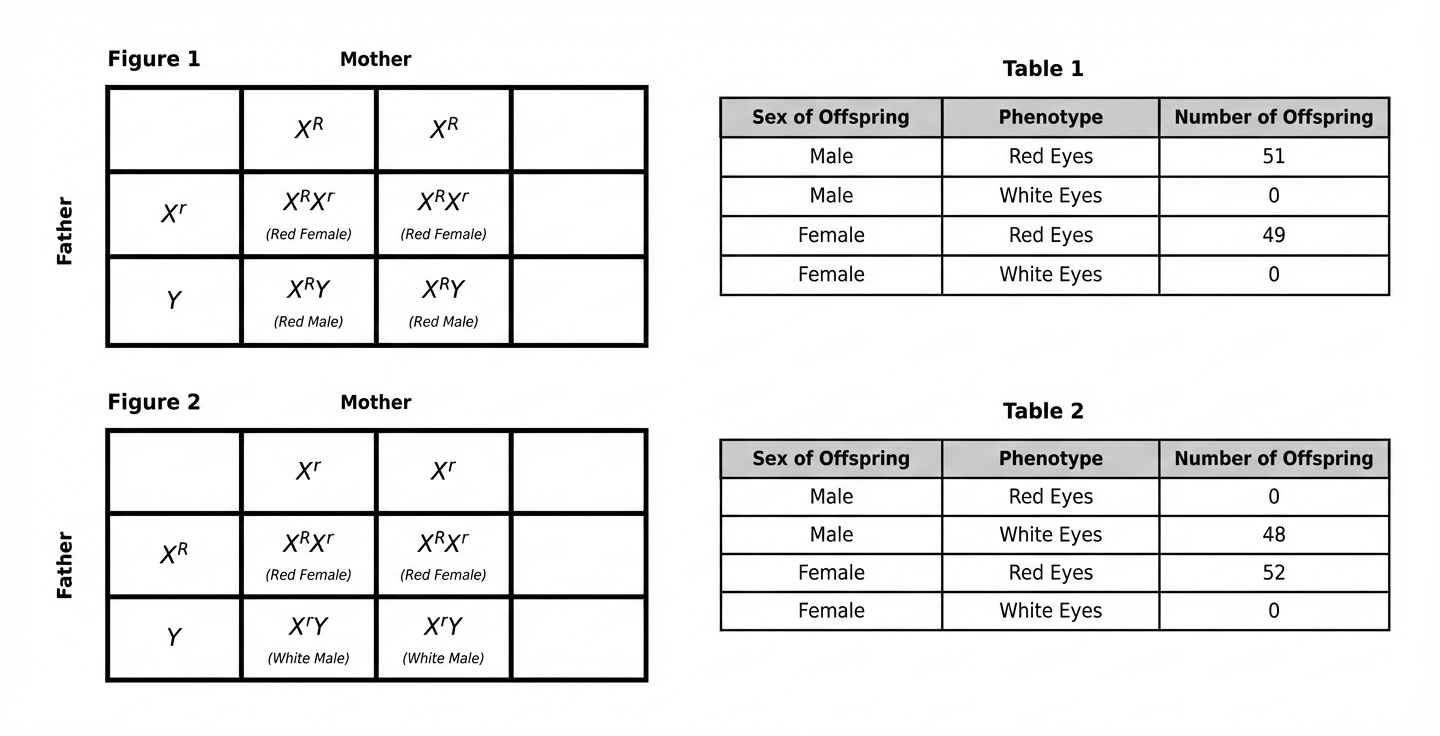
Based on Table 1, what percent of the F1 offspring in Study 1 had white eyes?
0%
25%
50%
100%
Explanation
This is a straightforward data retrieval and percentage calculation question. You can identify this question type by the phrase "what percent" combined with "based on Table 1." To solve this, look at Table 1 and find all offspring with white eyes: Male White Eyes = 0, Female White Eyes = 0. Total white-eyed offspring = 0 out of 100 total. Therefore, 0/100 = 0%. Choice B (25%) represents a typical Mendelian ratio but doesn't match the actual data. Choice C (50%) is another common genetic ratio. Choice D (100%) is the opposite extreme. These wrong answers might tempt students who are trying to recall genetics ratios from memory instead of actually reading the table. Remember: Always use the actual data provided, not what you think "should" happen based on genetic theory—real experimental data may show all offspring with one trait, especially in sex-linked crosses!
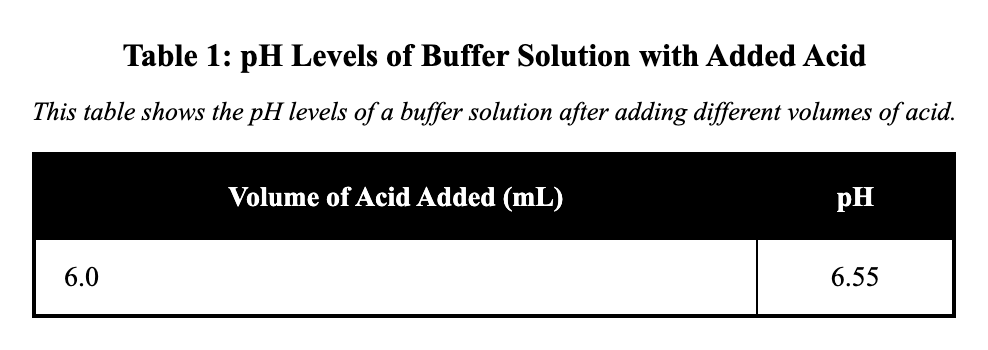
A chemistry lab measured the pH of a buffer solution after adding different volumes of acid. Use Table 1 to answer the question.
When 6.0 mL of acid was added, the pH was:
6.10
6.35
6.55
6.80
Explanation
When 6.0 mL of acid was added, the pH was 6.55. In Table 1, locate the row for 6.0 mL acid volume and read across to the pH column to find the value of 6.55. This shows how the buffer solution's pH decreases as more acid is added, but the change is gradual due to the buffering capacity.
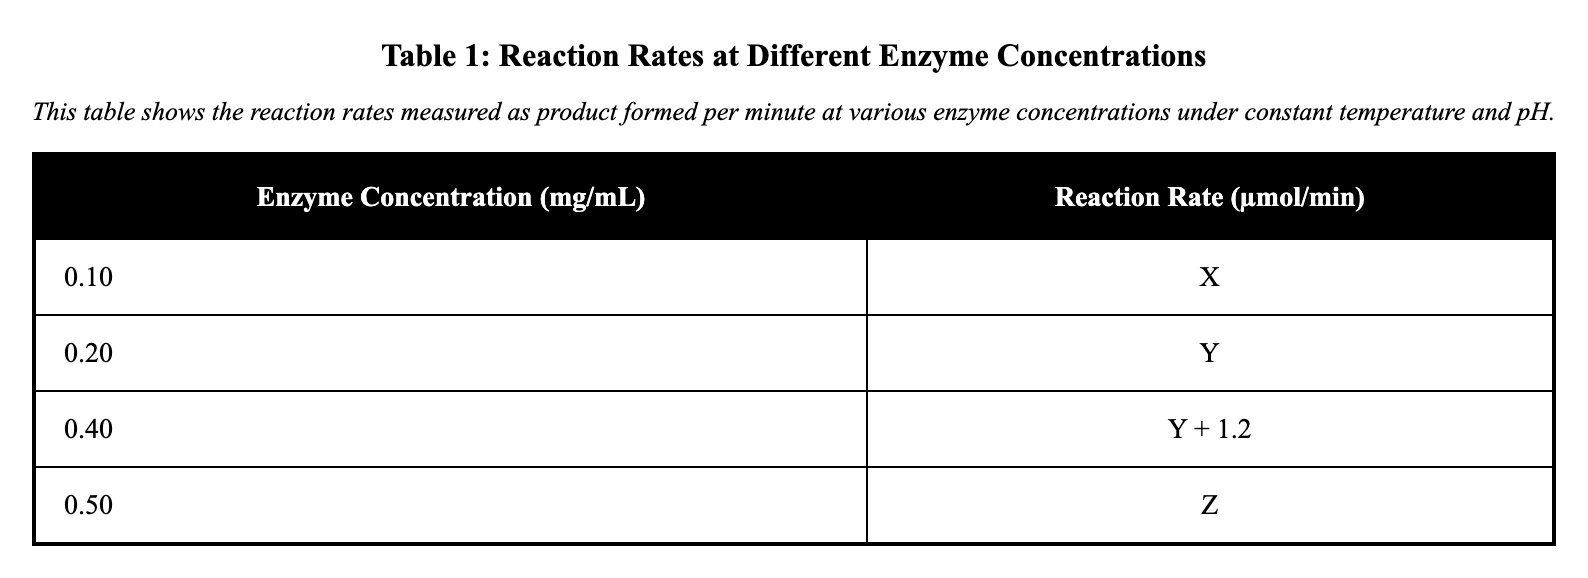
A lab tested how enzyme concentration affects reaction rate. Reaction rate was measured as product formed per minute under constant temperature and pH. Table 1 lists the results.
Based on Table 1, when enzyme concentration increased from 0.20 mg/mL to 0.40 mg/mL, the reaction rate changed by:
0.8 µmol/min
2.0 µmol/min
1.2 µmol/min
3.2 µmol/min
Explanation
Table 1 lists reaction rates at different enzyme concentrations. To find the change from 0.20 mg/mL to 0.40 mg/mL, subtract the rate at 0.20 mg/mL from that at 0.40 mg/mL, resulting in 1.2 µmol/min. This calculation uses values from the specific rows in the rate column. Miscalculation might involve adding instead of subtracting, or using wrong concentrations like 0.10 mg/mL.
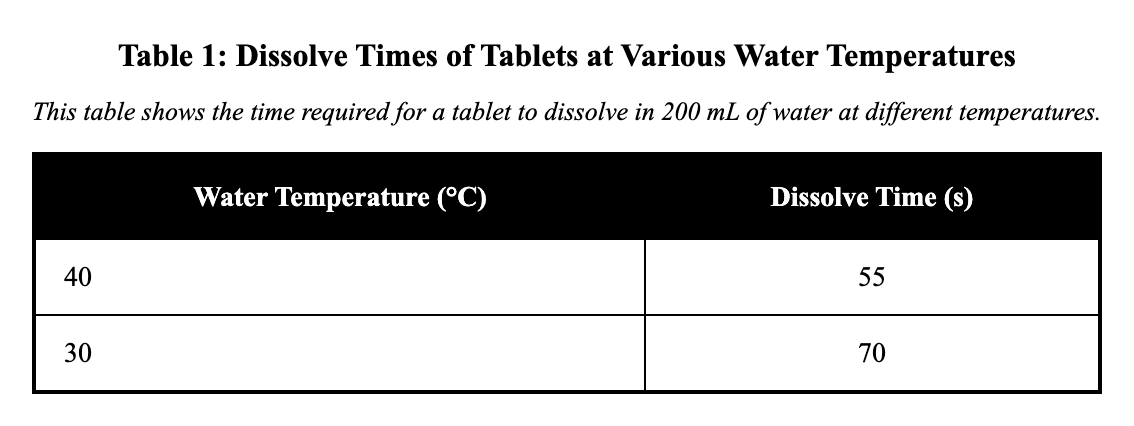
Researchers tested how water temperature affects the time needed for a tablet to dissolve in 200 mL of water. Each trial used the same tablet mass and the same stirring rate. The results are shown in Table 1.
According to Table 1, what was the dissolve time when the water temperature was 40 °C?
95 s
55 s
70 s
120 s
Explanation
Table 1 shows dissolve times for tablets at different water temperatures. To find the dissolve time at 40 °C, locate the row for 40 °C in the temperature column and read across to the dissolve time column, where the value is 55 s. This is correct because the table organizes data by increasing temperature, ensuring accurate lookup for the specific condition. A key distractor might be misreading the row for a nearby temperature like 30 °C, which could show 70 s instead.
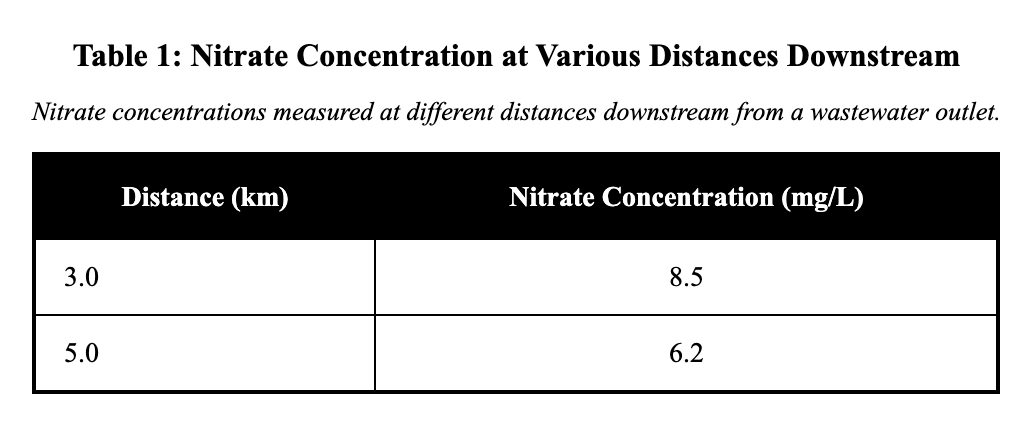
An environmental lab measured nitrate concentration in river water at different distances downstream from a wastewater outlet. Samples were collected the same day and analyzed with the same instrument. Table 1 reports the results.
At a distance of 5.0 km downstream, the nitrate concentration was:
10.1 mg/L
6.2 mg/L
3.8 mg/L
8.5 mg/L
Explanation
Table 1 reports nitrate concentrations at various distances downstream from a wastewater outlet. To find the concentration at 5.0 km, locate the row for 5.0 km in the distance column and read the corresponding value in the nitrate concentration column, which is 6.2 mg/L. This approach is correct as it directly intersects the specific distance with the measurement column for precise data retrieval. Misreading might occur by selecting the value from an adjacent row, such as 3.0 km showing 8.5 mg/L.
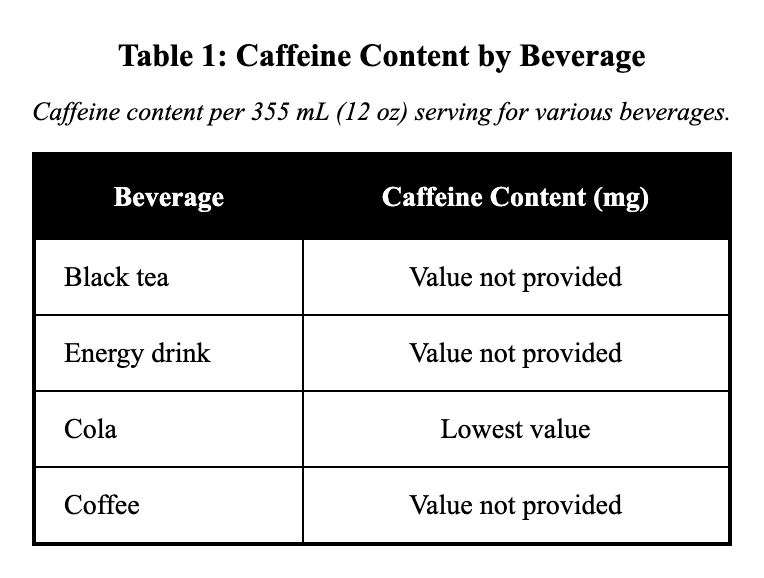
A nutrition study compared the caffeine content of several beverages. Each value in Table 1 represents the caffeine measured from a 355 mL (12 oz) serving. The same analytical method was used for all beverages.
Based on Table 1, which beverage had the lowest caffeine content per serving?
Cola
Coffee
Black tea
Energy drink
Explanation
Table 1 compares caffeine content per 355 mL serving for several beverages. To identify the beverage with the lowest caffeine, compare values in the caffeine column, finding cola as the lowest. This is achieved by scanning the column for the minimum value among the listed beverages. Confusion might arise from misordering the values, incorrectly selecting black tea as lowest.
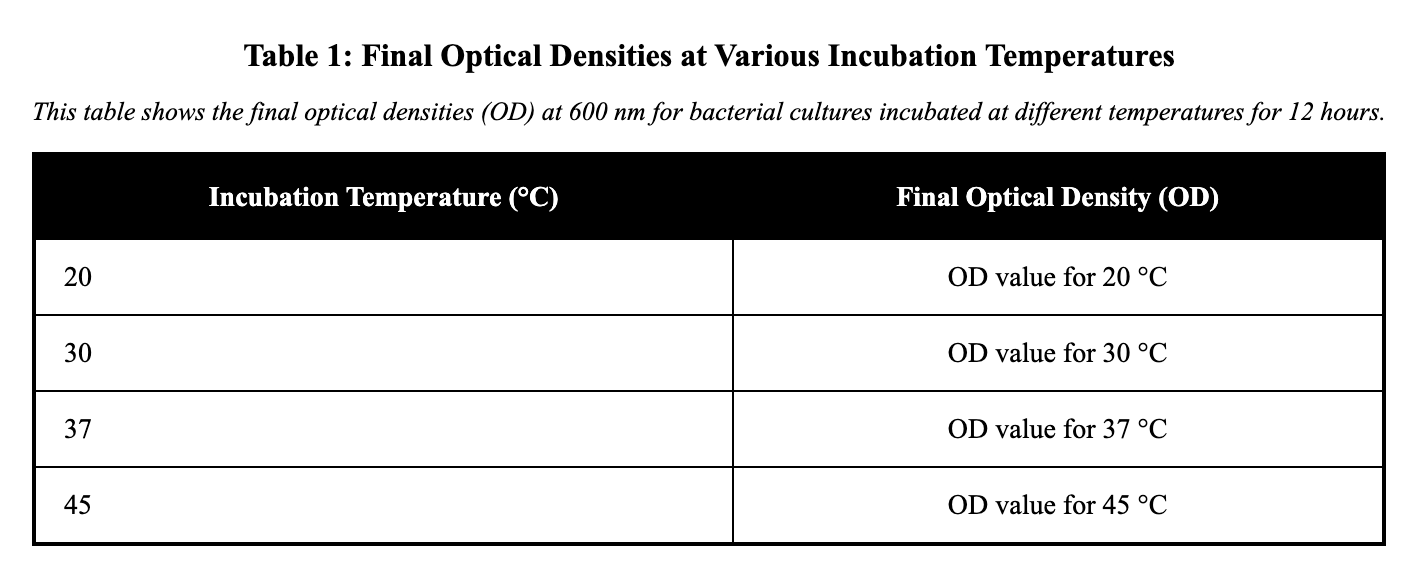
A microbiology lab incubated bacterial cultures at different temperatures for 12 hours and then measured optical density (OD) at 600 nm as an estimate of cell density. All cultures started with the same initial OD. Table 1 reports the final measurements.
Based on Table 1, at which incubation temperature was the final OD highest?
20 °C
37 °C
45 °C
30 °C
Explanation
Table 1 reports final optical densities for bacterial cultures at various incubation temperatures. To find the temperature with the highest final OD, scan the OD column and identify the maximum value at 37 °C. This is correct by comparing all entries in the column to pinpoint the peak growth indicator. Misreading could lead to selecting 30 °C if overlooking the highest value in the list.
A researcher measured the heart rate of a participant after different exercise intensities on a stationary bike. Each intensity was maintained for 5 minutes, and heart rate was measured immediately afterward. Table 1 shows the results.
Which exercise intensity produced the greatest increase in heart rate compared with rest?
Low
Very high
Moderate
High
Explanation
Table 1 displays heart rates after different exercise intensities compared to rest. To find which intensity produced the greatest increase, calculate differences from rest for each row and identify 'very high' as the maximum. This involves subtracting rest values from each intensity's heart rate column entry. Misinterpretation might occur by just looking at absolute rates without comparing to rest, leading to a wrong choice like 'high'.
Suppose the students performed an additional trial in Study 1 with the light source placed at 25 cm. Based on the trend in Table 1, the number of bubbles produced would most likely be:
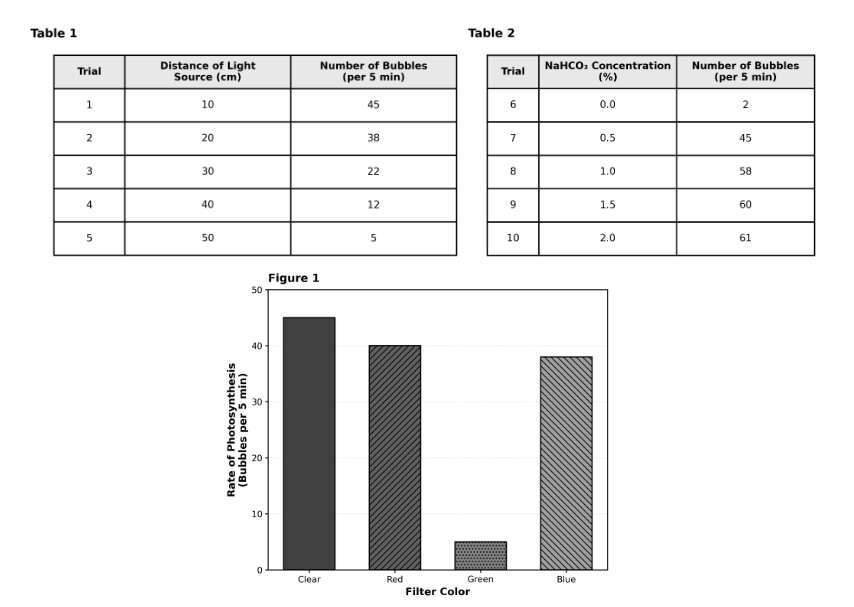
between 22 and 38.
greater than 45.
less than 5.
between 38 and 45.
Explanation
This is an interpolation question. Looking at Table 1, at 20 cm the plant produced 38 bubbles, and at 30 cm it produced 22 bubbles. The value 25 cm falls exactly between these two distances, so the bubble count should fall between 22 and 38. Choice C is correct. Choice A (greater than 45) would require the light to be closer than 10 cm. Choice B (between 38 and 45) would be for distances between 10 cm and 20 cm. Choice D (less than 5) would be for distances greater than 50 cm. Pro tip: For interpolation, find the two surrounding known values and choose the range between them.