Interpreting Data from Diagrams
Help Questions
ACT Science › Interpreting Data from Diagrams
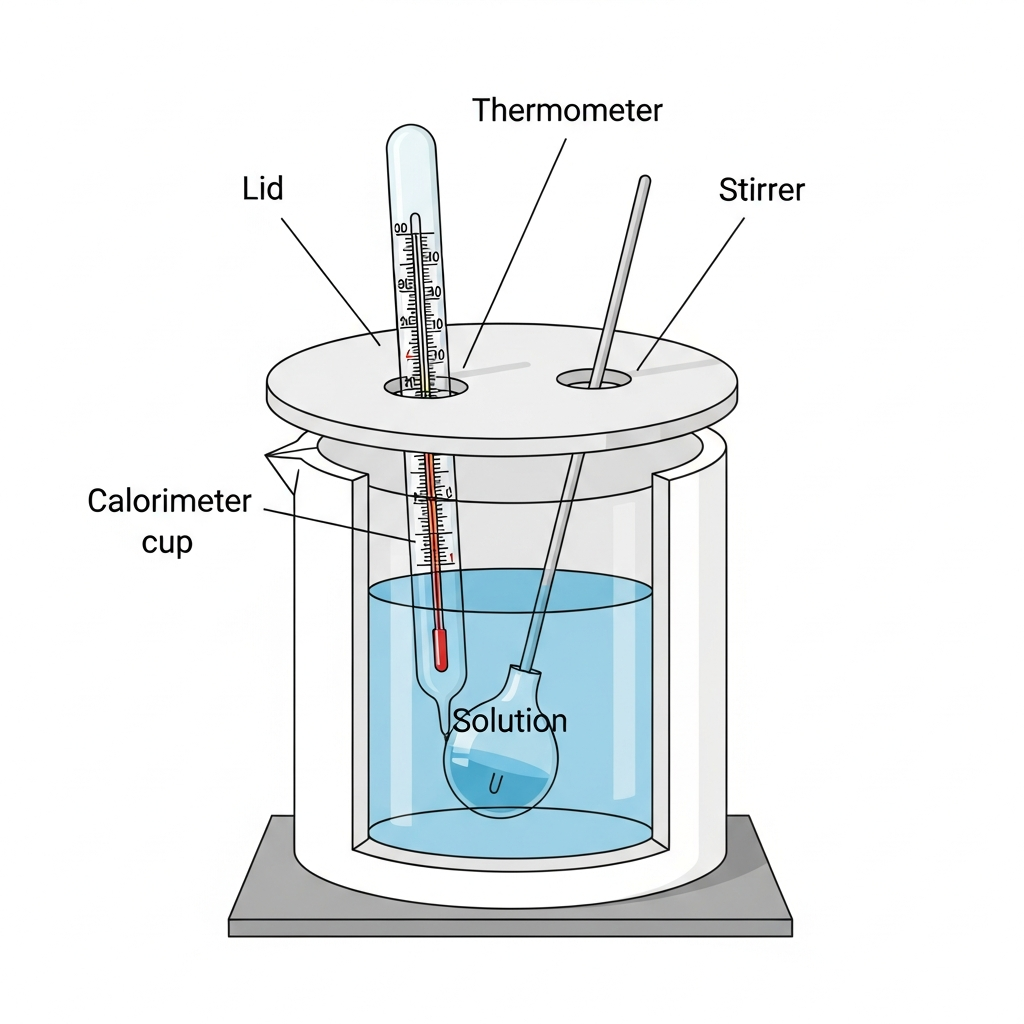
A student uses a calorimeter to measure heat released by dissolving a salt in water. Figure 1 shows the calorimeter cup, lid, thermometer, and stirrer, including which parts contact the solution. According to Figure 1, which component is inserted through the lid and extends into the solution to measure temperature?
The thermometer probe
The stirrer rod
The outer support ring
The insulating foam jacket
Explanation
The calorimeter diagram shows a cross-sectional view with the lid on top and various components passing through it. The thermometer probe is clearly shown as a long, thin instrument that passes through a hole in the lid and extends down into the solution inside the calorimeter cup. This positioning allows it to measure the temperature of the solution directly. The stirrer rod also passes through the lid but serves a different function of mixing the solution.
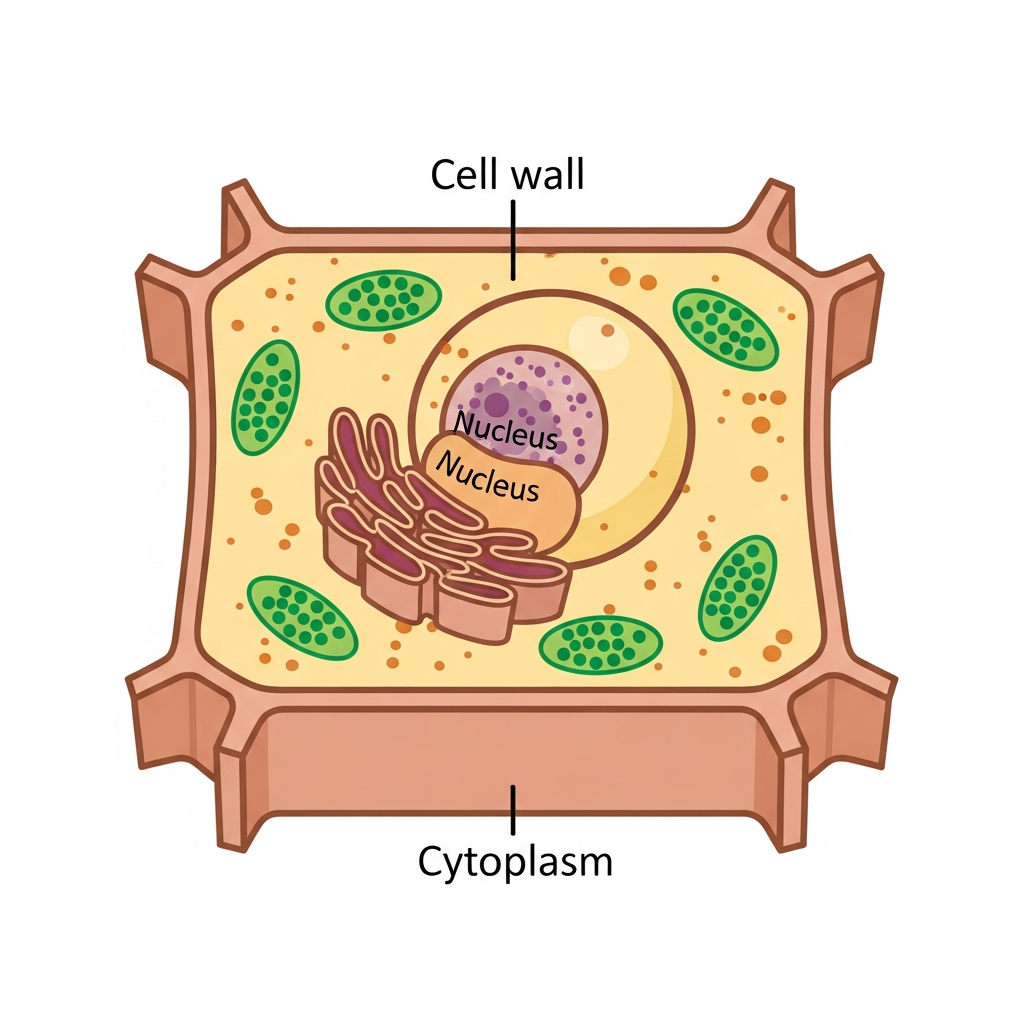
A researcher records the positions of structures in a simplified plant cell diagram (Figure 1). The nucleus is drawn near the center, and the central vacuole occupies most of the interior. According to Figure 1, the chloroplasts are located:
Within the central vacuole, floating in the cell sap
In the cytoplasm near the cell membrane, outside the vacuole
Inside the nucleus, surrounding the nucleolus
Embedded in the cell wall, between wall layers
Explanation
The plant cell diagram shows a large central vacuole occupying most of the cell's interior, with the nucleus near the center and chloroplasts distributed in the cytoplasm. The chloroplasts are clearly drawn as small oval structures positioned in the cytoplasm between the cell membrane and the central vacuole, not inside any other organelle. This peripheral location in the cytoplasm allows chloroplasts to capture light efficiently while remaining outside the vacuole's aqueous interior.
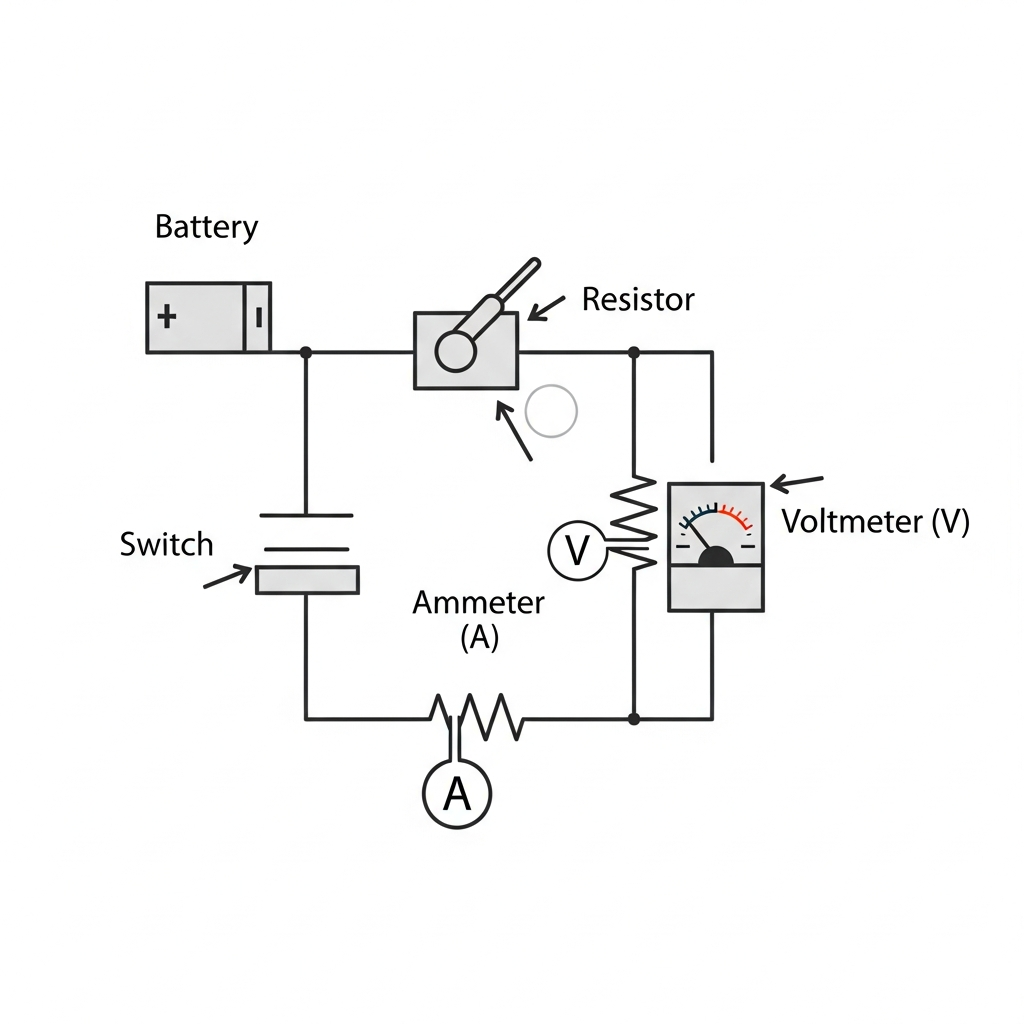
A physics class sets up a simple circuit to test how current changes when a switch is opened or closed. Figure 1 shows the circuit layout and the placement of the ammeter and voltmeter. Based on Figure 1, which component is connected in parallel with the resistor?
The switch
The ammeter
The battery
The voltmeter
Explanation
The circuit diagram shows a resistor connected in the main circuit path with an ammeter in series and a voltmeter connected across the resistor. The voltmeter is drawn with connection lines that branch off from both sides of the resistor, creating a parallel path that doesn't interrupt the main current flow. This parallel connection allows the voltmeter to measure the potential difference across the resistor. The ammeter is in series with the resistor, not parallel, as current must flow through it.
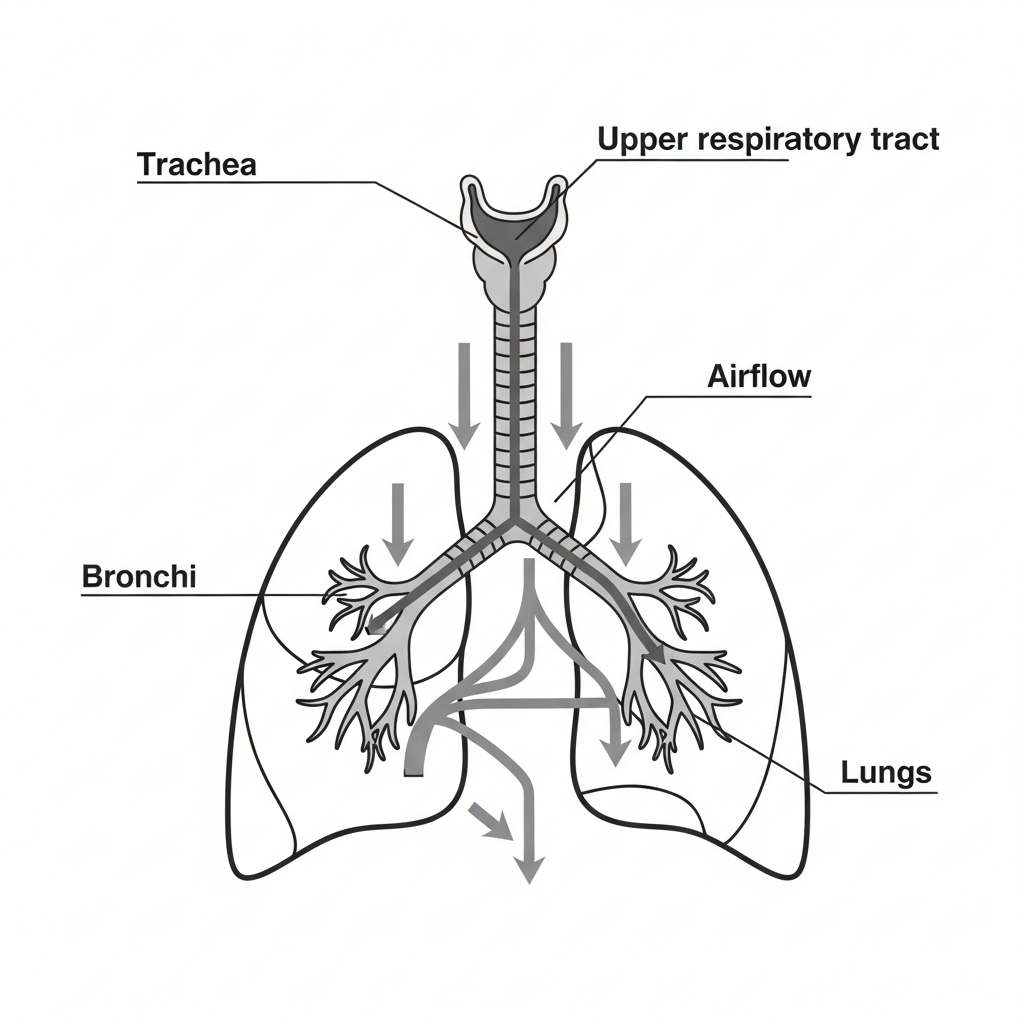
A biologist traces airflow through a simplified human respiratory system diagram (Figure 1). Arrows indicate the direction of airflow during inhalation. Based on Figure 1, air flows from the trachea directly into the:
Esophagus
Alveoli
Bronchi
Diaphragm
Explanation
The respiratory system diagram shows the trachea as the main airway that branches into two tubes labeled as bronchi. Arrows indicating airflow during inhalation show air moving down the trachea and then splitting into the left and right bronchi at the branching point. The bronchi then continue to branch into smaller airways leading to the alveoli. The diagram clearly shows this direct connection between trachea and bronchi without any intervening structures.
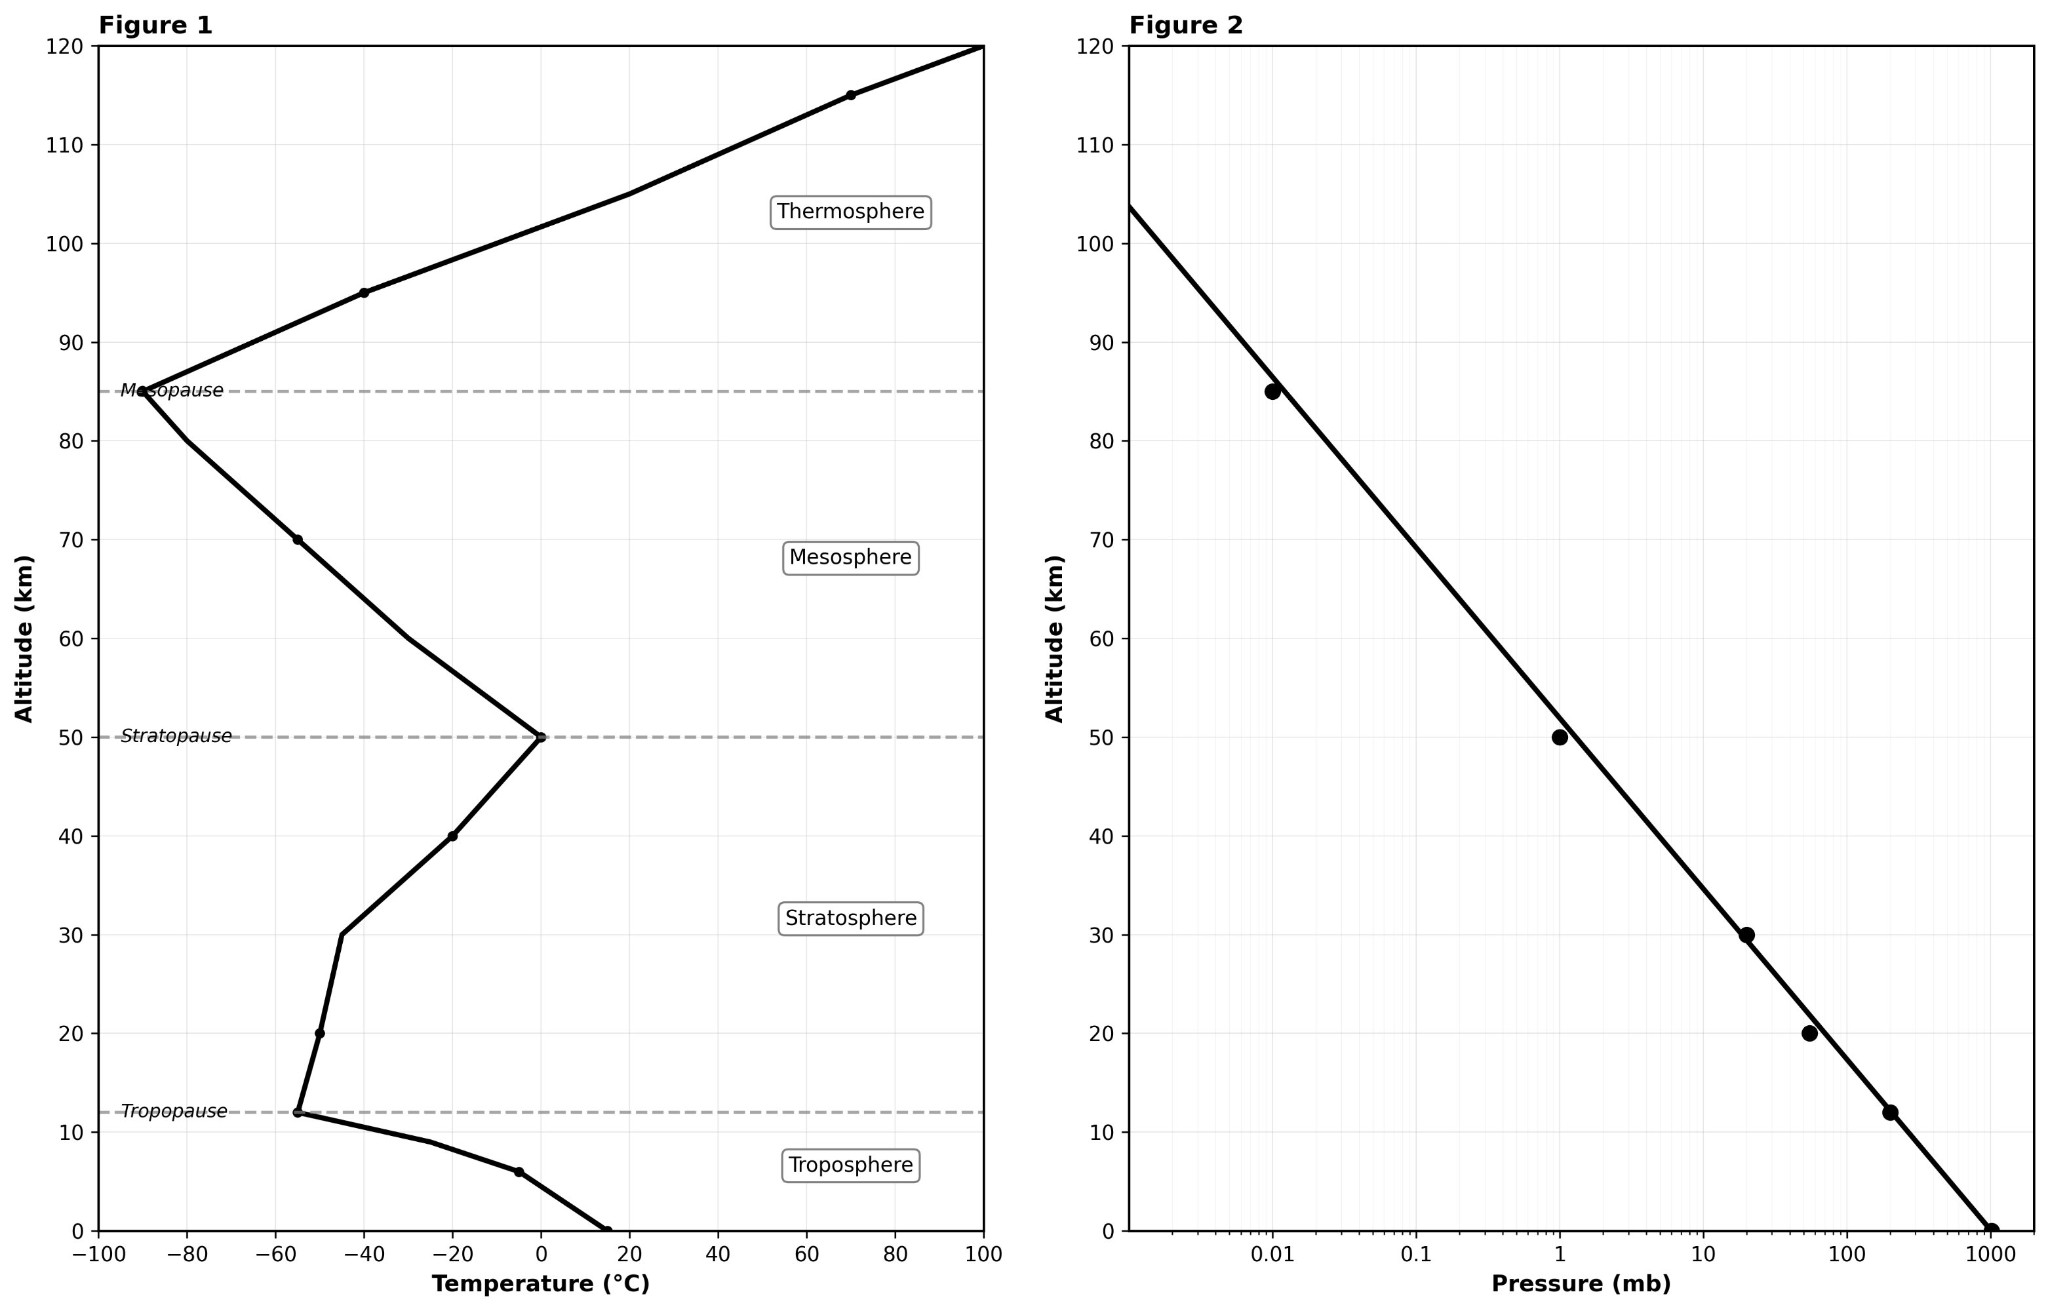
Based on Figure 1, the "Stratopause" separates which two atmospheric layers?
Stratosphere and Mesosphere
Troposphere and Stratosphere
Mesosphere and Thermosphere
Thermosphere and Exosphere
Explanation
This is a label reading question that tests your ability to identify boundaries between layers on a labeled diagram. Whenever you see a question asking about a "pause" (tropopause, stratopause, mesopause), remember that these are the boundaries BETWEEN atmospheric layers. To solve this, locate the "Stratopause" label on Figure 1—it's marked at approximately 50 km altitude. The stratopause is the TOP of the stratosphere, so it separates the stratosphere (below) from the mesosphere (above). Choice A is wrong—that boundary is the tropopause. Choice C is wrong—that boundary is the mesopause. Choice D references the exosphere, which isn't even shown on this graph (the graph stops at 120 km in the thermosphere). The trap is thinking "stratopause" is at the bottom of the stratosphere, but the suffix "-pause" marks the TOP boundary where that layer "pauses" or ends. Pro tip: The pattern is consistent: tropopause = top of troposphere, stratopause = top of stratosphere, mesopause = top of mesosphere!
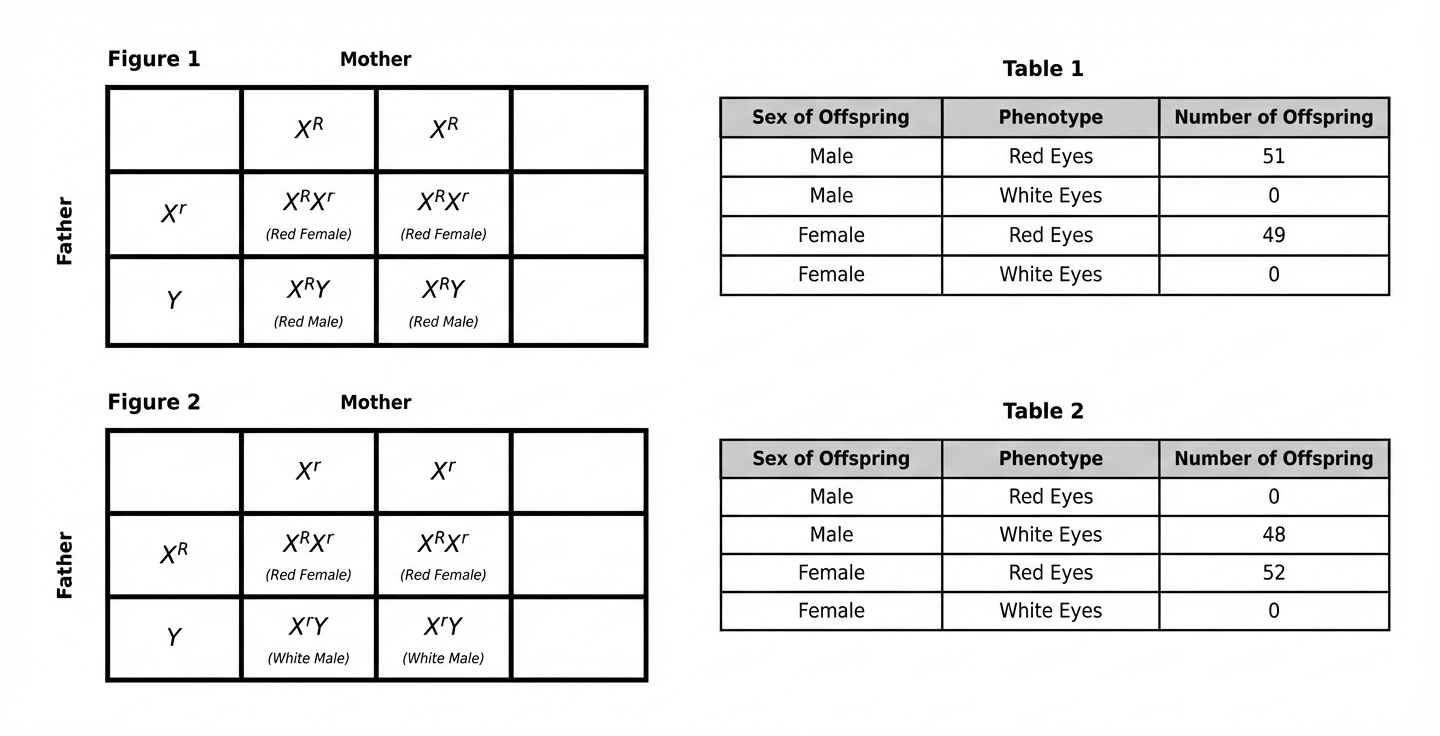
Based on Figure 2, the genotype of all F1 female offspring in Study 2 is:
$X^R$ $X^r$ (heterozygous).
$X^R$ $X^R$ (homozygous dominant).
$X^r$ $X^r$ (homozygous recessive).
$X^R$ Y (hemizygous).
Explanation
This is a Punnett square reading question that tests whether you can extract genotype information from a visual genetic diagram. Whenever you see a question asking about "genotype of offspring" with Punnett squares provided, you simply need to read the appropriate cells from the square. To solve this, look at Figure 2 (Study 2) and identify the cells representing female offspring. In a Punnett square, females result from X-X combinations (not X-Y). The top two cells show $X^R$ $X^r$ and $X^R$ $X^r$—both are heterozygous (one dominant R allele, one recessive r allele). Choice D (homozygous dominant) would require $X^R$ $X^R$, which doesn't appear in Figure 2. Choice C (homozygous recessive) would require $X^r$ $X^r$. Choice A represents a male genotype $(X^R$ Y), not female. The term "heterozygous" means having two different alleles for the same gene. Pro tip: In Punnett squares, females are always the X-X cells (top row usually), and males are the X-Y cells (bottom row usually)—identify which you're looking for first!
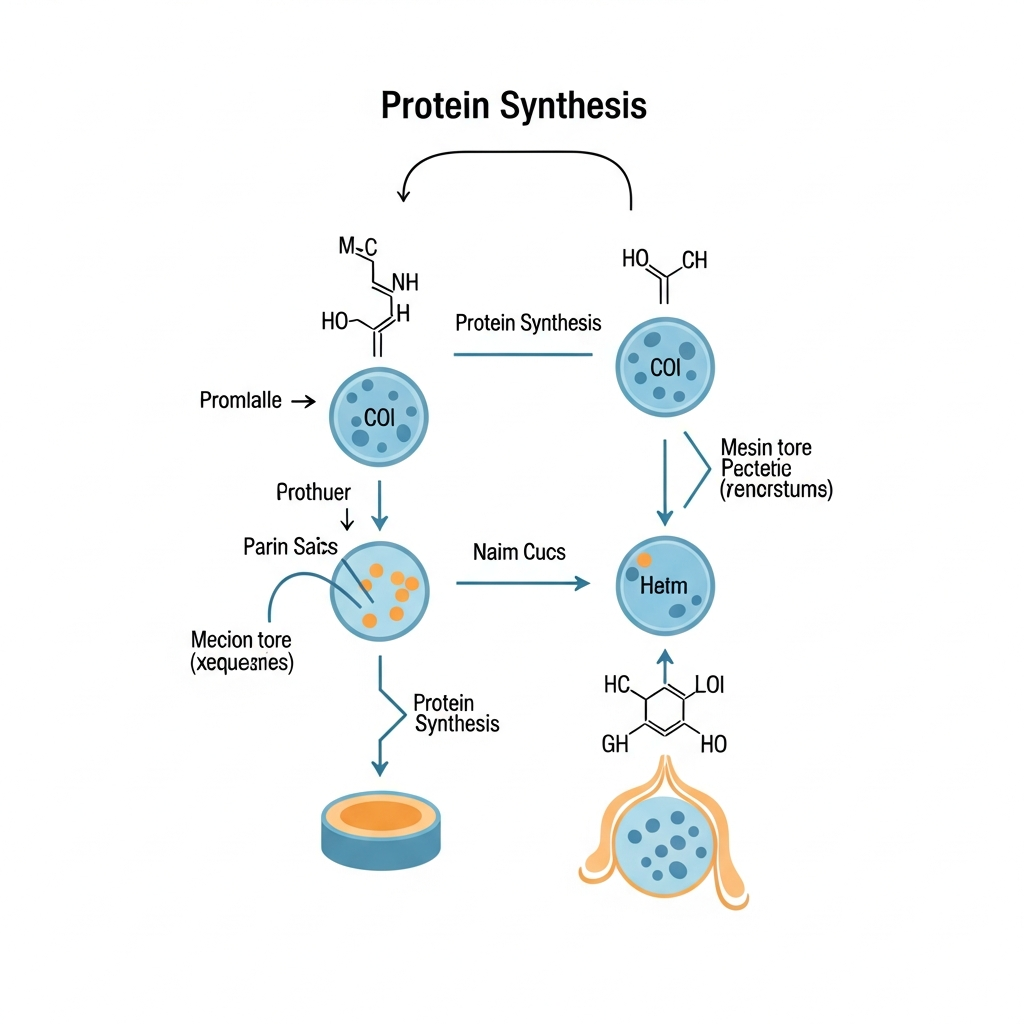
A researcher summarizes the steps of protein synthesis in a process diagram (Figure 1). Arrows show the direction of information flow and movement of molecules. Based on Figure 1, which step occurs immediately after mRNA exits the nucleus?
DNA is replicated in the cytoplasm
tRNA binds amino acids inside the nucleus
A polypeptide enters the nucleus through a pore
mRNA binds to a ribosome in the cytoplasm
Explanation
The protein synthesis diagram shows mRNA moving from the nucleus through a nuclear pore into the cytoplasm, with an arrow indicating its path. The next arrow in the sequence shows the mRNA binding to a ribosome structure in the cytoplasm, which is the immediate next step after nuclear exit. This binding initiates translation where the genetic code is read to produce proteins. The diagram clearly shows this sequential flow from nuclear exit to ribosome binding without intervening steps.
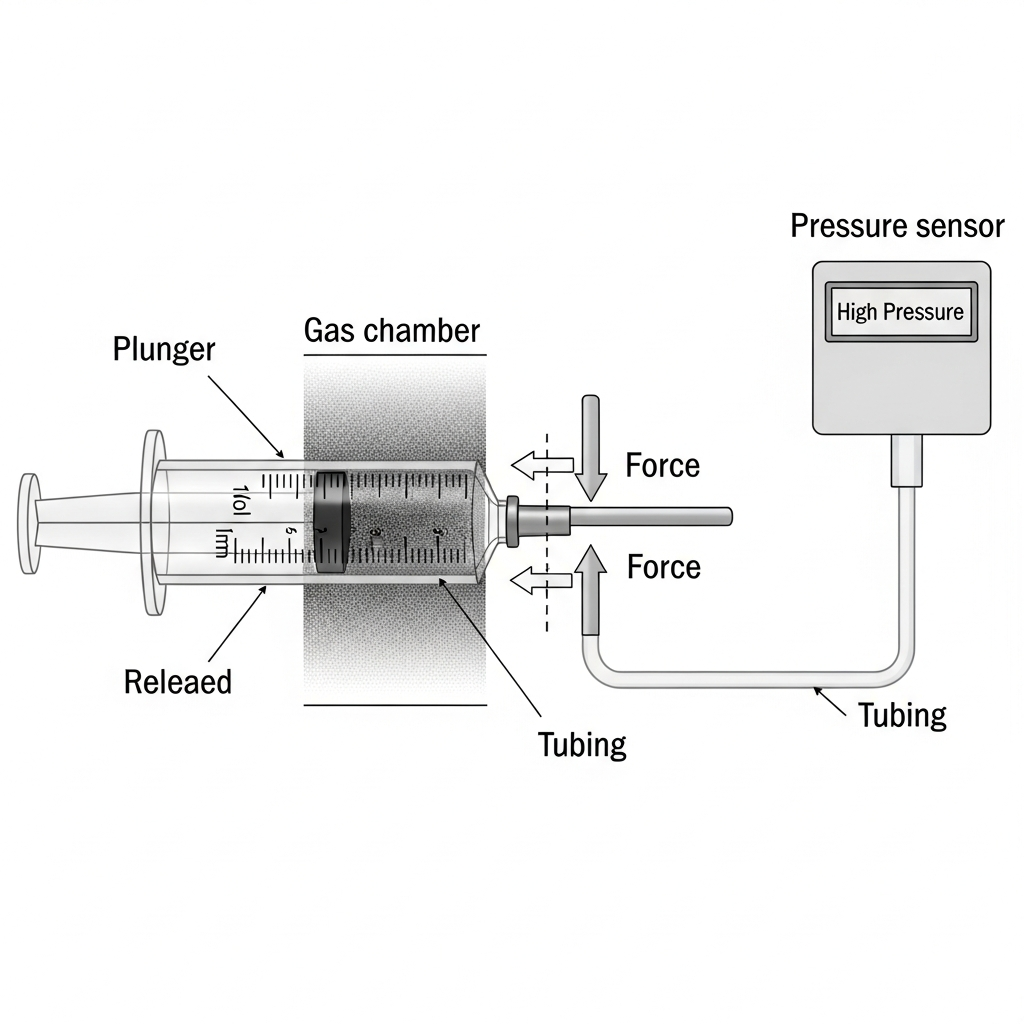
A mechanical engineering student studies a labeled diagram of a syringe connected to a pressure sensor (Figure 1). Arrows indicate the direction of force applied to the plunger. According to Figure 1, increasing pressure in the gas chamber would be most directly caused by moving the plunger:
Upward, increasing the chamber volume
Sideways, without changing the chamber volume
Downward, decreasing the chamber volume
Rotating, which opens the valve to the atmosphere
Explanation
The syringe diagram shows a plunger at the top of a gas chamber with an arrow pointing downward, indicating the direction of applied force. Moving the plunger downward into the chamber reduces the available volume for the gas, which according to gas laws increases the pressure. The diagram clearly shows this downward motion would compress the gas in the sealed chamber. Upward movement would increase volume and decrease pressure, opposite to what's needed.
A student investigates how water flows through a filtration apparatus. Figure 1 shows the setup, including tubing connections and the direction of flow (arrows). The student wants to collect the filtered water that exits the filter. According to Figure 1, which container should receive the filtered water?
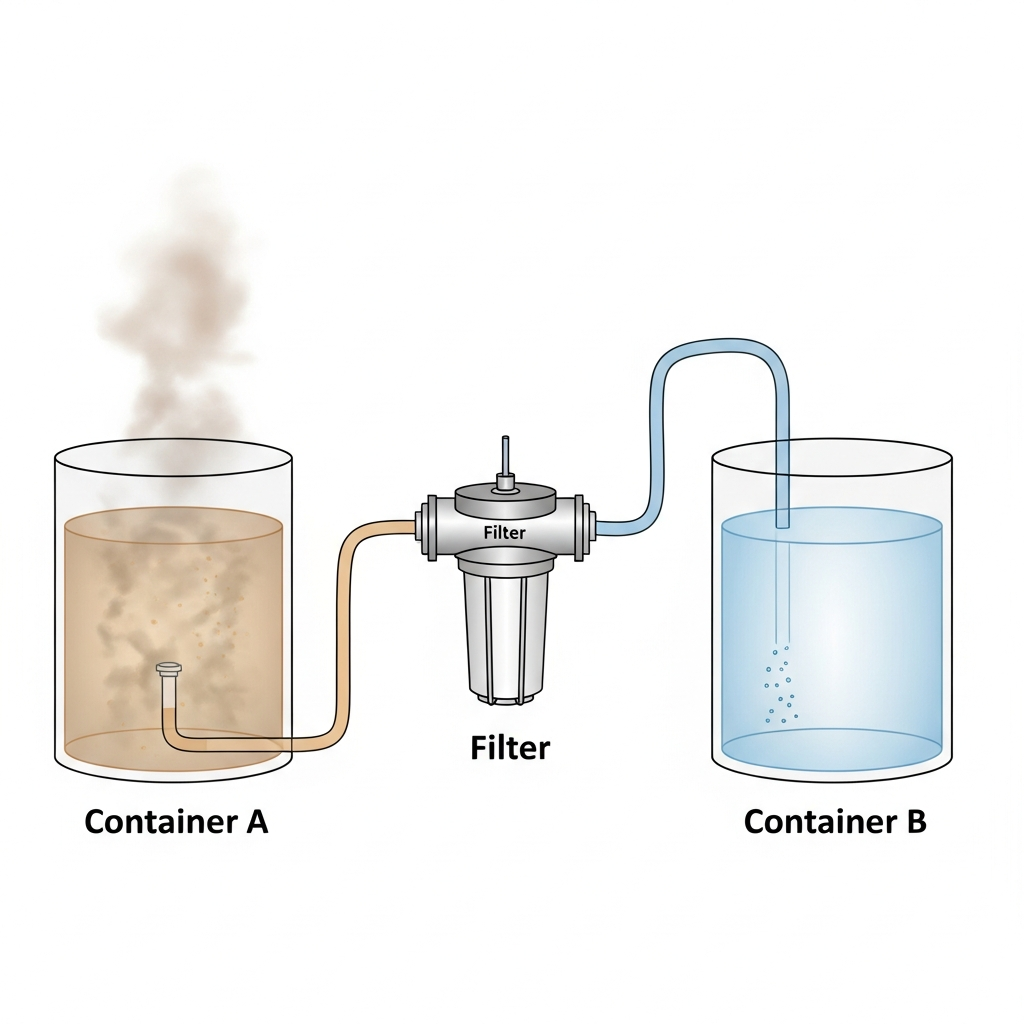
Beaker B (downstream of the filter, after the outlet tube)
Graduated cylinder (connected to the pump inlet line)
Beaker A (upstream of the filter, before the valve)
Waste cup (connected to the pressure gauge port)
Explanation
Figure 1 shows a filtration apparatus with flow direction indicated by arrows, where water moves through the filter and exits via an outlet tube. The diagram clearly shows Beaker B positioned downstream of the filter, directly beneath the outlet tube where filtered water would exit. The arrows indicate water flows from the inlet through the filter and out the outlet tube into Beaker B. Beaker A is positioned upstream before the filter, so it would contain unfiltered water rather than the filtered product.