Evaluating Models & Explanations
Help Questions
ACT Science › Evaluating Models & Explanations
Based on the results of both experiments, which of the following best describes the mathematical relationships between voltage, resistance, and current?
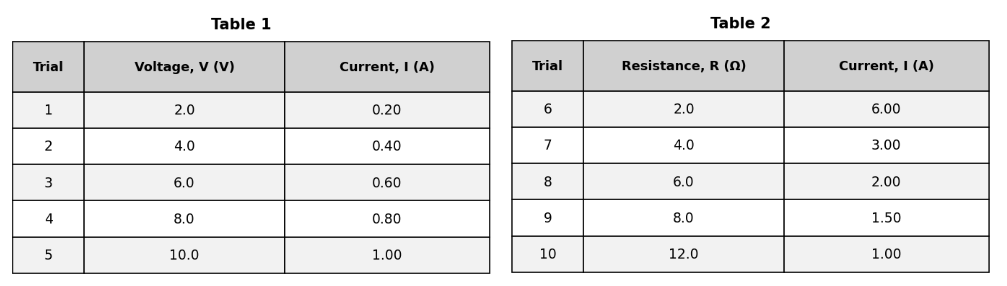
Current is inversely proportional to both voltage and resistance.
Current is directly proportional to both voltage and resistance.
Current is directly proportional to voltage and inversely proportional to resistance.
Current is inversely proportional to voltage and directly proportional to resistance.
Explanation
The correct answer is C. Table 1 establishes the relationship between voltage and current: as voltage increases from 2.0 to 10.0 V, current increases proportionally from 0.20 to 1.00 A. When one quantity increases and the other increases in proportion, they are directly proportional. Table 2 establishes the relationship between resistance and current: as resistance increases from 2.0 to 12.0 Ω, current decreases from 6.00 to 1.00 A. When one quantity increases and the other decreases, they are inversely proportional. C correctly identifies both relationships: current is directly proportional to voltage (Table 1) and inversely proportional to resistance (Table 2). A is wrong — current is not directly proportional to resistance; Table 2 shows the opposite. B is wrong — current is not inversely proportional to voltage; Table 1 shows direct proportionality. D reverses both relationships. This question synthesizes findings from two separate tables to derive Ohm's Law (I = V/R) from the experimental data alone.
Suppose the botanist performs a third study using soil with an NaCl concentration of 100 mM/kg and a pH of 6.5. Based on the results of Study 1, the germination rate would most likely be:
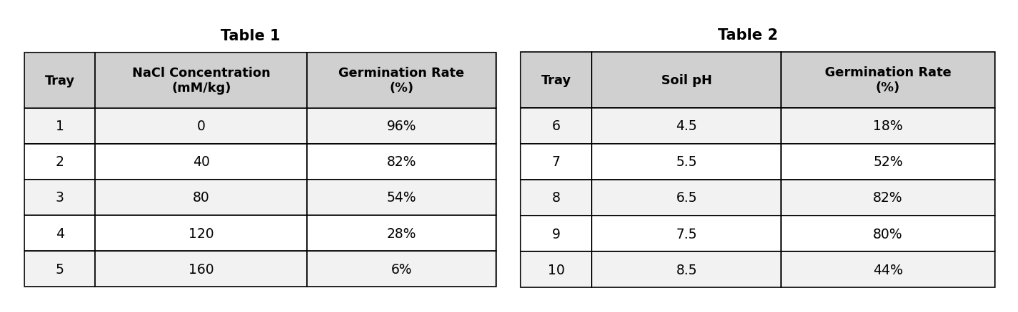
less than 28%.
between 54% and 82%.
greater than 82%.
between 28% and 54%.
Explanation
The correct answer is C (between 28% and 54%). Study 1's data shows that at 80 mM/kg NaCl, the germination rate was 54%, and at 120 mM/kg NaCl, it was 28%. A concentration of 100 mM/kg falls between these two tested values, so the germination rate must fall between their corresponding outcomes: between 28% and 54%. F (greater than 82%) would require a lower NaCl concentration than 40 mM/kg. G (between 54% and 82%) corresponds to concentrations between 40 and 80 mM/kg — too low. H correctly identifies the range between 80 and 120 mM/kg. D (less than 28%) would require a concentration above 120 mM/kg. On interpolation questions, identify the two tested values that bracket the given value and read their corresponding outcomes.
Star X is a Main Sequence star that is exactly twice as hot at its surface as Star D. Based on the mathematical trend shown on the H-R diagram, the luminosity of Star X is approximately:
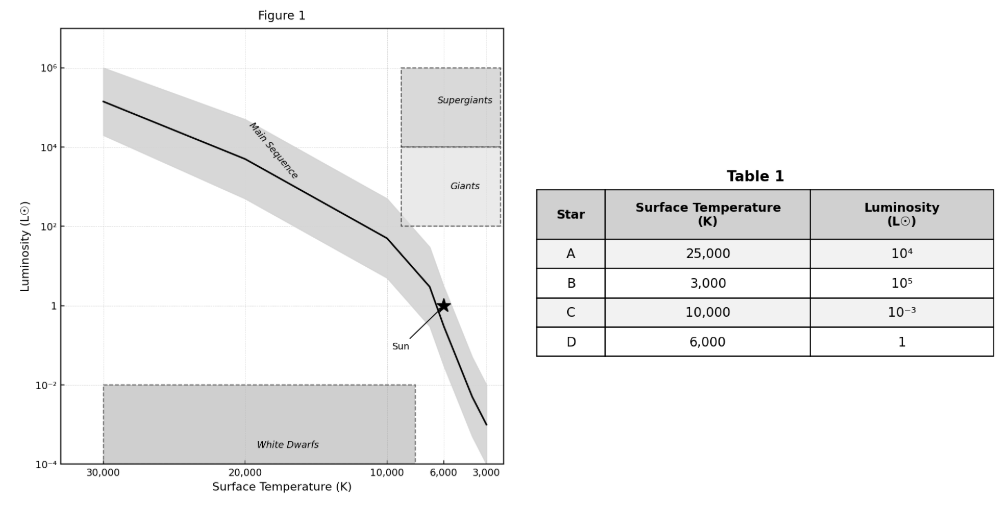
between 10 and 100 times greater than the luminosity of Star D.
between 10⁵ and 10⁶ times greater than the luminosity of Star D.
exactly twice the luminosity of Star D.
exactly half the luminosity of Star D.
Explanation
The correct answer is C. Star D has a surface temperature of 6,000 K and a luminosity of 1 L☉. Twice as hot as Star D is 12,000 K. On the Main Sequence of the H-R diagram, following the diagonal band from 6,000 K (luminosity ~1) to 12,000 K, the luminosity value on the logarithmic y-axis rises to approximately 10² — meaning roughly 100 times the Sun's luminosity. Therefore the luminosity increases by a factor between 10 and 100. A and B (half or twice) dramatically underestimate the increase — the Main Sequence's trend on a log scale shows a much steeper relationship than a simple doubling. D (10⁵ to 10⁶ times greater) dramatically overestimates — these luminosities correspond to the Supergiant region, far above the Main Sequence at 12,000 K. This question tests the ability to read the nonlinear (logarithmic) trend of the Main Sequence rather than applying simple arithmetic. Pro tip: on log-scale diagrams, a visual shift of one unit on the y-axis represents a tenfold change in the actual quantity.
Based on Table 2, what is the mathematical relationship between the spring compression distance (x) and the horizontal distance (D)? As x doubles, D:
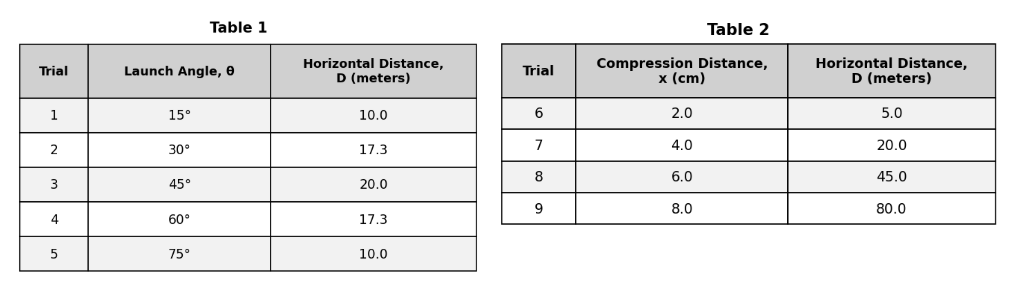
stays the same.
increases by exactly 15.0 meters.
doubles (increases by a factor of 2).
quadruples (increases by a factor of 4).
Explanation
The correct answer is C (quadruples). Check the data systematically: when x = 2.0 cm, D = 5.0 m. When x doubles to 4.0 cm, D = 20.0 m — that is 4 × 5.0 = 20.0, a factor of 4 increase. Confirm with the next doubling: when x doubles from 4.0 cm to 8.0 cm, D goes from 20.0 m to 80.0 m — that is 4 × 20.0 = 80.0, again a factor of 4. The relationship is quadratic: D is proportional to x². This makes physical sense — the energy stored in a compressed spring is proportional to x², and if energy converts directly to kinetic energy, the velocity and ultimately the distance scale with x². A (stays the same) would require constant D regardless of x. B (doubles) would give D = 10.0 at x = 4.0, but the table shows 20.0. D (increases by exactly 15.0) would give inconsistent additions. On relationship questions, always test the proposed relationship against at least two data pairs before confirming.
According to the passage and Table 1, which of the four listed stars is most likely the Sun?
Star D
Star B
Star C
Star A
Explanation
The correct answer is D (Star D). The passage's introduction defines the luminosity scale: 'Luminosity is a measure of a star's total energy output compared to the Sun (L☉).' By definition, the Sun itself has a luminosity of exactly 1 L☉ — this is the reference point of the scale. Table 1 shows that Star D has a luminosity of 1 L☉ and a surface temperature of 6,000 K. A surface temperature of approximately 5,500–6,000 K is consistent with the Sun's known surface temperature, and a luminosity of exactly 1 L☉ is the defining property of the Sun. Star A (luminosity 10⁴) is far too bright. Star B (luminosity 10⁵) is even brighter. Star C (luminosity 10⁻³) is far too dim. This question tests whether students recognize that the unit L☉ is defined relative to the Sun, making 1 L☉ the Sun's own luminosity by definition.
Both scientists would most likely agree with which of the following statements about the K-Pg boundary?
The global climate remained perfectly stable during the formation of the boundary layer.
The boundary layer was formed over a period of exactly ten years.
The boundary marks the exact moment a 10-kilometer asteroid struck the planet.
The rock layer at the boundary contains an unusually high concentration of iridium.
Explanation
The correct answer is B. The introduction — which establishes shared scientific facts before the viewpoints diverge — states: 'Geologists have discovered a distinct layer of sedimentary rock worldwide at the K-Pg boundary that contains unusually high levels of iridium.' Both scientists accept this fact; they disagree only about the source of that iridium (asteroid vs. deep mantle). A is wrong — neither scientist specifies a ten-year formation period; Scientist 2 describes processes lasting tens of thousands of years. C is directly contradicted by both scientists — Scientist 1 describes a global dust cloud causing cooling, and Scientist 2 describes SO₂ cooling followed by CO₂ warming. D represents Scientist 1's hypothesis specifically and would be rejected by Scientist 2. On agreement questions, look for claims that appear in the shared introduction or that both viewpoints independently accept.
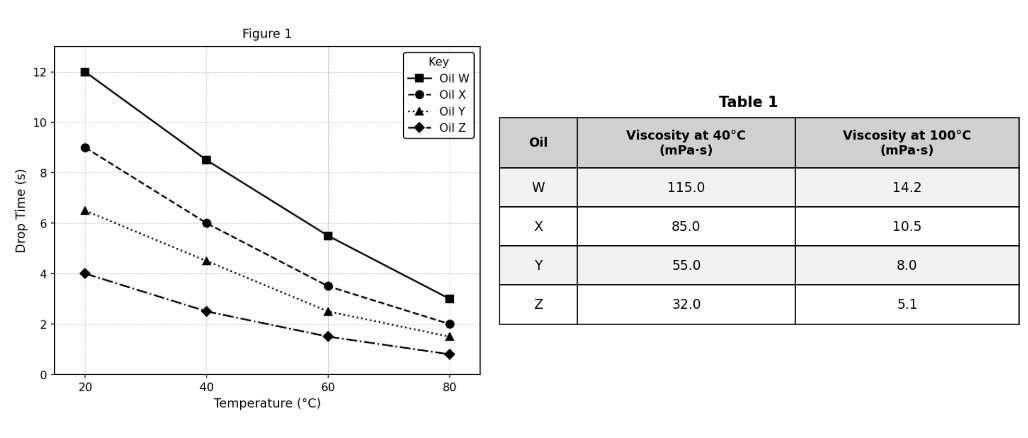
Based on the relationship between drop time and viscosity described in the passage, if the students tested a new oil, Oil V, that had a viscosity of 130.0 mPa·s at 40°C, the drop time of the steel ball in Oil V at 40°C would most likely be:
between 4.5 s and 6.0 s.
less than 2.5 s.
between 6.0 s and 8.5 s.
greater than 8.5 s.
Explanation
The correct answer is D (greater than 8.5 s). The passage establishes that higher viscosity means greater resistance to flow — the ball drops more slowly — producing a longer drop time. At 40°C, Oil W has the highest viscosity of the four oils tested at 115.0 mPa·s, and it produced the longest drop time of 8.5 s. Oil V has a viscosity of 130.0 mPa·s — higher than Oil W. Therefore, the ball must take longer to fall through Oil V than through Oil W, making the drop time greater than 8.5 s. F and G describe drop times associated with lower-viscosity oils at 40°C. H describes a range between Oil Y and Oil W values — too low. Pro tip: anchor extrapolation questions by identifying the highest or lowest tested value and reasoning beyond it.
A critique of Scientist 3's hypothesis is that it requires changing a fundamental law of physics. Scientist 3 would most likely respond by pointing out that:
the universe is much younger than Scientist 1 claims.
black holes and neutron stars are emitting more light than previously thought.
WIMPs have already been detected in underground experiments.
Newtonian physics has never been tested at the extremely low accelerations found in outer galaxies.
Explanation
This is a defense of argument question asking how a scientist would respond to criticism. Scientist 3's core claim is that Newtonian gravity works at solar system scales (high acceleration) but fails at galactic scales ("accelerations are incredibly low < 10⁻¹⁰ m/s²"). The natural defense against "you're changing physics" is "we've never actually tested physics at these extreme conditions." Choice A correctly predicts this defense—the untested regime justifies modification. Choice B (WIMPs detected) would support Scientist 1, not defend Scientist 3. Choice C (light emission) is irrelevant to gravity laws. Choice D (universe age) is irrelevant. Pro tip: Use a scientist's core argument to predict their defense against criticism.
Two scientists debate the primary cause of climate change. Scientist A argues carbon emissions are the main factor, while Scientist B suggests solar activity plays a larger role. Data shows a strong correlation between carbon levels and temperature rise. Which explanation most logically accounts for the results?
Both explanations are equally logical.
Scientist A's explanation is most logical.
Scientist B's explanation is most logical.
Neither explanation is logical.
Explanation
Scientist A's explanation is most logical because it correctly identifies carbon emissions as the primary climate change driver. The data shows a strong correlation between carbon levels and temperature rise, which directly supports Scientist A's argument that carbon emissions are the main factor. Scientist B's emphasis on solar activity cannot account for the observed correlation between atmospheric carbon concentrations and global temperature increases. The evidence clearly demonstrates that carbon emissions, not solar variations, explain the documented temperature trends.
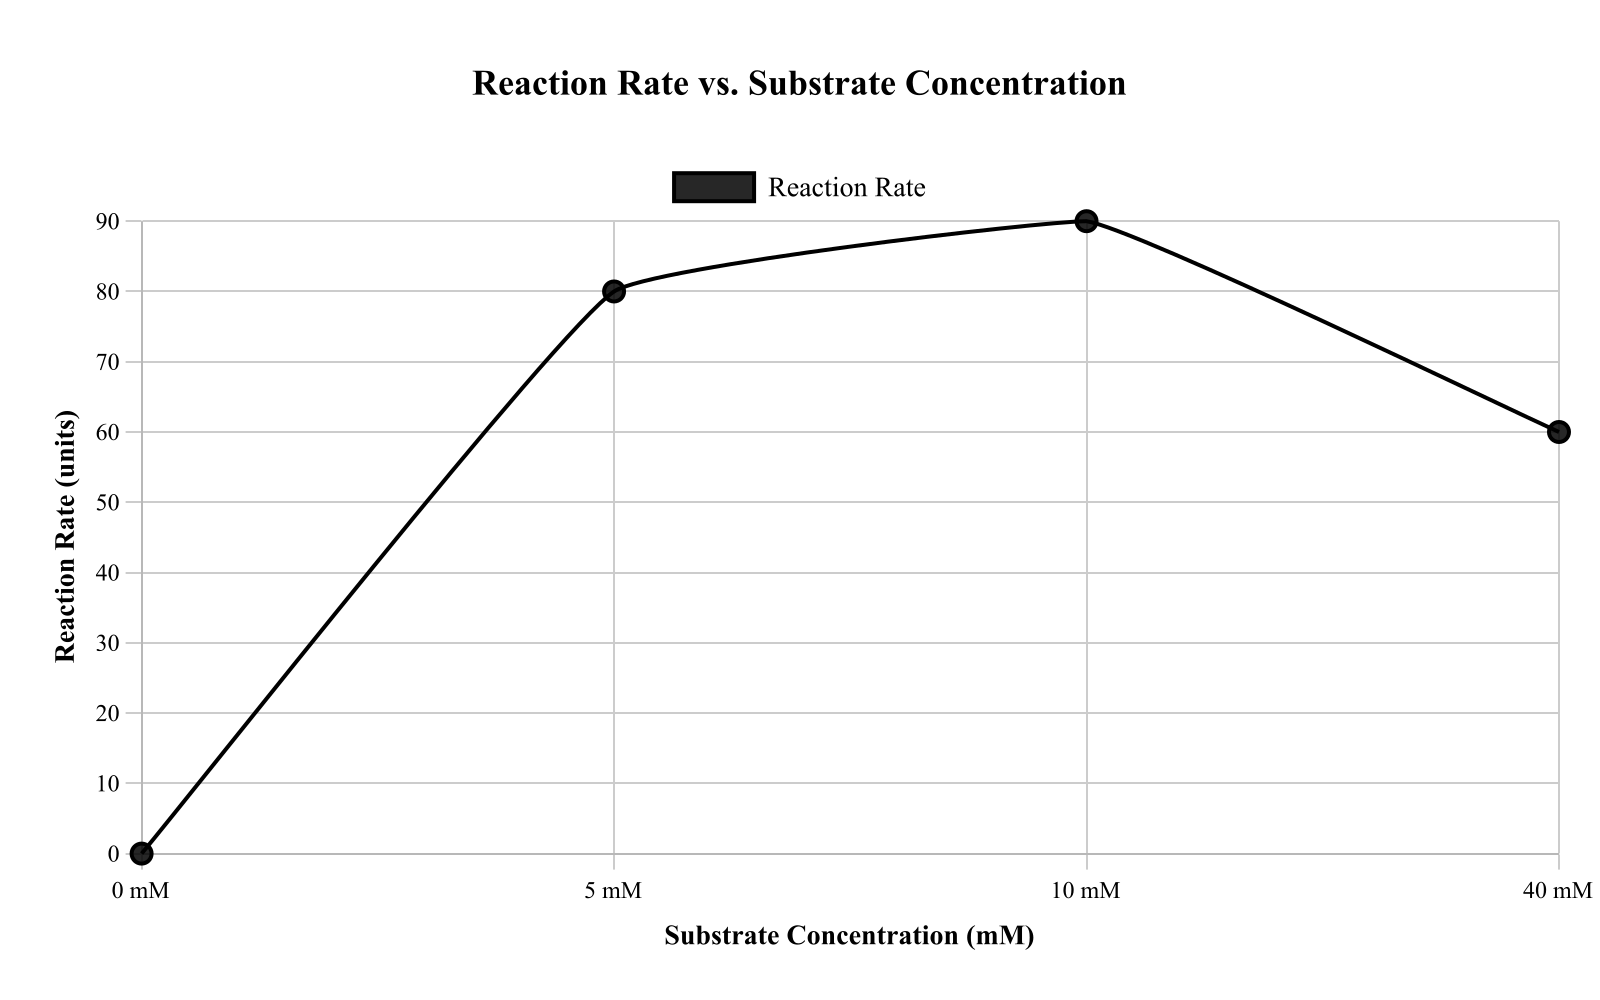
Students test why an enzyme’s reaction rate decreases at very high substrate concentrations. Two models are proposed.
Model 1 (Saturation Only): Rate approaches a maximum as substrate increases, then stays near that maximum. Prediction: At very high substrate, rate should plateau, not decrease.
Model 2 (Substrate Inhibition): Excess substrate binds to an inhibitory site, reducing activity. Prediction: Rate should increase at first, then decrease at very high substrate.
Figure 1 shows reaction rate versus substrate concentration.
Which model is best supported by the results in Figure 1?
Neither model, because the enzyme rate should be independent of substrate concentration.
Model 2, because the rate decreases at very high substrate after reaching a peak at intermediate substrate.
Model 1, because the rate increases with substrate concentration from 0 to 10 mM.
Both models, because both predict the same rate at all substrate concentrations.
Explanation
Model 2, the Substrate Inhibition Model, is best supported by the results in Figure 1. The figure depicts reaction rate increasing from 0 to 80 units between 0–5 mM substrate, peaking at 90 units at 10 mM, and then decreasing to 60 units at 40 mM. This pattern aligns with Model 2's prediction of an initial rise followed by a decline at high substrate due to inhibitory binding, showing a non-plateauing response. Model 1 is contradicted because the rate does not plateau but instead decreases after the maximum, inconsistent with saturation-only expectations.