Interpret Points on Proportional Graphs
Help Questions
7th Grade Math › Interpret Points on Proportional Graphs
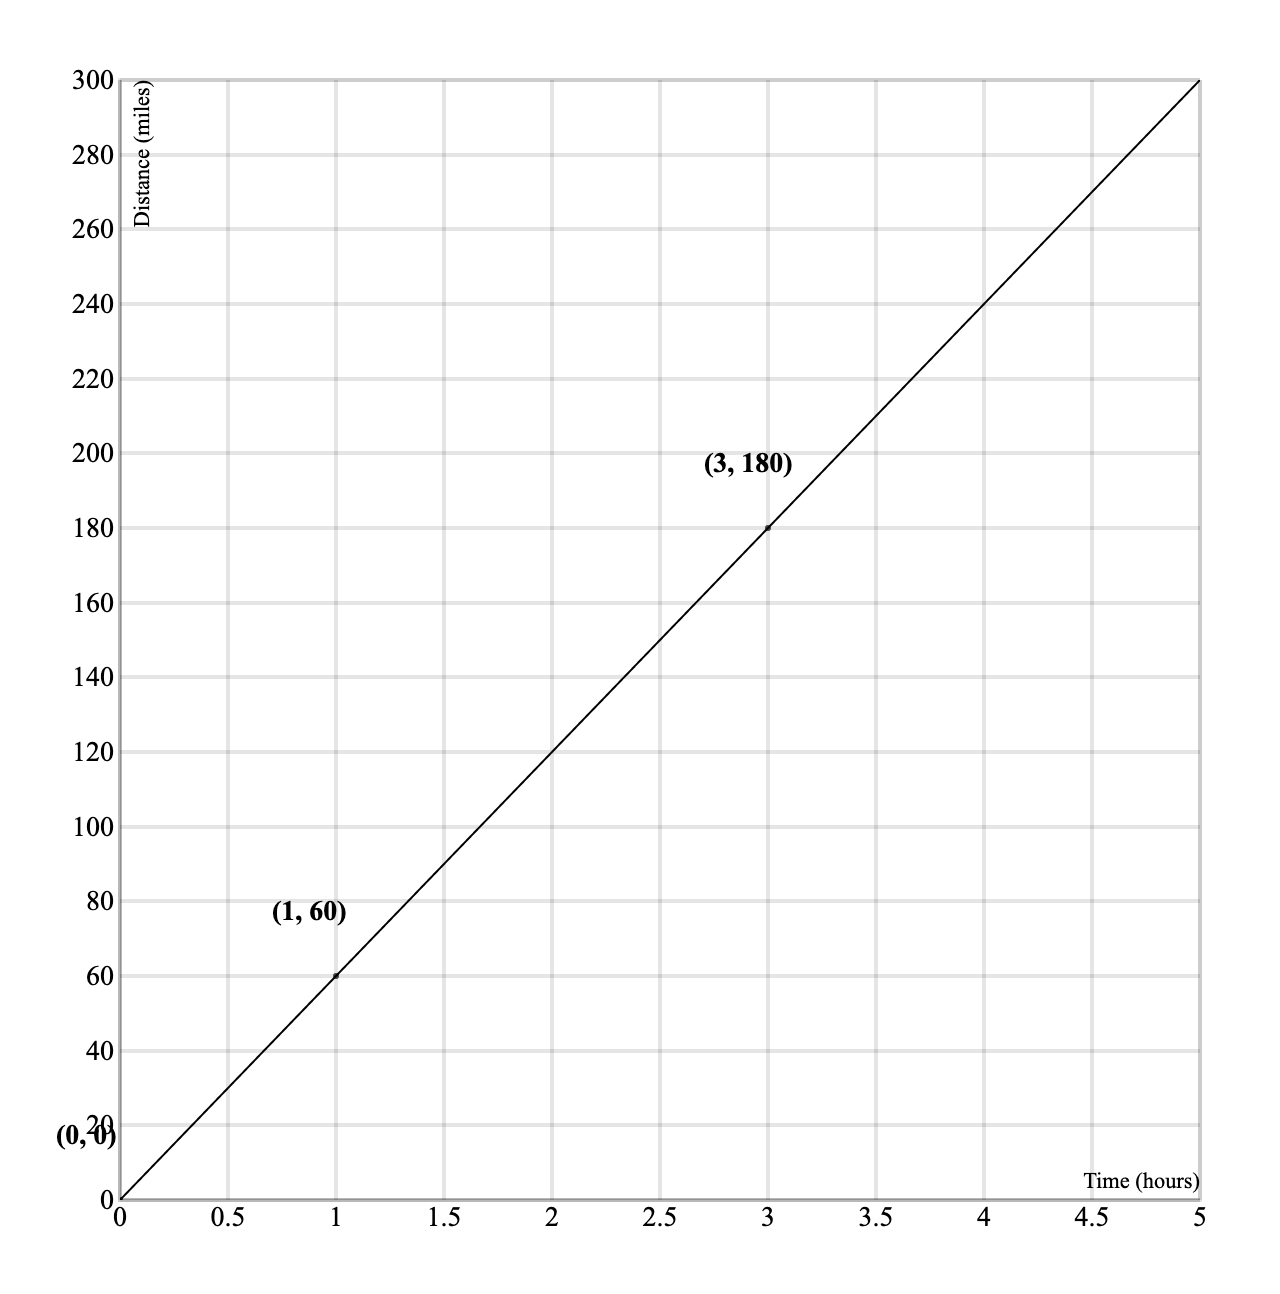
A proportional relationship is shown by the line $d=60t$ on a graph of distance (miles) vs. time (hours). Why must the graph include the point $(0,0)$?
Because all lines must pass through the origin.
Because in any proportional relationship, 0 of the input gives 0 of the output.
Because the unit rate is always found at $(0,0)$.
Because at 0 hours, the distance is $60$ miles.
Explanation
This question tests interpreting points on proportional graphs: (0,0) as zero-zero relationship, (1,r) as unit rate, any (x,y) as specific input-output pair in context. Points on proportional graph y=kx have context meaning: (0,0) always present meaning zero input gives zero output (0 items cost $0, 0 time traveled 0 distance—starting point), (1,k) shows unit rate directly (1 item costs $k, 1 hour travels k miles—'per one unit' rate), any (x,y) means 'x units of input give y units of output' (5 items cost $20, 3 hours travel 180 miles—specific relationship instance). For example, in cost graph c=4n, point (0,0) means 0 items cost $0 (nothing purchased, no cost), point (1,4) means 1 item costs $4 (unit rate $4/item), point (5,20) means 5 items cost $20 (5×$4=$20), all consistent with c=4n equation. The graph for d=60t must include (0,0) because in any proportional relationship, 0 of the input gives 0 of the output, representing no time means no distance. Common errors include thinking it's because distance is 60 at 0 hours or that unit rate is at (0,0), or generalizing that all lines pass through origin (not true for non-proportional). To interpret points correctly: (1) identify variables (x=t hours, y=d miles from graph labels), (2) read point coordinates ((0,0) on graph), (3) state meaning ('0 hours, 0 miles'), (4) verify with equation (d=60t: if t=0, d=0 matches). The origin (0,0) always means 'nothing in, nothing out' (universal for proportional), and mistakes often involve misinterpreting origin as non-zero start.
A student bikes at a constant speed of $60$ miles per hour, so $d=60t$. Which point matches the description “After 3 hours, the student has biked 180 miles”?
$(60,1)$
$(180,3)$
$(3,180)$
$(0,180)$
Explanation
This question tests interpreting points on proportional graphs: (0,0) as zero-zero relationship, (1,r) as unit rate, any (x,y) as specific input-output pair in context. Points on proportional graph y=kx have context meaning: (0,0) always present meaning zero input gives zero output (0 items cost $0, 0 time traveled 0 distance—starting point), (1,k) shows unit rate directly (1 item costs $k, 1 hour travels k miles—'per one unit' rate), any (x,y) means 'x units of input give y units of output' (5 items cost $20, 3 hours travel 180 miles—specific relationship instance). For example, in cost graph c=4n, point (0,0) means 0 items cost $0 (nothing purchased, no cost), point (1,4) means 1 item costs $4 (unit rate $4/item), point (5,20) means 5 items cost $20 (5×$4=$20), all consistent with c=4n equation. The point that matches 'after 3 hours, the student has biked 180 miles' is (3,180), as per d=60t where t=3 gives d=60×3=180. Common errors include reversing to (180,3) meaning '180 hours for 3 miles' or choosing (0,180) implying distance without time. To interpret points correctly: (1) identify variables (x=t hours, y=d miles from graph labels), (2) read point coordinates (match to description), (3) state meaning ('3 hours, 180 miles'), (4) verify with equation (d=60t: if t=3, d=180 matches). Any (x,y) means a specific instance, and mistakes often involve reversing coordinates meaning (x,y) as (y,x).
A recipe uses $2.5$ cups of flour per batch of cookies, so $f=2.5b$, where $b$ is the number of batches and $f$ is the cups of flour. What does the point $(4,10)$ mean?
The unit rate is 10 batches per cup of flour.
10 cups of flour make 4 batches.
4 cups of flour make 10 batches.
4 batches need 10 cups of flour.
Explanation
This question tests interpreting points on proportional graphs: (0,0) as zero-zero relationship, (1,r) as unit rate, any (x,y) as specific input-output pair in context. Points on proportional graph y=kx have context meaning: (0,0) always present meaning zero input gives zero output (0 items cost $0, 0 time traveled 0 distance—starting point), (1,k) shows unit rate directly (1 item costs $k, 1 hour travels k miles—'per one unit' rate), any (x,y) means 'x units of input give y units of output' (5 items cost $20, 3 hours travel 180 miles—specific relationship instance). For example, in cost graph c=4n, point (0,0) means 0 items cost $0 (nothing purchased, no cost), point (1,4) means 1 item costs $4 (unit rate $4/item), point (5,20) means 5 items cost $20 (5×$4=$20), all consistent with c=4n equation. In this recipe with f=2.5b, the point (4,10) means that 4 batches need 10 cups of flour, as 4×2.5=10 matches the equation. Common errors include reversing coordinates like '10 cups make 4 batches' or misstating the unit rate as '10 batches per cup' instead of recognizing the specific pair. To interpret points correctly: (1) identify variables (x=b batches, y=f cups of flour from graph labels), (2) read point coordinates ((4,10) on graph), (3) state meaning ('4 batches need 10 cups'), (4) verify with equation (f=2.5b: if b=4, f=2.5×4=10 matches point). Using any point for specific calculation like (4,10) confirms the relationship, and mistakes often involve units confusion or not contextualizing the input-output.
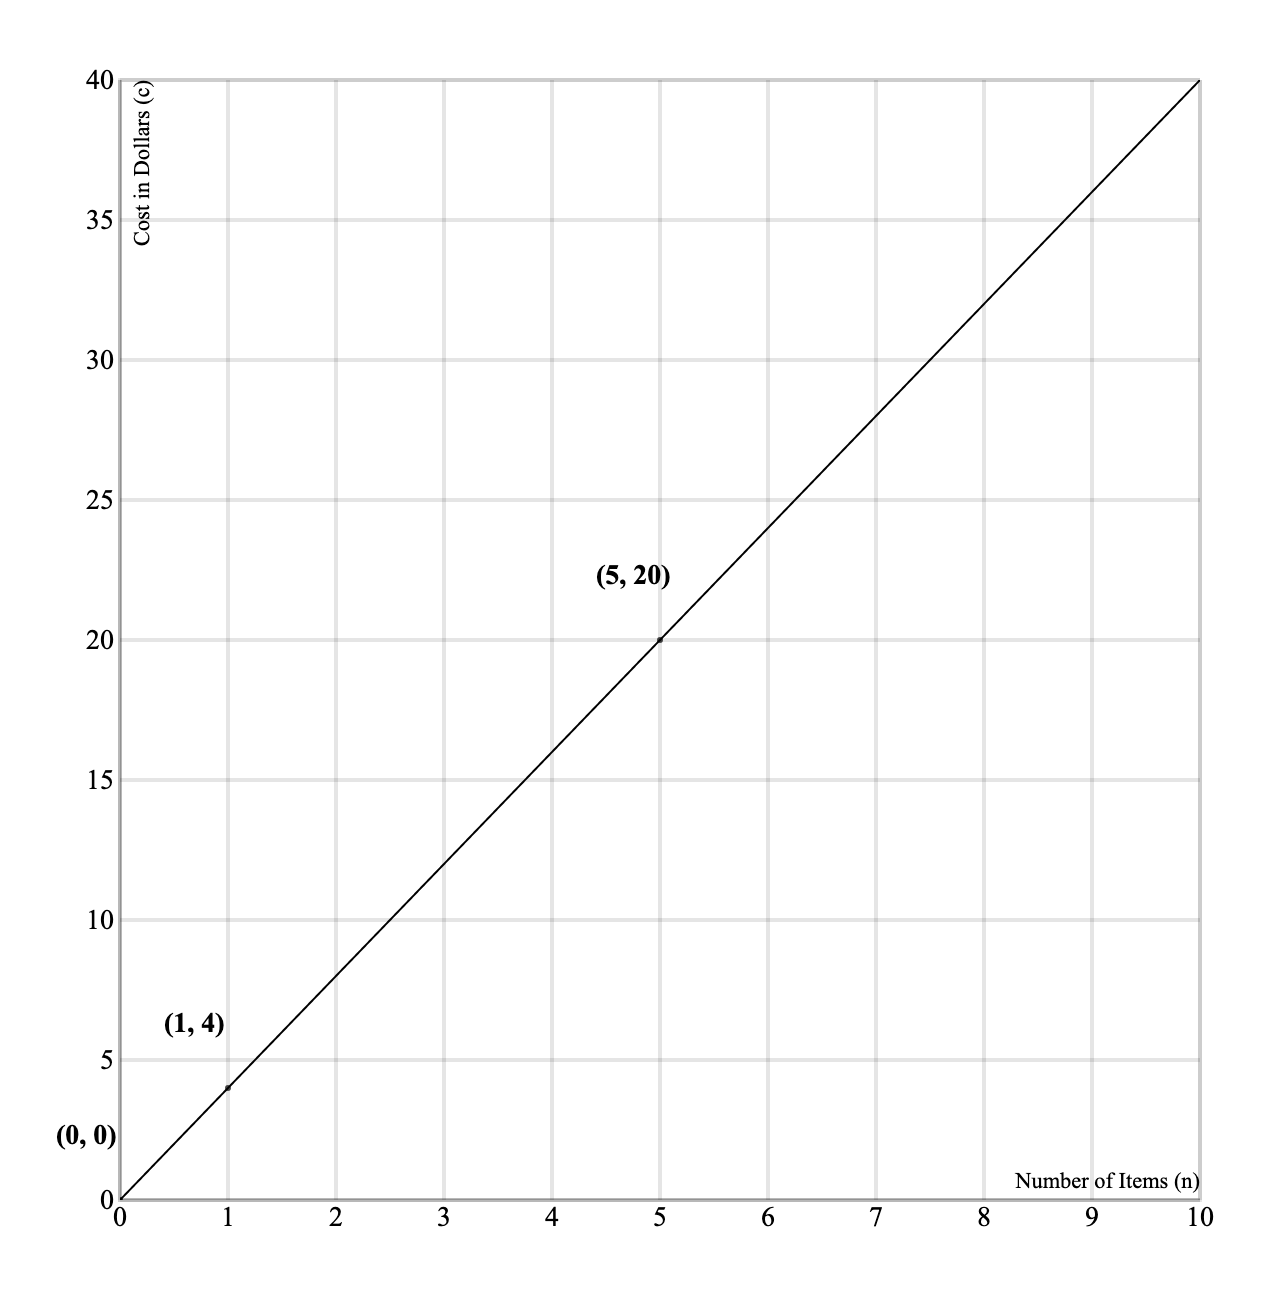
A proportional relationship is shown by $c=4n$, where $n$ is the number of items and $c$ is the cost in dollars. Which statement correctly describes the point $(0,0)$ on the graph?
0 items cost $\$0$.
4 items cost $\$0$.
The cost is always $\$0$ no matter how many items you buy.
0 items cost $\$4$.
Explanation
This question tests interpreting points on proportional graphs: (0,0) as zero-zero relationship, (1,r) as unit rate, any (x,y) as specific input-output pair in context. Points on proportional graph y=kx have context meaning: (0,0) always present meaning zero input gives zero output (0 items cost $0, 0 time traveled 0 distance—starting point), (1,k) shows unit rate directly (1 item costs $k, 1 hour travels k miles—'per one unit' rate), any (x,y) means 'x units of input give y units of output' (5 items cost $20, 3 hours travel 180 miles—specific relationship instance). For example, in cost graph c=4n, point (0,0) means 0 items cost $0 (nothing purchased, no cost), point (1,4) means 1 item costs $4 (unit rate $4/item), point (5,20) means 5 items cost $20 (5×$4=$20), all consistent with c=4n equation. Here, the point (0,0) on the graph for c=4n correctly describes that 0 items cost $0, representing no purchase and no cost. Common errors include thinking (0,0) means '0 items cost $4' or '4 items cost $0', which misinterprets the origin as a non-zero start. To interpret points correctly: (1) identify variables (x=n items, y=c cost in dollars from graph labels), (2) read point coordinates ((0,0) on graph), (3) state meaning ('0 items cost $0'), (4) verify with equation (c=4n: if n=0, c=4×0=0 matches point). The origin (0,0) always means 'nothing in, nothing out' (universal for proportional—0 hours means 0 miles, 0 batches need 0 cups), and mistakes often involve assuming the cost is always $0 regardless of items.
A proportional relationship is graphed for $f=2.5b$, where $b$ is batches and $f$ is cups of flour. What is the best interpretation of the point $(1,2.5)$?
1 cup of flour is used for 2.5 batches.
1 batch needs 2.5 cups of flour.
2.5 batches need 1 cup of flour.
The recipe starts with 2.5 cups even for 0 batches.
Explanation
This question tests interpreting points on proportional graphs: (0,0) as zero-zero relationship, (1,r) as unit rate, any (x,y) as specific input-output pair in context. Points on proportional graph y=kx have context meaning: (0,0) always present meaning zero input gives zero output (0 items cost $0, 0 time traveled 0 distance—starting point), (1,k) shows unit rate directly (1 item costs $k, 1 hour travels k miles—'per one unit' rate), any (x,y) means 'x units of input give y units of output' (5 items cost $20, 3 hours travel 180 miles—specific relationship instance). For example, in cost graph c=4n, point (0,0) means 0 items cost $0 (nothing purchased, no cost), point (1,4) means 1 item costs $4 (unit rate $4/item), point (5,20) means 5 items cost $20 (5×$4=$20), all consistent with c=4n equation. The best interpretation of (1,2.5) in f=2.5b is that 1 batch needs 2.5 cups of flour, showing the unit rate directly. Common errors include reversing to '1 cup for 2.5 batches' or thinking it means starting with 2.5 cups for 0 batches, which confuses with the origin. To interpret points correctly: (1) identify variables (x=b batches, y=f cups from graph labels), (2) read point coordinates ((1,2.5) on graph), (3) state meaning ('1 batch needs 2.5 cups'), (4) verify with equation (f=2.5b: if b=1, f=2.5 matches point). Point (1,r) gives unit rate directly (here, 2.5 cups per batch), and mistakes often involve not recognizing (1,r) as unit rate.
A car travels at 60 miles per hour, so $d=60t$. Which point matches the statement: “After 3 hours, the car has traveled 180 miles”?
$(3,180)$
$(3,60)$
$(60,3)$
$(180,3)$
Explanation
This question tests interpreting points on proportional graphs: (0,0) as the zero-zero relationship, (1,r) as the unit rate, and any (x,y) as a specific input-output pair in context. Points on a proportional graph y = kx have contextual meaning: (0,0) is always present meaning zero input gives zero output (like 0 hours traveled mean 0 miles, the starting point), (1,k) shows the unit rate directly (1 hour travels 60 miles, the 'per one unit' rate), and any (x,y) means 'x units of input give y units of output' (3 hours travel 180 miles—a specific relationship instance). For example, in the distance graph d=60t, point (0,0) means at 0 hours, 0 miles traveled (no time passed, no distance), point (1,60) means in 1 hour, 60 miles traveled (unit rate 60 mph), point (3,180) means in 3 hours, 180 miles traveled (3×60=180), all consistent with the d=60t equation. The point (3,180) matches the statement 'After 3 hours, the car has traveled 180 miles,' as it correctly pairs time with distance. Common errors include reversing coordinates like (180,3) meaning '180 hours for 3 miles' or (3,60) as '3 hours for 60 miles' which is the unit rate scaled wrong, or (60,3) confusing rate with time. To interpret points correctly: (1) identify variables (x = time t in hours, y = distance d in miles from the graph), (2) read the point coordinates to match the statement, (3) state the meaning ('after 3 hours, 180 miles'), (4) verify with the equation (d=60t: if t=3, d=60×3=180, which matches (3,180)). Special points include the origin (0,0) always meaning 'nothing in, nothing out' (universal for proportional relationships, like 0 hours mean 0 miles), and point (1,r) giving the unit rate directly (read r at x=1, that's the 'per unit' value—if (1,60), unit rate is 60 miles per hour).
A recipe uses 2.5 cups of flour per batch ($f=2.5b$). What does the point $(1,2.5)$ represent?
1 batch needs 2.5 cups of flour.
2.5 batches need 1 cup of flour.
1 cup of flour is needed for 2.5 batches.
The recipe starts with 1 batch already made.
Explanation
This question tests interpreting points on proportional graphs: (0,0) as the zero-zero relationship, (1,r) as the unit rate, and any (x,y) as a specific input-output pair in context. Points on a proportional graph y = kx have contextual meaning: (0,0) is always present meaning zero input gives zero output (like 0 batches need 0 cups of flour, the starting point), (1,k) shows the unit rate directly (1 batch needs 2.5 cups, the 'per one unit' rate), and any (x,y) means 'x units of input give y units of output' (4 batches need 10 cups—a specific relationship instance). For example, in the flour graph f=2.5b, point (0,0) means 0 batches need 0 cups (no baking, no flour), point (1,2.5) means 1 batch needs 2.5 cups (unit rate 2.5 cups per batch), point (4,10) means 4 batches need 10 cups (4×2.5=10), all consistent with the f=2.5b equation. The point (1,2.5) represents that 1 batch needs 2.5 cups of flour, which is the unit rate. Common errors include reversing coordinates like '1 cup for 2.5 batches' or '2.5 batches need 1 cup,' or adding unrelated ideas like 'the recipe starts with 1 batch already made' which ignores the proportionality. To interpret points correctly: (1) identify variables (x = batches b, y = flour f in cups from the graph), (2) read the point coordinates like (1,2.5), (3) state the meaning ('1 batch needs 2.5 cups'), (4) verify with the equation (f=2.5b: if b=1, f=2.5×1=2.5, which matches). Special points include the origin (0,0) always meaning 'nothing in, nothing out' (universal for proportional relationships, like 0 batches need 0 cups), and point (1,r) giving the unit rate directly (read r at x=1, that's the 'per unit' value—if (1,2.5), unit rate is 2.5 cups per batch).
A recipe uses 2.5 cups of flour per batch, modeled by $f=2.5b$. What does the point $(0,0)$ mean in this situation?
0 cups of flour makes 2.5 batches.
0 batches need 2.5 cups of flour.
The recipe always needs 2.5 cups of flour even for 0 batches.
0 batches need 0 cups of flour.
Explanation
This question tests interpreting points on proportional graphs: (0,0) as the zero-zero relationship, (1,r) as the unit rate, and any (x,y) as a specific input-output pair in context. Points on a proportional graph y = kx have contextual meaning: (0,0) is always present meaning zero input gives zero output (like 0 batches need 0 cups of flour, the starting point), (1,k) shows the unit rate directly (1 batch needs 2.5 cups, the 'per one unit' rate), and any (x,y) means 'x units of input give y units of output' (4 batches need 10 cups—a specific relationship instance). For example, in the flour graph f=2.5b, point (0,0) means 0 batches need 0 cups (no baking, no flour), point (1,2.5) means 1 batch needs 2.5 cups (unit rate 2.5 cups per batch), point (4,10) means 4 batches need 10 cups (4×2.5=10), all consistent with the f=2.5b equation. The point (0,0) means that 0 batches need 0 cups of flour, representing the starting point with no activity. Common errors include misinterpreting the origin as having a non-zero requirement like '0 batches need 2.5 cups' or 'the recipe always needs 2.5 cups even for 0 batches,' or reversing to '0 cups make 2.5 batches' which confuses the variables. To interpret points correctly: (1) identify variables (x = batches b, y = flour f in cups from the graph), (2) read the point coordinates like (0,0), (3) state the meaning ('0 batches need 0 cups'), (4) verify with the equation (f=2.5b: if b=0, f=2.5×0=0, which matches). Special points include the origin (0,0) always meaning 'nothing in, nothing out' (universal for proportional relationships, like 0 batches need 0 cups), and point (1,r) giving the unit rate directly (read r at x=1, that's the 'per unit' value—if (1,2.5), unit rate is 2.5 cups per batch).
A school store sells notebooks for $\$$4$ each, modeled by $c=4n$. How are the points $(1,4)$ and $(5,20)$ related?
$(5,20)$ shows 5 times as many notebooks as $(1,4)$ and also 5 times the cost.
$(1,4)$ shows the cost increases by 1 dollar for each notebook.
The points show the cost starts at $\$$4$ even when $n=0$.
$(5,20)$ means the cost per notebook is $\$$20$.
Explanation
This question tests interpreting points on proportional graphs: $(0,0)$ as the zero-zero relationship, $(1,r)$ as the unit rate, and any $(x,y)$ as a specific input-output pair in context. Points on a proportional graph $y = kx$ have contextual meaning: $(0,0)$ is always present meaning zero input gives zero output (like 0 notebooks cost $0, the starting point), $(1,k)$ shows the unit rate directly (1 notebook costs $4, the 'per one unit' rate), and any $(x,y)$ means 'x units of input give y units of output' (5 notebooks cost $20—a specific relationship instance). For example, in the cost graph $c=4n$, point $(0,0)$ means 0 notebooks cost $0 (nothing purchased, no cost), point $(1,4)$ means 1 notebook costs $4 (unit rate $4 per notebook), point $(5,20)$ means 5 notebooks cost $20 (5×$4=$20), all consistent with the $c=4n$ equation. The points $(1,4)$ and $(5,20)$ are related such that $(5,20)$ shows 5 times as many notebooks as $(1,4)$ and also 5 times the cost, demonstrating the proportional scaling. Common errors include misinterpreting $(5,20)$ as 'the cost per notebook is $20' without relating to scaling, or stating $(1,4)$ as 'cost increases by 1 dollar per notebook' which is incorrect, or confusing origin like 'cost starts at $4 when n=0' when it's actually $0. To interpret points correctly: (1) identify variables (x = notebooks n, y = cost c in dollars from the graph), (2) read the point coordinates like $(1,4)$ and $(5,20)$, (3) state the meaning and relation ('5 notebooks cost $20, which is 5 times the unit'), (4) verify with the equation ($c=4n$: for $n=5$, $c=20$ matches; 5×$(1,4)$ scales to $(5,20)$). Special points include the origin $(0,0)$ always meaning 'nothing in, nothing out' (universal for proportional relationships, like 0 notebooks mean $0 cost), and point $(1,r)$ giving the unit rate directly (read r at x=1, that's the 'per unit' value—if $(1,4)$, unit rate is $4 per notebook); using points like $(1,k)$ for unit rate is efficient, and checking scaling between points confirms proportionality.