Graphing - SAT Math
Card 0 of 264
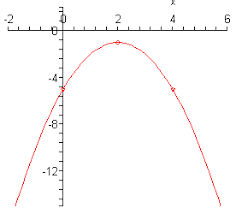
Which of the following could be a value of  for
for  ?
?
Which of the following could be a value of
The graph is a down-opening parabola with a maximum of  . Therefore, there are no y values greater than this for this function.
The graph is a down-opening parabola with a maximum of
Compare your answer with the correct one above
The figure above shows the graph of y = f(x). Which of the following is the graph of y = |f(x)|?
The figure above shows the graph of y = f(x). Which of the following is the graph of y = |f(x)|?
One of the properties of taking an absolute value of a function is that the values are all made positive. The values themselves do not change; only their signs do. In this graph, none of the y-values are negative, so none of them would change. Thus the two graphs should be identical.
One of the properties of taking an absolute value of a function is that the values are all made positive. The values themselves do not change; only their signs do. In this graph, none of the y-values are negative, so none of them would change. Thus the two graphs should be identical.
Compare your answer with the correct one above
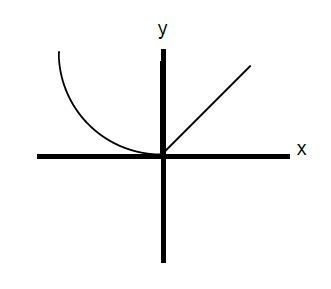
Below is the graph of the function ") :
:
Which of the following could be the equation for ") ?
?
Below is the graph of the function
Which of the following could be the equation for
First, because the graph consists of pieces that are straight lines, the function must include an absolute value, whose functions usually have a distinctive "V" shape. Thus, we can eliminate f(x) = x2 – 4x + 3 from our choices. Furthermore, functions with x2 terms are curved parabolas, and do not have straight line segments. This means that f(x) = |x2 – 4x| – 3 is not the correct choice.
Next, let's examine f(x) = |2x – 6|. Because this function consists of an abolute value by itself, its graph will not have any negative values. An absolute value by itself will only yield non-negative numbers. Therefore, because the graph dips below the x-axis (which means f(x) has negative values), f(x) = |2x – 6| cannot be the correct answer.
Next, we can analyze f(x) = |x – 1| – 2. Let's allow x to equal 1 and see what value we would obtain from f(1).
f(1) = | 1 – 1 | – 2 = 0 – 2 = –2
However, the graph above shows that f(1) = –4. As a result, f(x) = |x – 1| – 2 cannot be the correct equation for the function.
By process of elimination, the answer must be f(x) = |2x – 2| – 4. We can verify this by plugging in several values of x into this equation. For example f(1) = |2 – 2| – 4 = –4, which corresponds to the point (1, –4) on the graph above. Likewise, if we plug 3 or –1 into the equation f(x) = |2x – 2| – 4, we obtain zero, meaning that the graph should cross the x-axis at 3 and –1. According to the graph above, this is exactly what happens.
The answer is f(x) = |2x – 2| – 4.
Compare your answer with the correct one above
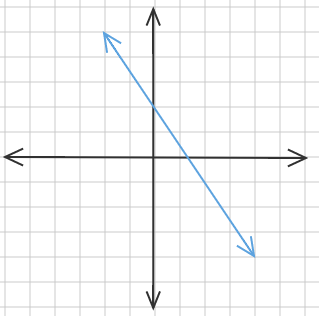
What is the equation for the line pictured above?
What is the equation for the line pictured above?
A line has the equation
 where
where  is the
  intercept and
  is the slope.
The  intercept can be found by noting the point where the line and the y-axis cross, in this case, at
 ") so
so  .
.
The slope can be found by selecting two points, for example, the y-intercept and the next point over that crosses an even point, for example, ") .
.
Now applying the slope formula,

which yields  .
.
Therefore the equation of the line becomes:

A line has the equation
The
The slope can be found by selecting two points, for example, the y-intercept and the next point over that crosses an even point, for example,
Now applying the slope formula,
which yields
Therefore the equation of the line becomes:
Compare your answer with the correct one above
=2x+4")
Which of the following graphs represents the y-intercept of this function?
Which of the following graphs represents the y-intercept of this function?
Graphically, the y-intercept is the point at which the graph touches the y-axis. Algebraically, it is the value of  when
when  .
.
Here, we are given the function =2x+4") . In order to calculate the y-intercept, set
. In order to calculate the y-intercept, set  equal to zero and solve for
  .
.
+4")

So the y-intercept is at ") .
.
Graphically, the y-intercept is the point at which the graph touches the y-axis. Algebraically, it is the value of
Here, we are given the function
So the y-intercept is at
Compare your answer with the correct one above
=2x+4")
Which of the following graphs represents the x-intercept of this function?
Which of the following graphs represents the x-intercept of this function?
Graphically, the x-intercept is the point at which the graph touches the x-axis. Algebraically, it is the value of  for which
  .
.
Here, we are given the function =2x+4") . In order to calculate the x-intercept, set
. In order to calculate the x-intercept, set  equal to zero and solve for
  .
.


So the x-intercept is at ") .
.
Graphically, the x-intercept is the point at which the graph touches the x-axis. Algebraically, it is the value of
Here, we are given the function
So the x-intercept is at
Compare your answer with the correct one above
Which of the following represents =\frac{1}{2}x-2") ?
?
Which of the following represents
A line is defined by any two points on the line. It is frequently simplest to calculate two points by substituting zero for x and solving for y, and by substituting zero for y and solving for x.
=\frac{1}{2}x-2")
Let  . Then
-2")

So our first set of points (which is also the y-intercept) is ")
Let  . Then


So our second set of points (which is also the x-intercept) is )") .
.
A line is defined by any two points on the line. It is frequently simplest to calculate two points by substituting zero for x and solving for y, and by substituting zero for y and solving for x.
Let
So our first set of points (which is also the y-intercept) is
Let
So our second set of points (which is also the x-intercept) is
Compare your answer with the correct one above
The graphic shows Bob's walk. At what times is Bob the furthest from home?

The graphic shows Bob's walk. At what times is Bob the furthest from home?
If we look at the graph, the line segment from ") to
to ") , is the furthest from home. So the answer will be from
, is the furthest from home. So the answer will be from  to
to  .
.
If we look at the graph, the line segment from
Compare your answer with the correct one above
Which of the following coordinate pairs is farthest from the origin?
Which of the following coordinate pairs is farthest from the origin?
Using the distance formula, calculate the distance from each of these points to the origin, (0, 0). While each answer choice has coordinates that add up to seven, (-1, 8) is the coordinate pair that produces the largest distance, namely  , or approximately 8.06.
Using the distance formula, calculate the distance from each of these points to the origin, (0, 0). While each answer choice has coordinates that add up to seven, (-1, 8) is the coordinate pair that produces the largest distance, namely
Compare your answer with the correct one above
On the coordinate plane, the point with coordinates ") is located in .
is located in .
On the coordinate plane, the point with coordinates
On the coordinate plane, a point with a negative  -coordinate and a positive
  -coordinate lies in the upper left quadrant—Quadrant II.
On the coordinate plane, a point with a negative
Compare your answer with the correct one above
On the coordinate plane,  ,
,  , and
, and  are the points with coordinates
 ") ,
, ") , and
, and ") , respectively. Lines
, respectively. Lines  ,
,  , and
, and  are the perpendicular bisectors of
  ,
,  , and
, and  , respectively.
 and
and  intersect at a point
  ;
;  and
and  intersect at a point
  ;
;  and
and  intersect at a point
  .
.
Which of these statements is true of  ,
,  , and
, and  ?
?
On the coordinate plane,
Which of these statements is true of
Another way of viewing this problem is to note that the three given vertices form a triangle  whose sides' perpendicular bisectors intersect at the points
  ,
,  , and
, and  . However, the three perpendicular bisectors of the sides of any triangle always intersect at a common point. The correct response is that , , and are the same point.
Another way of viewing this problem is to note that the three given vertices form a triangle
Compare your answer with the correct one above
On the coordinate plane, a triangle has its vertices at the points with coordinates
") ,
, ") , and
, and ") . Give the coordinates of the center of the circle that circumscribes this triangle.
. Give the coordinates of the center of the circle that circumscribes this triangle.
On the coordinate plane, a triangle has its vertices at the points with coordinates
The referenced figure is below.

The two non-horizontal line segments are perpendicular, as is proved as follows:
The slope of the line that connects ") and
and ") can be found using the slope formula, setting
can be found using the slope formula, setting  :
:

The slope of the line that connects ") and
and ") can be found similarly, setting
can be found similarly, setting  :
:

The product of their slopes is  , which indicates perpendicularity between the sides.
This makes the triangle right, and the side with endpoints ") and
and ") the hypotenuse. The center of the circle that circumscribes a right triangle is the midpoint of its hypotenuse, which is easily be seen to be the origin,
the hypotenuse. The center of the circle that circumscribes a right triangle is the midpoint of its hypotenuse, which is easily be seen to be the origin, ") .
.
The referenced figure is below.
The two non-horizontal line segments are perpendicular, as is proved as follows:
The slope of the line that connects
The slope of the line that connects
The product of their slopes is
This makes the triangle right, and the side with endpoints
Compare your answer with the correct one above
On the coordinate plane, a triangle has its vertices at the points with coordinates ") ,
, ") , and
, and ") . Give the coordinates of the center of the circle that circumscribes this triangle.
. Give the coordinates of the center of the circle that circumscribes this triangle.
On the coordinate plane, a triangle has its vertices at the points with coordinates
The referenced figure is below.

The triangle formed is a right triangle whose hypotenuse is the segment with the endpoints ") and
and ") . The center of the circle that circumscribes a right triangle is the midpoint of its hypotenuse, so the midpoint formula
. The center of the circle that circumscribes a right triangle is the midpoint of its hypotenuse, so the midpoint formula
 = \left ( \frac{x_{1}+ x_{2} }{2},\frac{y_{1}+ y_{2} }{2} \right )")
can be applied, setting  :
:


The midpoint of the hypotenuse, and, consequently, the center of the circumscribed circle, is the point with coordinates ") .
.
The referenced figure is below.
The triangle formed is a right triangle whose hypotenuse is the segment with the endpoints
can be applied, setting
The midpoint of the hypotenuse, and, consequently, the center of the circumscribed circle, is the point with coordinates
Compare your answer with the correct one above

Figure NOT drawn to scale.
On the coordinate axes shown above, the shaded triangle has area 40.
Evaluate  .
.
Figure NOT drawn to scale.
On the coordinate axes shown above, the shaded triangle has area 40.
Evaluate
The length of the horizontal leg of the triangle is the distance from the origin ") to
to ") , which is 8.
, which is 8.
The area of a right triangle is half the product of the lengths of its legs  and
and  , so, setting
  and
and  and solving for
  :
:


Therefore, the length of the vertical leg is 10, and, since the  -intercept of the line containing the hypotenuse is on the positive
  -axis, this intercept is
 ") . The slope of a line with intercepts
. The slope of a line with intercepts ,(0, b)") is
is
 ,
,
so, setting and :

Set  and in the slope-intercept form of the equation of a line,
 ;
;
the line has equation

The  -coordinate
  of the point on the line with
  -coordinate 2 can be found using substitution; setting
  ::
::
+10 = -\frac{5}{2} + 10 = -2\frac{1}{2} + 10 = 7 \frac{1}{2}")
The length of the horizontal leg of the triangle is the distance from the origin
The area of a right triangle is half the product of the lengths of its legs
Therefore, the length of the vertical leg is 10, and, since the
so, setting
Set
the line has equation
The
Compare your answer with the correct one above
Mrs. Smith's 8th grade class has a weekly quiz. The graph below depicts the number of questions students got incorrect on their quiz and their corresponding quiz grade. Examining the graph, what type of correlation if any, exists?

Mrs. Smith's 8th grade class has a weekly quiz. The graph below depicts the number of questions students got incorrect on their quiz and their corresponding quiz grade. Examining the graph, what type of correlation if any, exists?
Mrs. Smith's 8th grade class had a quiz last week. The graph below depicts the number of questions students got incorrect on their quiz and their corresponding quiz grade. In other words, the graph in this particular question is a dot plot and the question asks to find a correlation if one exists.
Recall that a correlation is a trend seen in the data. Graphically, trends can be either:
I. Positive
II. Negative
III. Constant
IV. No trend
For a trend to be positive the x and y variable both increase. A trend is negative when the y variable (dependent variable) decreases as the x variable (independent variable) increases. A constant trend occurs when the y variable stays the same as the x variable increases. No trend exists when the data appears to be scattered with no association between the x and y variables.
Examining the graph given it is seen that the x variable is the number of questions missed and the y variable is the overall score on the quiz. It is seen that as the number of questions missed increases, the overall score on the quiz decreases. This describes a negative trend.
In other words, the graph depicts a negative correlation.
Compare your answer with the correct one above
Given the graph of record sales, what fraction of records were sold in 2004 to 2010?

Given the graph of record sales, what fraction of records were sold in 2004 to 2010?
Given the graph of record sales, to find the fraction of records that were sold in 2004 to 2010 first identify the record sales in 2004 and the record sales in 2010.
Examining the graph,
Record sales in 2004:14 million
Record sales in 2010: 13 million
From here, to find the fraction of records sold during this time period, use the following formula.
Compare your answer with the correct one above
A farmer is designing rectangular pen for his cows. One side of the pen will be blocked by a steep hill, and the other three sides of the pen will be fenced off with wire. If the farmer has 20 meters of wire, what is the maximum area of the pen that he can build in square meters?
A farmer is designing rectangular pen for his cows. One side of the pen will be blocked by a steep hill, and the other three sides of the pen will be fenced off with wire. If the farmer has 20 meters of wire, what is the maximum area of the pen that he can build in square meters?
Let l = length and w = width of the pen. Let us assume that the side blocked by the mountain is along the length of the pen.
The length of wire used to make the pen must equal l + 2w, because this is the perimeter of a rectangle, excluding one of the lengths. The area of the pen will equal l x w.
l + 2w = 20
l = 20-2w
A = l x w = (20-2w)(w) = 20w - 4w2
Let A be a function of w, such that A(w) = 20w - 4w2. We want to find the maximum value of A. We recognize that the graph of A must be in the shape of a parabola, pointing downward. The maximum value of the parabola will thus occur at the vertex.
We want to rewrite A(w) in the standard form of a parabola, given by f(x) = a(x-h)2+k. In order to do this, we must complete the square.
20w-4w2 = -4w2+20w = -4(w2-5w) = -4(w2-5w + 25/4) + 25 = -4(w-5/2)2+25
Thus, the vertex of the parabola occurs at (5/2, 25), which means that w = 5/2.
Going back to our original equation, l + 2(5/2) = 20, and l = 15.
A = l x w = 15(5/2) = 75/2
Compare your answer with the correct one above
Which of the following is true about the quadratic function f(x)=(x+4)2 - 3?
Which of the following is true about the quadratic function f(x)=(x+4)2 - 3?
The function is given in vertex form, which is (x-h)2+k where the vertex of the parabola is the point (h,k). In this particular function, h=-4 and k=3, so the vertex is (-4,-3). No parabola is one-to-one, as they don't pass the horizontal line test. While parabolas can be even functions, this will only happen when the vertex is on the y-axis (or when h=0) because even functions must be symmetric with respect to the y-axis. No function can have two y-intercepts, as it would then not pass the vertical line test and not be a function. This parabola does have two x-intercepts, however. This can be shown by setting y=0 and solving for x, or by simply realizing that the vertex is below the x-axis and the parabola opens up.
The function is given in vertex form, which is (x-h)2+k where the vertex of the parabola is the point (h,k). In this particular function, h=-4 and k=3, so the vertex is (-4,-3). No parabola is one-to-one, as they don't pass the horizontal line test. While parabolas can be even functions, this will only happen when the vertex is on the y-axis (or when h=0) because even functions must be symmetric with respect to the y-axis. No function can have two y-intercepts, as it would then not pass the vertical line test and not be a function. This parabola does have two x-intercepts, however. This can be shown by setting y=0 and solving for x, or by simply realizing that the vertex is below the x-axis and the parabola opens up.
Compare your answer with the correct one above
Let f(x) = x2. By how many units must f(x) be shifted downward so that the distance between its x-intercepts becomes 8?
Let f(x) = x2. By how many units must f(x) be shifted downward so that the distance between its x-intercepts becomes 8?
Because the graph of f(x) = x2 is symmetric about the y-axis, when we shift it downward, the points where it intersects the x-axis will be the same distance from the origin. In other words, we could say that one intercept will be (-a,0) and the other would be (a,0). The distance between these two points has to be 8, so that means that 2a = 8, and a = 4. This means that when f(x) is shifted downward, its new roots will be at (-4,0) and (4,0).
Let g(x) be the graph after f(x) has been shifted downward. We know that g(x) must have the roots (-4,0) and (4,0). We could thus write the equation of g(x) as (x-(-4))(x-4) = (x+4)(x-4) = x2 - 16.
We can now compare f(x) and g(x), and we see that g(x) could be obtained if f(x) were shifted down by 16 units; therefore, the answer is 16.
Compare your answer with the correct one above
Let f(x) = ax2 + bx + c, where a, b, and c are all nonzero constants. If f(x) has a vertex located below the x-axis and a focus below the vertex, which of the following must be true?
I. a < 0
II. b < 0
III. c < 0
Let f(x) = ax2 + bx + c, where a, b, and c are all nonzero constants. If f(x) has a vertex located below the x-axis and a focus below the vertex, which of the following must be true?
I. a < 0
II. b < 0
III. c < 0
f(x) must be a parabola, since it contains an x2 term. We are told that the vertex is below the x-axis, and that the focus is below the vertex. Because a parabola always opens toward the focus, f(x) must point downward. The general graph of the parabola must have a shape similar to this:
Since the parabola points downward, the value of a must be less than zero. Also, since the parabola points downward, it must intersect the y-axis at a point below the origin; therefore, we know that the value of the y-coordinate of the y-intercept is less than zero. To find the y-coordinate of the y-intercept of f(x), we must find the value of f(x) where x = 0. (Any graph intersects the y-axis when x = 0.) When x = 0, f(0) = a(0) + b(0) + c = c. In other words, c represents the value of the y-intercept of f(x), which we have already established must be less than zero. To summarize, a and c must both be less than zero.
The last number we must analyze is b. One way to determine whether b must be negative is to assume that b is NOT negative, and see if f(x) still has a vertex below the x-axis and a focus below the vertex. In other words, let's pretend that b = 1 (we are told b is not zero), and see what happens. Because we know that a and c are negative, let's assume that a and c are both –1.
If b = 1, and if a and c = –1, then f(x) = –x2 + x – 1.
Let's graph f(x) by trying different values of x.
If x = 0, f(x) = –1.
If x = 1, f(x) = –1.
Because parabolas are symmetric, the vertex must have an x-value located halfway between 0 and 1. Thus, the x-value of the vertex is 1/2. To find the y-value of the vertex, we evaluate f(1/2).
f(1/2) = –(1/2)2 + (1/2) – 1 = –1/4 + (1/2) – 1 = –3/4.
Thus, the vertex of f(x) would be located at (1/2, –3/4), which is below the x-axis. Also, because f(0) and f(1) are below the vertex, we know that the parabola opens downward, and the focus must be below the vertex.
To summarize, we have just provided an example in which b is greater than zero, where f(x) has a vertex below the x-axis and a focus below the vertex. In other words, it is possible for b > 0, so it is not true that b must be less than 0.
Let's go back to the original question. We know that a and c are both less than zero, so we know choices I and III must be true; however, we have just shown that b doesn't necessarily have to be less than zero. In other words, only I and III (but not II) must be true.
The answer is I and III only.
Compare your answer with the correct one above