Graphing Functions - Pre-Calculus
Card 1 of 444
Solve the following polynomial for  by factoring:
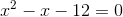
Solve the following polynomial for
Tap to reveal answer
The polynomial in the problem is given as follows:

Factoring this polynomial, we would get an expression of the form:
(x-b)=0")
So we need to determine what a and b are. We know we need two factors that when multiplied equal -12, and when added equal -1. If we consider 2 and 6, we could get -12 but could not arrange them in any way that would make their sum equal to -1. We then look at 3 and 4, whose product can be -12 is one of them is negative, and whose sum can be -1 if -4 is added to 3. This tells us that the 4 must be the negative factor and the 3 must be the positive factor, so we get the following:

The polynomial in the problem is given as follows:
Factoring this polynomial, we would get an expression of the form:
So we need to determine what a and b are. We know we need two factors that when multiplied equal -12, and when added equal -1. If we consider 2 and 6, we could get -12 but could not arrange them in any way that would make their sum equal to -1. We then look at 3 and 4, whose product can be -12 is one of them is negative, and whose sum can be -1 if -4 is added to 3. This tells us that the 4 must be the negative factor and the 3 must be the positive factor, so we get the following:
← Didn't Know|Knew It →
Solve the following polynomial for  by factoring:
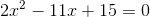
Solve the following polynomial for
Tap to reveal answer
Factoring our polynomial, we can see we will have 2x and x at the beginning of each factor, while we need to find two numbers whose product is 15 and whose sum when multiplied by our leading terms and added is -11x. This gives us the following factorization:
(x-3)=0")
So now we can set each term equal to 0 and solve for our two values of x:


Factoring our polynomial, we can see we will have 2x and x at the beginning of each factor, while we need to find two numbers whose product is 15 and whose sum when multiplied by our leading terms and added is -11x. This gives us the following factorization:
So now we can set each term equal to 0 and solve for our two values of x:
← Didn't Know|Knew It →
Solve the following equation:

Solve the following equation:
Tap to reveal answer
To solve, factor and then solve for x.
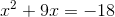
In order to factor we need all our variables and constants on one side. Add 18 to both sides to make our function in a form for which we can factor.
Now we want to find factors of 18 that when added together give us 9. Thus we get the following factored form.
(x+3)=0")
Now set each factor equal to zero and solve for x.

To solve, factor and then solve for x.
In order to factor we need all our variables and constants on one side. Add 18 to both sides to make our function in a form for which we can factor.
Now we want to find factors of 18 that when added together give us 9. Thus we get the following factored form.
Now set each factor equal to zero and solve for x.
← Didn't Know|Knew It →
Find the root(s) for the function: 
Find the root(s) for the function:
Tap to reveal answer
The function  is in the form
  , and can be factorized.

Determine the values of  and
and  .
.


Substitute this into the formula.
(x-11)")
Set  to find all roots.
(x-11)")


The function
Determine the values of
Substitute this into the formula.
Set
← Didn't Know|Knew It →
Find the zeros of the function 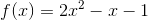 .
.
Find the zeros of the function
Tap to reveal answer
To find the zeros of the function, you need to factor the equation. Using trial and error, you should arrive at: (x-1)") . Then set those expressions equal to
. Then set those expressions equal to  so that your roots are
  .
.
To find the zeros of the function, you need to factor the equation. Using trial and error, you should arrive at:
← Didn't Know|Knew It →
Solve this polynomial by factoring if it is factorable:

Solve this polynomial by factoring if it is factorable:
Tap to reveal answer
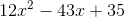
To factor this polynomial it is prudent to recognize that there will only be two factors since the highest power is  .
.
Then ask what numbers multiply to equal postive 35.
Next, what numbers can multiply to equal positive 12.
Let's try 7 and 5 for the last term and 3 and 4 for the first term.
Be sure to put an "x" in the first term of each factor.
Choose the signs based on what the polynomial calls for. In our case we choose negative signs to get positive 35.
(4x-5)}")
Foil these two factors and we get  .
.
To factor this polynomial it is prudent to recognize that there will only be two factors since the highest power is
Then ask what numbers multiply to equal postive 35.
Next, what numbers can multiply to equal positive 12.
Let's try 7 and 5 for the last term and 3 and 4 for the first term.
Be sure to put an "x" in the first term of each factor.
Choose the signs based on what the polynomial calls for. In our case we choose negative signs to get positive 35.
Foil these two factors and we get
← Didn't Know|Knew It →
Find the minimum distance between the point ") and the following line:
and the following line:
=-$\frac{1}{3}$x+2")
Find the minimum distance between the point
Tap to reveal answer
The minimum distance from the point to the line would be found by drawing a segment perpendicular to the line directly to the point. Our first step is to find the equation of the new line that connects the point to the line given in the problem. Because we know this new line is perpendicular to the line we're finding the distance to, we know its slope will be the negative inverse of the line its perpendicular to. So if the line we're finding the distance to is:
=-$\frac{1}{3}$x+2")
Then its slope is -1/3, so the slope of a line perpendicular to it would be 3. Now that we know the slope of the line that will give the shortest distance from the point to the given line, we can plug the coordinates of our point into the formula for a line to get the full equation of the new line:
=mx+b")
=3x+b")
+b\rightarrow b=2")
=3x+2")
Now that we know the equation of our perpendicular line, our next step is to find the point where it intersects the line given in the problem:


So if the lines intersect at x=0, we plug that value into either equation to find the y coordinate of the point where the lines intersect, which is the point on the line closest to the point given in the problem and therefore tells us the location of the minimum distance from the point to the line:
=3(0)+2=2")
So we now know we want to find the distance between the following two points:
") and
and ")
Using the following formula for the distance between two points, which we can see is just an application of the Pythagorean Theorem, we can plug in the values of our two points and calculate the shortest distance between the point and line given in the problem:
^2$+(y_2-y_$1)^2$}$")

Which we can then simplify by factoring the radical:

The minimum distance from the point to the line would be found by drawing a segment perpendicular to the line directly to the point. Our first step is to find the equation of the new line that connects the point to the line given in the problem. Because we know this new line is perpendicular to the line we're finding the distance to, we know its slope will be the negative inverse of the line its perpendicular to. So if the line we're finding the distance to is:
Then its slope is -1/3, so the slope of a line perpendicular to it would be 3. Now that we know the slope of the line that will give the shortest distance from the point to the given line, we can plug the coordinates of our point into the formula for a line to get the full equation of the new line:
Now that we know the equation of our perpendicular line, our next step is to find the point where it intersects the line given in the problem:
So if the lines intersect at x=0, we plug that value into either equation to find the y coordinate of the point where the lines intersect, which is the point on the line closest to the point given in the problem and therefore tells us the location of the minimum distance from the point to the line:
So we now know we want to find the distance between the following two points:
Using the following formula for the distance between two points, which we can see is just an application of the Pythagorean Theorem, we can plug in the values of our two points and calculate the shortest distance between the point and line given in the problem:
Which we can then simplify by factoring the radical:
← Didn't Know|Knew It →
What is the shortest distance between the line  and the origin?
What is the shortest distance between the line
Tap to reveal answer
The shortest distance from a point to a line is always going to be along a path perpendicular to that line. To be perpendicular to our line, we need a slope of  .
.
To find the equation of our line, we can simply use point-slope form, using the origin, giving us
(x-0)") which simplifies to
which simplifies to  .
.
Now we want to know where this line intersects with our given line. We simply set them equal to each other, giving us  .
.
If we multiply each side by  , we get
  .
.
We can then add  to each side, giving us
  .
.
Finally we divide by  , giving us
  .
.
This is the x-coordinate of their intersection. To find the y-coordinate, we plug  into
into  , giving us
  .
.
Therefore, our point of intersection must be ") .
.
We then use the distance formula  using
using ") and the origin.
and the origin.
This give us +\left($\frac{4}{25}\right)}=$\sqrt{\frac{40}{25}$}=\frac{2\sqrt{10}$}{5}") .
.
The shortest distance from a point to a line is always going to be along a path perpendicular to that line. To be perpendicular to our line, we need a slope of
To find the equation of our line, we can simply use point-slope form, using the origin, giving us
Now we want to know where this line intersects with our given line. We simply set them equal to each other, giving us
If we multiply each side by
We can then add
Finally we divide by
This is the x-coordinate of their intersection. To find the y-coordinate, we plug
Therefore, our point of intersection must be
We then use the distance formula
This give us
← Didn't Know|Knew It →
Find the distance from point ") to the line
to the line  .
.
Find the distance from point
Tap to reveal answer
Draw a line that connects the point and intersects the line at a perpendicular angle.
The vertical distance from the point ") to the line
to the line  will be the difference of the 2 y-values.
The distance can never be negative.
 = $\frac{10}{2}$+\frac{1}{2}$=\frac{11}{2}$")
Draw a line that connects the point and intersects the line at a perpendicular angle.
The vertical distance from the point
The distance can never be negative.
← Didn't Know|Knew It →
Find the distance between point ") to the line
to the line  .
.
Find the distance between point
Tap to reveal answer
Distance cannot be a negative number. The function  is a vertical line. Subtract the value of the line to the x-value of the given point to find the distance.
-$\frac{1}{2}$ \right | = \left | -1\right |=1")
Distance cannot be a negative number. The function
← Didn't Know|Knew It →
Find the distance between point ") to line
to line  .
.
Find the distance between point
Tap to reveal answer
The line  is vertical covering the first and fourth quadrant on the coordinate plane.
The x-value of ") is negative one.
is negative one.
Find the perpendicular distance from the point to the line by subtracting the values of the line and the x-value of the point.
Distance cannot be negative.
\right |=\left |2 \right |=2")
The line
The x-value of
Find the perpendicular distance from the point to the line by subtracting the values of the line and the x-value of the point.
Distance cannot be negative.
← Didn't Know|Knew It →
How far apart are the line  and the point
 ") ?
?
How far apart are the line
Tap to reveal answer
To find the distance, use the formula  where the point is
 ") and the line is
and the line is 
First, we'll re-write the equation  in this form to identify a, b, and c:
 subtract half x and add 3 to both sides
 multiply both sides by 2
 Now we see that
  . Plugging these plus
  = (2, 7 )") into the formula, we get:
into the formula, we get:
+2(7)+6 $|}{\sqrt{(-1)^2$ +( $2)^2$ }$} = $\frac{|-2 + 14+6|}{\sqrt{1+4}$ } = $\frac{18}{\sqrt5}$")
To find the distance, use the formula
First, we'll re-write the equation
← Didn't Know|Knew It →
Find the distance between  and
and ")
Find the distance between
Tap to reveal answer
To find the distance, use the formula  where the point is
 ") and the line is
and the line is 
First, we'll re-write the equation  in this form to identify
  ,
,  , and
, and  :
:
 subtract
  and
and  from both sides

Now we see that  . Plugging these plus
  = (2,-3)") into the formula, we get:
into the formula, we get:
+1(-3)-1 $|}{\sqrt{(1)^2$ $+(-4)^2$ }$} = $\frac{|-8 -3-1|}{\sqrt{1+16}$ } = $\frac{12}{\sqrt{17}$}")
To find the distance, use the formula
First, we'll re-write the equation
Now we see that
← Didn't Know|Knew It →
How far apart are the line  and the point
 ") ?
?
How far apart are the line
Tap to reveal answer
To find the distance, use the formula  where the point is
 ") and the line is
and the line is 
First, we'll re-write the equation  in this form to identify a, b, and c:
 add
add  to and subtract 8 from both sides
 multiply both sides by 3
 Now we see that
  . Plugging these plus
  = (1, 3 )") into the formula, we get:
into the formula, we get:
+3(3)-24 $|}{\sqrt{(3)^2$ +( $2)^2$ }$} = $\frac{|2 + 9-24|}{\sqrt{9+4}$ } = $\frac{13}{\sqrt{13}$}")
To find the distance, use the formula
First, we'll re-write the equation
← Didn't Know|Knew It →
Find the distance between  and
and ") .
.
Find the distance between
Tap to reveal answer
To find the distance, use the formula where the point is and the line is
First, we'll re-write the equation  in this form to identify
  ,
,  , and
, and  :
:
 add
add  and
and  to both sides
 multiply both sides by
 Now we see that
  . Plugging these plus
  = (-3,4 )") into the formula, we get:
into the formula, we get:
+5(4)+10 $|}{\sqrt{(4)^2$ $+(5)^2$ }$} = $\frac{|-12+20+10|}{\sqrt{16+25}$ } = $\frac{18}{\sqrt{41}$}")
To find the distance, use the formula
First, we'll re-write the equation
← Didn't Know|Knew It →
Find the distance between  and
and ")
Find the distance between
Tap to reveal answer
To find the distance, use the formula where the point is and the line is
First, we'll re-write the equation  in this form to identify
  ,
,  , and
, and  :
:
 subtract
  from and add
  to both sides
 multiply both sides by
 Now we see that
  . Plugging these plus
  = (-6,2 )") into the formula, we get:
into the formula, we get:
+2(2)+28 $|}{\sqrt{(-7)^2$ +( $2)^2$ }$} = $\frac{|13 + 4+28|}{\sqrt{49+4}$ } = $\frac{45}{\sqrt{53}$}")
To find the distance, use the formula
First, we'll re-write the equation
← Didn't Know|Knew It →
Find the distance between  and the point
 ")
Find the distance between
Tap to reveal answer
To find the distance, use the formula where the point is and the line is
First, we'll re-write the equation  in this form to identify
  ,
,  , and
, and  :
:
 subtract
  from and add
  to both sides
 multiply both sides by
 Now we see that
  . Plugging these plus
  = (3,-4)") into the formula, we get:
into the formula, we get:
+5(-4)+15 $|}{\sqrt{(5)^2$ +( $12)^2$ }$} = $\frac{|-36 + -20+15|}{\sqrt{25+144}$ } = $\frac{41}{\sqrt{169}$} = $\frac{41}{13}$")
To find the distance, use the formula
First, we'll re-write the equation
← Didn't Know|Knew It →
Find the minimum distance between the point and the following line:
Find the minimum distance between the point
Tap to reveal answer
The minimum distance from the point to the line would be found by drawing a segment perpendicular to the line directly to the point. Our first step is to find the equation of the new line that connects the point to the line given in the problem. Because we know this new line is perpendicular to the line we're finding the distance to, we know its slope will be the negative inverse of the line its perpendicular to. So if the line we're finding the distance to is:
Then its slope is -1/3, so the slope of a line perpendicular to it would be 3. Now that we know the slope of the line that will give the shortest distance from the point to the given line, we can plug the coordinates of our point into the formula for a line to get the full equation of the new line:
Now that we know the equation of our perpendicular line, our next step is to find the point where it intersects the line given in the problem:
So if the lines intersect at x=0, we plug that value into either equation to find the y coordinate of the point where the lines intersect, which is the point on the line closest to the point given in the problem and therefore tells us the location of the minimum distance from the point to the line:
So we now know we want to find the distance between the following two points:
and
Using the following formula for the distance between two points, which we can see is just an application of the Pythagorean Theorem, we can plug in the values of our two points and calculate the shortest distance between the point and line given in the problem:
Which we can then simplify by factoring the radical:
The minimum distance from the point to the line would be found by drawing a segment perpendicular to the line directly to the point. Our first step is to find the equation of the new line that connects the point to the line given in the problem. Because we know this new line is perpendicular to the line we're finding the distance to, we know its slope will be the negative inverse of the line its perpendicular to. So if the line we're finding the distance to is:
Then its slope is -1/3, so the slope of a line perpendicular to it would be 3. Now that we know the slope of the line that will give the shortest distance from the point to the given line, we can plug the coordinates of our point into the formula for a line to get the full equation of the new line:
Now that we know the equation of our perpendicular line, our next step is to find the point where it intersects the line given in the problem:
So if the lines intersect at x=0, we plug that value into either equation to find the y coordinate of the point where the lines intersect, which is the point on the line closest to the point given in the problem and therefore tells us the location of the minimum distance from the point to the line:
So we now know we want to find the distance between the following two points:
Using the following formula for the distance between two points, which we can see is just an application of the Pythagorean Theorem, we can plug in the values of our two points and calculate the shortest distance between the point and line given in the problem:
Which we can then simplify by factoring the radical:
← Didn't Know|Knew It →
What is the shortest distance between the line and the origin?
What is the shortest distance between the line
Tap to reveal answer
The shortest distance from a point to a line is always going to be along a path perpendicular to that line. To be perpendicular to our line, we need a slope of .
To find the equation of our line, we can simply use point-slope form, using the origin, giving us
which simplifies to .
Now we want to know where this line intersects with our given line. We simply set them equal to each other, giving us .
If we multiply each side by , we get .
We can then add to each side, giving us .
Finally we divide by , giving us .
This is the x-coordinate of their intersection. To find the y-coordinate, we plug into , giving us .
Therefore, our point of intersection must be .
We then use the distance formula using and the origin.
This give us .
The shortest distance from a point to a line is always going to be along a path perpendicular to that line. To be perpendicular to our line, we need a slope of
To find the equation of our line, we can simply use point-slope form, using the origin, giving us
Now we want to know where this line intersects with our given line. We simply set them equal to each other, giving us
If we multiply each side by
We can then add
Finally we divide by
This is the x-coordinate of their intersection. To find the y-coordinate, we plug
Therefore, our point of intersection must be
We then use the distance formula
This give us
← Didn't Know|Knew It →
Find the distance from point to the line .
Find the distance from point
Tap to reveal answer
Draw a line that connects the point and intersects the line at a perpendicular angle.
The vertical distance from the point to the line will be the difference of the 2 y-values.
The distance can never be negative.
Draw a line that connects the point and intersects the line at a perpendicular angle.
The vertical distance from the point
The distance can never be negative.
← Didn't Know|Knew It →