0%
0 / 12 answered
Phase Diagrams Practice Test
•12 QuestionsQuestion
1 / 12
Q1
Phase diagrams are used to depict changes in the properties of a solution at different temperatures and pressures. Below is a phase diagram of a polar solution.
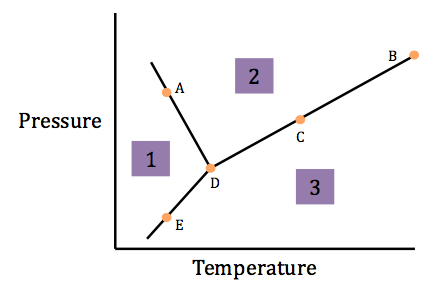
What are the phases in sections 1, 2, and 3, respectively?
Phase diagrams are used to depict changes in the properties of a solution at different temperatures and pressures. Below is a phase diagram of a polar solution.
What are the phases in sections 1, 2, and 3, respectively?