Phase Diagrams
Help Questions
MCAT Physical › Phase Diagrams
A hockey player cannot skate on dry ice due to its __________.
positive slope of its solid-liquid equilibrium line
negative slope of its solid-liquid equilibrium line
positive slope of its solid-gas equilibrium line
negative slope of its solid-gas equilibrium line
Explanation
Because dry ice is frozen carbon dioxide, it does not have the same liquid-solid equilibrium line as water and traditional ice. Its liquid-solid equilibrium line is positive, which means that increased pressure will only cause the dry ice to remain solid. If it were negative, then increased pressure would cause melting as seen with water. Skating on solids is like skating on dirt or rocks. The other choices concerning solid and gas does not apply since no gases are involved.
Which best describes the significance of a "critical point" on a phase diagram?
The highest temperature and pressure at which a substance may exist in distinct liquid and gas phases
The temperature and pressure at which a substance may exist in equilbrium between the solid, liquid, and gas phases
The highest temperature and pressure at which a substance may exist in distinct solid and liquid phases
The lowest temperature and pressure at which a substance may exist in a gaseous phase
The lowest temperature and pressure at which a substance may exist in a liquid phase
Explanation
The critical point is defined by the highest temperature and highest pressure at which a substance exists in distinct liquid and gas phases. Beyond this point, there is no distinction between the liquid and gaseous phases.
The temperature and pressure at which a substance may exist in equilibrium between the solid, liquid, and gas phases is known as the triple-point.
Phase diagrams are used to depict changes in the properties of a solution at different temperatures and pressures. Below is a phase diagram of a polar solution.
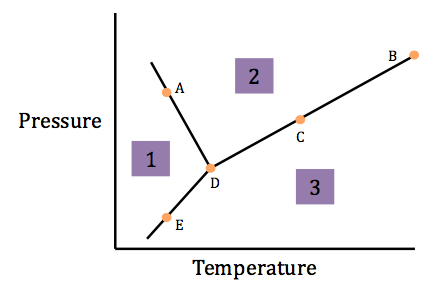
What is the name of Point D?
Triple point
Critical point
Boiling point
Freezing point
Explanation
Point D occurs at the intersection of the three segments, and is called the triple point. All three phases (solid, liquid, and gas) co-exist at the triple point.
Point B corresponds to the critical point. The freezing and boiling points are dependent on pressure, and are depicted as the lines between regions 1 and 2 (freezing) and between regions 2 and 3 (boiling).
Phase diagrams are used to depict changes in the properties of a solution at different temperatures and pressures. Below is a phase diagram of a polar solution.
What processes are occurring at Point D?
All of the above
Condensation (and vaporization)
Freezing (and melting)
Deposition (and sublimation)
Explanation
Point D is called the triple point. At the triple point, all three phases (solid, liquid, and gas) co-exist. The processes that are occurring are condensation and vaporization, sublimation and deposition, and freezing and melting.
Condensation and vaporization allow liquid and gas to co-exist. Sublimation and deposition allow solid and gas to co-exist. Freezing and melting allow solid and liquid to co-exist. In these terms, it makes sense that all six processes occur at the triple point.
Phase diagrams are used to depict changes in the properties of a solution at different temperatures and pressures. Below is a phase diagram of a polar solution.
What is the name of Point B?
Critical point
Triple point
Freezing point
Melting point
Explanation
Point B occurs at the highest pressure and temperature point on the phase diagram. This point is called the critical point, meaning that at temperatures and pressures beyond this point separate gas and liquid phases do not exist.
Phase diagrams are used to depict changes in the properties of a solution at different temperatures and pressures. Below is a phase diagram of a polar solution.
At temperatures and pressures above those at Point B, the material is called a __________.
Supercritical fluid
Plasma
Gas
Liquid
Explanation
Point B is known as the critical point. While identifying this point on the phase diagram is important, it is also important to know that at temperatures and pressures above the critical point, the solution is called a supercritical fluid, meaning that separate gas and liquid phases do not exist.
The phase diagram for water (H2O) shows that it can go through all three phases at a pressure of 1atm. The phase diagram for carbon dioxide (CO2) shows that it can only be a solid or a gas at 1atm.
Based on this information, which statement is true?
CO2 has a higher triple point pressure than H2O
CO2 does not have a liquid phase
CO2 will not sublimate at a pressure of 1atm
Raising the pressure when CO2 is a solid will result in CO2 liquid
Explanation
The phase diagram for carbon dioxide (CO2) shows that it will sublimate from a solid to a gas as temperature is increased at one atmosphere of pressure. If a solid immediately goes to a gas, we can conclude that the pressure is too low to allow the substance to first go through the liquid phase. As a result, we can conclude that the point in which CO2 is in all three phases (the triple point) will take place at a higher pressure than 1atm. Because water (H2O) is able to go through all of its three phases at a pressure of 1atm, we know that the triple point pressure is less than 1atm.
Phase diagrams are used to depict changes in the properties of a solution at different temperatures and pressures. Below is a phase diagram of a polar solution.
What processes are occurring at Point C?
Vaporization/condensation
Freezing/melting
Deposition/sublimation
None of these
Explanation
First, it is important to identify what phases are occurring on each side of the line on which Point C rests. In section two, both the pressure and temperature are intermediate, meaning the solution is a liquid. In section three, both the pressure and temperature are high, meaning the solution is a gas. In other words, the segment that Point C is on is the equilibrium line between liquid and gas, thus, vaporization and condensation are occurring at Point C.
Phase diagrams are used to depict changes in the properties of a solution at different temperatures and pressures. Below is a phase diagram of a polar solution.
What processes are occurring at Point E?
Deposition/sublimation
Freezing/melting
Vaporization/condensation
None of these
Explanation
First, it is important to identify what phases are occurring on each side of the line on which Point E rests. In section 1, the pressure is high and the temperature low, meaning the solution is a solid. In section three, both the pressure and temperature are high, meaning the solution is a gas. In other words, the segment that Point E is on is the equilibrium line between solid and gas, thus, deposition and sublimation are occurring at Point E.
Phase diagrams are used to depict changes in the properties of a solution at different temperatures and pressures. Below is a phase diagram of a polar solution.
What processes are occurring at Point A?
Freezing/melting
Deposition/sublimation
Condensation/vaporization
None of these
Explanation
First, it is important to identify what phases are occurring on each side of the line on which Point A rests. In section 1, the pressure is high and the temperature low, meaning the solution is a solid. In section two, both the pressure and temperature are intermediate, meaning the solution is a liquid. In other words, the segment that Point A is on is the equilibrium line between solid and liquid, thus, melting and freezing are occurring at Point A.