Coordinate Geometry - ISEE Lower Level Quantitative Reasoning
Card 0 of 1195
A coordinate plane is shown.
Ralph plotted the following points on the coordinate grid:
Point W (2, 4); Point X (3, 6); Point Y (5, 4); Point Z (6, 6)
A polygon is formed with vertices W, X, Y, and Z. Which type of polygon is formed?
A coordinate plane is shown.
Ralph plotted the following points on the coordinate grid:
Point W (2, 4); Point X (3, 6); Point Y (5, 4); Point Z (6, 6)
A polygon is formed with vertices W, X, Y, and Z. Which type of polygon is formed?
Begin by plotting the points and connecting the vertices.
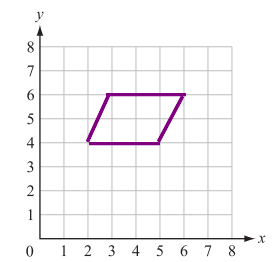
The quadrilateral that is created has two sets of parallel sides. Out of the possible answer choices, this can describe both squares and parallelograms. Because the figure does not contain right angles and the sides are not all the same length, it must be a parallelogram.
Begin by plotting the points and connecting the vertices.
The quadrilateral that is created has two sets of parallel sides. Out of the possible answer choices, this can describe both squares and parallelograms. Because the figure does not contain right angles and the sides are not all the same length, it must be a parallelogram.
Compare your answer with the correct one above
A coordinate plane is shown.
Ralph plotted the following points on the coordinate grid:
Point W (1, 1); Point X (7, 3); Point Y (1, 6); Point Z (7, 8)
A polygon is formed with vertices W, X, Y, and Z. Which type of polygon is formed?
A coordinate plane is shown.
Ralph plotted the following points on the coordinate grid:
Point W (1, 1); Point X (7, 3); Point Y (1, 6); Point Z (7, 8)
A polygon is formed with vertices W, X, Y, and Z. Which type of polygon is formed?
Begin by plotting and connecting the vertices.
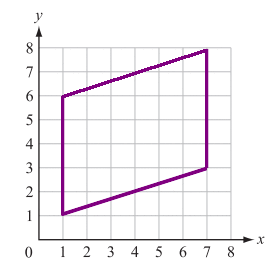
The quadrilateral that is created has two sets of parallel sides. Out of the possible answer choices, this can describe both rhombuses and parallelograms. Because the sides are not all the same length, it must be a parallelogram.
Begin by plotting and connecting the vertices.
The quadrilateral that is created has two sets of parallel sides. Out of the possible answer choices, this can describe both rhombuses and parallelograms. Because the sides are not all the same length, it must be a parallelogram.
Compare your answer with the correct one above
A shape is plotted on a coordinate axis. The endpoints are , (9,0), (2,4), and\ (9,4)") . What shape is it?
. What shape is it?
A shape is plotted on a coordinate axis. The endpoints are
Plot the points on a coordinate axis. Once it's graphed, you can see that there are two pairs of congruent, or equal, sides. The shape that best fits these characteristics is a rectangle.
Plot the points on a coordinate axis. Once it's graphed, you can see that there are two pairs of congruent, or equal, sides. The shape that best fits these characteristics is a rectangle.
Compare your answer with the correct one above
Rectangle  has coordinate points:
 ") ,
, ") ,
, ") ,
, ") . Find the area of rectangle
. Find the area of rectangle  .
.
Rectangle
The area of rectangle  can be found by multiplying the width and length of the rectangle.
To find the length of the rectangle compare the x values of two of the coordinates:
Since , C(2,4)") the length is
the length is =4") .
.
To find the width of the rectangle we need to look at the y coordinates of two of the points.
Since , C(2,4)") the width is
the width is  .
.
The solution is:


The area of rectangle
To find the length of the rectangle compare the x values of two of the coordinates:
Since
To find the width of the rectangle we need to look at the y coordinates of two of the points.
Since
The solution is:
Compare your answer with the correct one above
Rectangle  has coordinate points:
 ") ,
, ") ,
, ") ,
, ") . Find the perimeter of rectangle
. Find the perimeter of rectangle 
Rectangle
In order to find the perimeter of a rectangle apply the formula:
+2(length)")
Thus the solution is:
Looking at the coordinate points we found our width and our length
 .
.
Plugging these values into the perimeter equation we get:
+2(5)")

In order to find the perimeter of a rectangle apply the formula:
Thus the solution is:
Looking at the coordinate points we found our width
Plugging these values into the perimeter equation we get:
Compare your answer with the correct one above
Rectangle has coordinate points: , , , . Find the perimeter of rectangle .
Rectangle
In order to find the perimeter of rectangle apply the formula:  + 2(length)")
To find the length and width of the rectangle look at the difference in the x values and look for the difference in the y values of the coordinates.
, B(-2,4) \rightarrow 4-2=2")
, C(2,4) \rightarrow 2-(-2)=4")
Since, the width of rectangle  is
is  and the length is
  the solution is:
+2(2)=8+4=12")
In order to find the perimeter of rectangle apply the formula:
To find the length and width of the rectangle look at the difference in the x values and look for the difference in the y values of the coordinates.
Since, the width of rectangle
Compare your answer with the correct one above

Rectangle  has coordinates:
 ") ,
,") ,
, ") ,
, ") . Find the area of rectangle
. Find the area of rectangle  .
.
Rectangle
In order to find the area of rectangle  apply the formula:
Since rectangle  has a width of
  and a length of
  the solution is:
 square units
In order to find the area of rectangle
Since rectangle
Compare your answer with the correct one above
Rectangle  has coordinates:
 ") ,
,") ,
, ") ,
, ") . What is the perimeter?
. What is the perimeter?
Rectangle
To find the perimeter of rectangle  , apply the formula:
 +2(length)")
Thus, the solution is:
+2(4)")


To find the perimeter of rectangle
Thus, the solution is:
Compare your answer with the correct one above
Select the graph that displays the polygon created using the following coordinates:
")
")
")
")
Select the graph that displays the polygon created using the following coordinates:
")
")
")
")
When we are given coordinate points, it's important to know the difference between the x-axis and the y-axis, and which order these points are given. The x-axis is the axis that runs left to right and the y-axis is the axis the runs up and down. When coordinate points are written, the x value goes first, followed by the y value ") .
.
Knowing this information, we can plot the points and use straight lines to connect them in a counter-clockwise or clockwise direction. The provided coordinate points should create the following graph:

When we are given coordinate points, it's important to know the difference between the x-axis and the y-axis, and which order these points are given. The x-axis is the axis that runs left to right and the y-axis is the axis the runs up and down. When coordinate points are written, the x value goes first, followed by the y value ")
Knowing this information, we can plot the points and use straight lines to connect them in a counter-clockwise or clockwise direction. The provided coordinate points should create the following graph:
Compare your answer with the correct one above