Calculations
Help Questions
AP Chemistry › Calculations
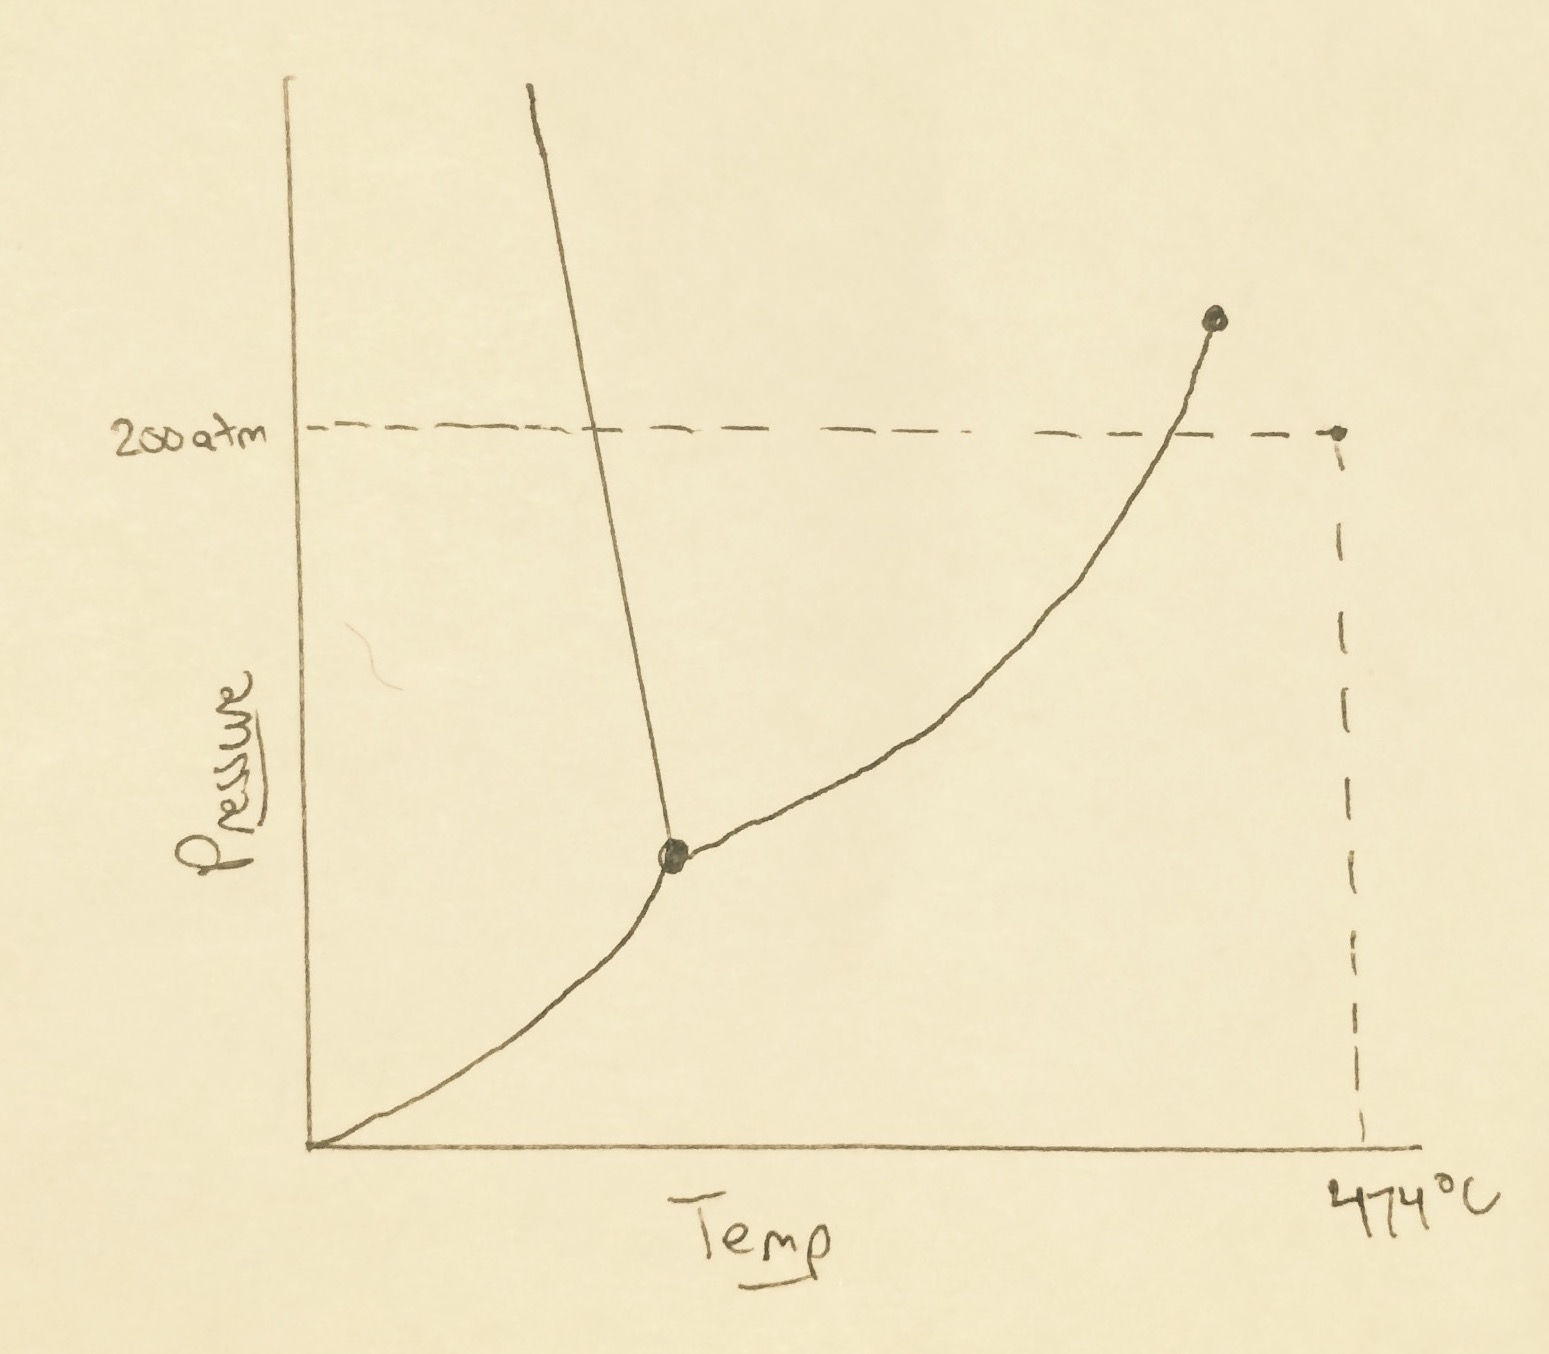
If a solution of water has a pressure of 200atm and a temperature of 474 degrees Celsius, what changes could be made to bring the sample to its critical point?
Increase the pressure and decrease the temperature
Increase the pressure and increase the temperature
Decrease the pressure and increase the temperature
Decrease the pressure and decrease the temperature
The critical point cannot be reached from these starting conditions
Explanation
The critical point for water is at 218atm and 374 degrees Celcius, but on this graph it can be found at the end of the line between the gas and liquid portions of the water phase graph (you can see it end with a dot). This means we need to increase our pressure and decrease our temperature in order to reach the critical point from our initial conditions.
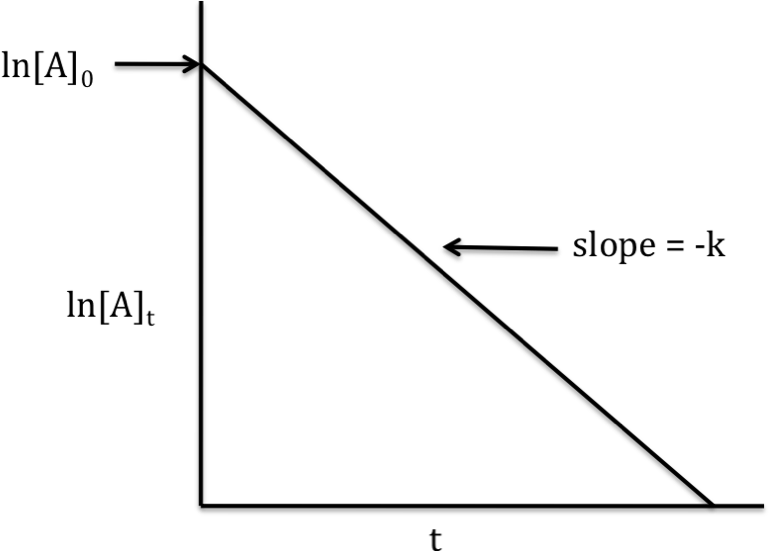
A chemistry student is trying to identify the reaction order for a reaction based on her interpretation of the above graph. The student identifies the reaction as a first-order reaction. Is this student correct in their conclusion? Why?
Yes. A graph of the natural logarithm of the concentration of a reactant versus time yields a straight line with a negative slope for a first-order reaction.
Yes. Regardless of the order of the reaction, a graph of the natural logarithm of the concentration of a reactant versus time will always yield a straight line with a negative slope.
No. A graph of the natural logarithm of the concentration of a reactant versus time yields a straight line with a negative slope for a zeroth-order reaction.
No. A graph of the natural logarithm of the concentration of a reactant versus time yields a straight line with a negative slope for a second-order reaction.
Additional information is necessary in order to determine whether the graph corresponds to a first-order reaction.
Explanation
A first-order reaction can be expressed in different ways. One way is the following:

where:


By taking the natural logarithm of both sides, we can obtain an alternative form of the equation, expressed as:

This second equation is useful for graphing, because it fits the general equation of 


In the case of a zeroth-order reaction, the equation is:

Therefore, for a zeroth-order reaction, a straight line with a negative slope will only result from a graph of the concentration of a reactant versus time.
And lastly, in the case of a second-order reaction, the equation is:

Hence, a graph of the inverse concentration of a reactant versus time will yield a straight line with a positive slope, and this is indicative of a second-order reaction.
A chemistry student is trying to identify the reaction order for a reaction based on her interpretation of the above graph. The student identifies the reaction as a first-order reaction. Is this student correct in their conclusion? Why?
Yes. A graph of the natural logarithm of the concentration of a reactant versus time yields a straight line with a negative slope for a first-order reaction.
Yes. Regardless of the order of the reaction, a graph of the natural logarithm of the concentration of a reactant versus time will always yield a straight line with a negative slope.
No. A graph of the natural logarithm of the concentration of a reactant versus time yields a straight line with a negative slope for a zeroth-order reaction.
No. A graph of the natural logarithm of the concentration of a reactant versus time yields a straight line with a negative slope for a second-order reaction.
Additional information is necessary in order to determine whether the graph corresponds to a first-order reaction.
Explanation
A first-order reaction can be expressed in different ways. One way is the following:
where:
By taking the natural logarithm of both sides, we can obtain an alternative form of the equation, expressed as:
This second equation is useful for graphing, because it fits the general equation of
In the case of a zeroth-order reaction, the equation is:
Therefore, for a zeroth-order reaction, a straight line with a negative slope will only result from a graph of the concentration of a reactant versus time.
And lastly, in the case of a second-order reaction, the equation is:
Hence, a graph of the inverse concentration of a reactant versus time will yield a straight line with a positive slope, and this is indicative of a second-order reaction.
How many significant figures are in the number 0.00150?


Explanation
Remember that all leading zeroes are not significant figures.
So for 0.00150, we start counting significant figures where the 1 is. The last 0 is a significant figure because it is a trailing zero found after the decimal point.
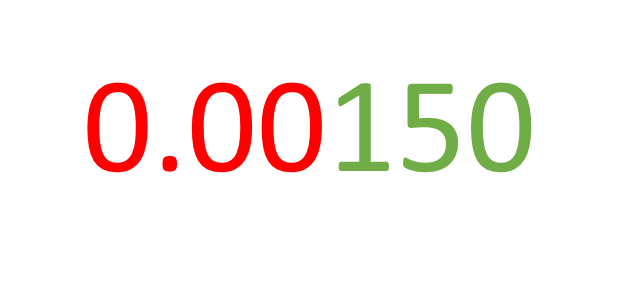
The digits in red are not significant. The digits in green are significant.
Calculate and give the answer with the correct number of significant figures.
\cdot(10\cdot9.22)")


Explanation
For multistep calculations, make sure to keep track of the number of significant figures at the end of each step so we know how many significant figures to round to at the end of the entire calculation. To maintain accuracy, do not round intermediate steps.
First, do the two multiplication problems found within the parentheses.

Recall that for multiplication, the result needs to have the same number of significant figures as the factor with the least number of significant figures. Our answer from the addition should then only have 3 significant figures since that is the number of significant figures 3.14 has. To remember that the answer should only have 3 significant figures, the last significant digit will be highlighted:


Recall that for multiplication, the result needs to have the same number of significant figures as the factor with the least number of significant figures. Our answer from the addition should then only have 1 significant figure since that is the number of significant figures 10 has. To remember that the answer should only have 1 significant figure, the last significant digit will be highlighted:

Now, multiply:
({\color{Magenta} 9}2.2)=5570.13392")
Since the factor with the least number of significant figures only has 1 significant figure, the answer must also be rounded to 1 significant figure. 5570.13393 is rounded to 6000.
How many significant figures are in the number 0.00150?
Explanation
Remember that all leading zeroes are not significant figures.
So for 0.00150, we start counting significant figures where the 1 is. The last 0 is a significant figure because it is a trailing zero found after the decimal point.
The digits in red are not significant. The digits in green are significant.
Calculate and give the answer with the correct number of significant figures.


Explanation
First, do the calculation.

Recall that for multiplication and division, the answer uses the least number of significant figures found in the question. In this case, 3.0 has the least number of significant figures at 2. The final answer should then be rounded up to only have 2 significant figures also. Thus we round up to 270.
How many significant figures are in the number 0.50210?


Explanation
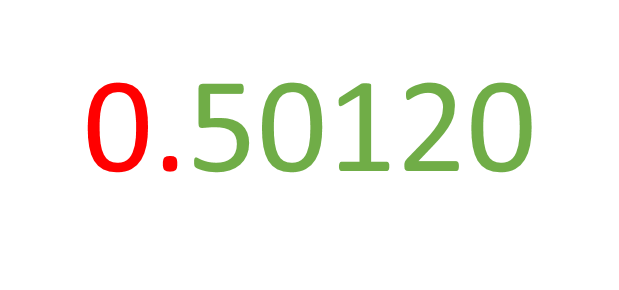
The digit in red is not significant because this is a leading zero. All the digits in green are significant. The first 0 is significant because it is sandwiched between two non-zero digits. The last 0 is also significant because it is a trailing zero that comes after a decimal point. Thus, this has 5 significant figures.
Calculate and give the answer using the correct number of significant figures.


Explanation
First, add up the numbers.

Because this is addition, the result of the calculation needs to have the same number of decimal places as the number with the fewest decimal places. Since 8.2 has the least number of places after the decimal point, the answer must also only have 1 digit after the decimal point.