How to find data representation in biology - ACT Science
Card 0 of 2176
The graph below indicates the numbers of three different kinds of rare beetles that were found in a section of forest over a period of years.

Which species had the highest density in 1970?
The graph below indicates the numbers of three different kinds of rare beetles that were found in a section of forest over a period of years.
Which species had the highest density in 1970?
Considering the region halfway between 1965 and 1975, Lucanidae had by far the highest density.
Considering the region halfway between 1965 and 1975, Lucanidae had by far the highest density.
Compare your answer with the correct one above
The graph below indicates the numbers of three different kinds of rare beetles that were found in a section of forest over a period of years.
Which of the following years was the most favorable for growth for Scarabaeidae?
The graph below indicates the numbers of three different kinds of rare beetles that were found in a section of forest over a period of years.
Which of the following years was the most favorable for growth for Scarabaeidae?
1978 is the only year listed in which the density of Scarabaeidae increased.
1978 is the only year listed in which the density of Scarabaeidae increased.
Compare your answer with the correct one above
The graph below indicates the numbers of three different kinds of rare beetles that were found in a section of forest over a period of years.
In which of the following years did Staphylinidae have the highest density?
The graph below indicates the numbers of three different kinds of rare beetles that were found in a section of forest over a period of years.
In which of the following years did Staphylinidae have the highest density?
In 1960 Staphylinidae has the highest density.
In 1960 Staphylinidae has the highest density.
Compare your answer with the correct one above
The graph below indicates the numbers of three different kinds of rare beetles that were found in a section of forest over a period of years.
Which of the following is a possible scenario that during the 1930s to 1950?
The graph below indicates the numbers of three different kinds of rare beetles that were found in a section of forest over a period of years.
Which of the following is a possible scenario that during the 1930s to 1950?
During the 1930s to around 1950, the density of Scarabaeidae fell, allowing the other species to prosper in the following decades.
During the 1930s to around 1950, the density of Scarabaeidae fell, allowing the other species to prosper in the following decades.
Compare your answer with the correct one above
| | G | g | |
| ---- | -- | -- |
| g | Gg | gg |
| g | Gg | gg |
Scientist’s believe they have found the gene accountable for intelligence. The allele “G” is dominant, and the allele “g” is recessive. The intelligence gene is optimally expressed in the homozygous recessive form. The chart above shows the trait in the heterozygous form and the homozygous form. The form “gg” is from the mother, and “Gg” is from the father. The parents want to know what the gene might look like in their child.
What genotypes would two parents want to have to increase their chances of a child exhibiting an optimal intelligence phenotype?
| | G | g | | | ---- | -- | -- | | g | Gg | gg | | g | Gg | gg |
Scientist’s believe they have found the gene accountable for intelligence. The allele “G” is dominant, and the allele “g” is recessive. The intelligence gene is optimally expressed in the homozygous recessive form. The chart above shows the trait in the heterozygous form and the homozygous form. The form “gg” is from the mother, and “Gg” is from the father. The parents want to know what the gene might look like in their child.
What genotypes would two parents want to have to increase their chances of a child exhibiting an optimal intelligence phenotype?
Two parents with genotype "gg" would create a 100 percent chance of having a child with the "gg" genotype, which results in the optimal intelligence phenotype.
Two parents with genotype "gg" would create a 100 percent chance of having a child with the "gg" genotype, which results in the optimal intelligence phenotype.
Compare your answer with the correct one above
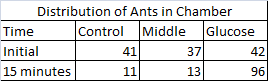
A researcher studies the olfactory (scent-related) senses of the giant forest ant, Camponotus gigas. The researcher places 120 ants in a three-chambered cell. The cell has an end section with a cotton ball soaked in a saline solution and another end with a cotton ball soaked in a glucose solution. The ants are placed in the middle and timed for 15 minutes. Their initial and final positions in the cell are recorded (see Table 1). The researcher's null hypothesis states that the distribution of ants across the three chambers will be equal to one another. In other words, the glucose solution will have no effect and there will be no significant difference in the distribution of the insects.
Table 1
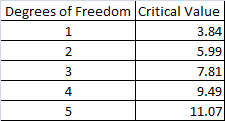
The researcher decides to perform a statistical test known as a Chi-squared test of independence to interpret the experiment's results. The test is performed by calculating a Chi-squared statistic by utilizing observed and expected values for distribution (see Table 2). If the sum of the Chi-squared test statistic is higher than the critical value, then the null hypothesis can be rejected. This indicates that the distribution of insects is not random and the variable in question has a pronounced effect on the subjects. A critical value is calculated by determining the degrees of freedom, which in this experiment is equal to the number of categories in the study minus one, and then locating the proper number on a table (see Table 3). There are three possible categories in this experiment: the glucose end, the control end (with the saline-solution soaked cotton ball), and middle portion of the chamber.
Table 2
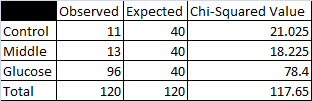
Table 3
What is the critical value of this experiment?
A researcher studies the olfactory (scent-related) senses of the giant forest ant, Camponotus gigas. The researcher places 120 ants in a three-chambered cell. The cell has an end section with a cotton ball soaked in a saline solution and another end with a cotton ball soaked in a glucose solution. The ants are placed in the middle and timed for 15 minutes. Their initial and final positions in the cell are recorded (see Table 1). The researcher's null hypothesis states that the distribution of ants across the three chambers will be equal to one another. In other words, the glucose solution will have no effect and there will be no significant difference in the distribution of the insects.
Table 1
The researcher decides to perform a statistical test known as a Chi-squared test of independence to interpret the experiment's results. The test is performed by calculating a Chi-squared statistic by utilizing observed and expected values for distribution (see Table 2). If the sum of the Chi-squared test statistic is higher than the critical value, then the null hypothesis can be rejected. This indicates that the distribution of insects is not random and the variable in question has a pronounced effect on the subjects. A critical value is calculated by determining the degrees of freedom, which in this experiment is equal to the number of categories in the study minus one, and then locating the proper number on a table (see Table 3). There are three possible categories in this experiment: the glucose end, the control end (with the saline-solution soaked cotton ball), and middle portion of the chamber.
Table 2
Table 3
What is the critical value of this experiment?
Paragraph two states the following: "A critical value is calculated by determining the degrees of freedom, which in this experiment is equal to the number of categories in the study minus one, and then locating the proper number on a table (see Table 3). There are three possible categories in this experiment: the glucose end, the control end (with the saline-solution soaked cotton ball), and middle portion of the chamber."
The degrees of freedom are found by subtracting one from the number of catagories. There are three catagories; therefore, the the degrees of freedom for the statistical test is two.

According to Table 3,  correlates with two degrees of freedom and is the critical value for the study.
Paragraph two states the following: "A critical value is calculated by determining the degrees of freedom, which in this experiment is equal to the number of categories in the study minus one, and then locating the proper number on a table (see Table 3). There are three possible categories in this experiment: the glucose end, the control end (with the saline-solution soaked cotton ball), and middle portion of the chamber."
The degrees of freedom are found by subtracting one from the number of catagories. There are three catagories; therefore, the the degrees of freedom for the statistical test is two.
According to Table 3,
Compare your answer with the correct one above
A researcher studies the olfactory (scent-related) senses of the giant forest ant, Camponotus gigas. The researcher places 120 ants in a three-chambered cell. The cell has an end section with a cotton ball soaked in a saline solution and another end with a cotton ball soaked in a glucose solution. The ants are placed in the middle and timed for 15 minutes. Their initial and final positions in the cell are recorded (see Table 1). The researcher's null hypothesis states that the distribution of ants across the three chambers will be equal to one another. In other words, the glucose solution will have no effect and there will be no significant difference in the distribution of the insects.
Table 1
The researcher decides to perform a statistical test known as a Chi-squared test of independence to interpret the experiment's results. The test is performed by calculating a Chi-squared statistic by utilizing observed and expected values for distribution (see Table 2). If the sum of the Chi-squared test statistic is higher than the critical value, then the null hypothesis can be rejected. This indicates that the distribution of insects is not random and the variable in question has a pronounced effect on the subjects. A critical value is calculated by determining the degrees of freedom, which in this experiment is equal to the number of categories in the study minus one, and then locating the proper number on a table (see Table 3). There are three possible categories in this experiment: the glucose end, the control end (with the saline-solution soaked cotton ball), and middle portion of the chamber.
Table 2
Table 3
If the null hypothesis for this study were supported, what could be said about the ants' distribution?
The null hypothesis describes what results the experiment will yield if the variable being measured makes no difference to the results. This means that the ants should have no difference in their distribution across the cell if the null hypohtesis is supported, since they will not be attracted to the glucose any more than they would be attracted to any other part of the test chamber. If the null hypothesis is supported for this study, then the ants should be distribute themselves equally throughout the chambers.
The null hypothesis describes what results the experiment will yield if the variable being measured makes no difference to the results. This means that the ants should have no difference in their distribution across the cell if the null hypohtesis is supported, since they will not be attracted to the glucose any more than they would be attracted to any other part of the test chamber. If the null hypothesis is supported for this study, then the ants should be distribute themselves equally throughout the chambers.
Compare your answer with the correct one above

The chart above shows the height growth of three different plant species after a period of 2 weeks. Each plant species was grown in 4 different soil mediums. All the plants were grown in the same environment with equal amounts of light, water, and oxygen.
What could be added to this experiment to improve the data representation?
All of the options listed would make the data representation better.
All of the options listed would make the data representation better.
Compare your answer with the correct one above
Error bars are utilized in scientific graphs to show the difference between data points. If the error bars of data points overlap then they are not statistically independent from one another; therefore, they can be considered to be similar to one another. Only data points that possess non-overlapping error bars are sufficient to make or support a scientific conclusion.

Are these data points statistically independent from one another?
Error bars are utilized in scientific graphs to show the difference between data points. If the error bars of data points overlap then they are not statistically independent from one another; therefore, they can be considered to be similar to one another. Only data points that possess non-overlapping error bars are sufficient to make or support a scientific conclusion.
Are these data points statistically independent from one another?
Yes, the error bars do not overlap.
The error bars within the data points of the graph do not overlap. According to the passage, they are statistically independent from one another.
Yes, the error bars do not overlap.
The error bars within the data points of the graph do not overlap. According to the passage, they are statistically independent from one another.
Compare your answer with the correct one above
A group of scientists wanted to test the effects of Nitra-Grow, a chemical additive that can be given to plants to help them grow. 3 test groups of plants were given all the same time of sunlight, the same type of soil, and the same amount of water. Plant A was given no extra chemicals. Plant B was given 5g of Nitra-Grow. Plant C was given 5g of Ammonia to see if Nitra-Grow worked any better than a basic nitrogen-based household product. The plants are then measured on 5 consecutive days to find their average height (in cm).
DAY Height Plant A (cm) Height Plant B (cm) Height Plant C (cm) 1 1.2 1.2 1.2 2 1.4 1.4 1.2 3 1.6 1.8 1.3 4 1.8 2.4 1.3 5 2.0 2.6 1.4
On Day 7, what would be plant A’s approximate height?
A group of scientists wanted to test the effects of Nitra-Grow, a chemical additive that can be given to plants to help them grow. 3 test groups of plants were given all the same time of sunlight, the same type of soil, and the same amount of water. Plant A was given no extra chemicals. Plant B was given 5g of Nitra-Grow. Plant C was given 5g of Ammonia to see if Nitra-Grow worked any better than a basic nitrogen-based household product. The plants are then measured on 5 consecutive days to find their average height (in cm).
| DAY | Height Plant A (cm) | Height Plant B (cm) | Height Plant C (cm) |
|---|---|---|---|
| 1 | 1.2 | 1.2 | 1.2 |
| 2 | 1.4 | 1.4 | 1.2 |
| 3 | 1.6 | 1.8 | 1.3 |
| 4 | 1.8 | 2.4 | 1.3 |
| 5 | 2.0 | 2.6 | 1.4 |
On Day 7, what would be plant A’s approximate height?
The answer is 2.4cm. Every day, plant A increases by a normal rate of 0.2cm per day. Thus adding 0.2 two times to 2.0 will result in 2.4cm.
The answer is 2.4cm. Every day, plant A increases by a normal rate of 0.2cm per day. Thus adding 0.2 two times to 2.0 will result in 2.4cm.
Compare your answer with the correct one above
Error bars are utilized in scientific graphs to show the difference between data points. If the error bars of data points overlap then they are not statistically independent from one another; therefore, they can be considered to be similar to one another. Only data points that possess non-overlapping error bars are sufficient to make or support a scientific conclusion.

Is this data set statistically valid?
Error bars are utilized in scientific graphs to show the difference between data points. If the error bars of data points overlap then they are not statistically independent from one another; therefore, they can be considered to be similar to one another. Only data points that possess non-overlapping error bars are sufficient to make or support a scientific conclusion.
Is this data set statistically valid?
No, there is too much overlap between error bars.
The error bars in this data set contain significant overlap. Each point is statistically similiar to the other. Any differences seen in these points could be the result of error or deviation from the mean.
No, there is too much overlap between error bars.
The error bars in this data set contain significant overlap. Each point is statistically similiar to the other. Any differences seen in these points could be the result of error or deviation from the mean.
Compare your answer with the correct one above
A group of scientists wanted to test the effects of Nitra-Grow, a chemical additive that can be given to plants to help them grow. 3 test groups of plants were given all the same time of sunlight, the same type of soil, and the same amount of water. Plant A was given no extra chemicals. Plant B was given 5g of Nitra-Grow. Plant C was given 5g of Ammonia to see if Nitra-Grow worked any better than a basic nitrogen-based household product. The plants are then measured on 5 consecutive days to find their average height (in cm).
DAY Height Plant A (cm) Height Plant B (cm) Height Plant C (cm) 1 1.2 1.2 1.2 2 1.4 1.4 1.2 3 1.6 1.8 1.3 4 1.8 2.4 1.3 5 2.0 2.6 1.4
Which plant is the control group?
A group of scientists wanted to test the effects of Nitra-Grow, a chemical additive that can be given to plants to help them grow. 3 test groups of plants were given all the same time of sunlight, the same type of soil, and the same amount of water. Plant A was given no extra chemicals. Plant B was given 5g of Nitra-Grow. Plant C was given 5g of Ammonia to see if Nitra-Grow worked any better than a basic nitrogen-based household product. The plants are then measured on 5 consecutive days to find their average height (in cm).
| DAY | Height Plant A (cm) | Height Plant B (cm) | Height Plant C (cm) |
|---|---|---|---|
| 1 | 1.2 | 1.2 | 1.2 |
| 2 | 1.4 | 1.4 | 1.2 |
| 3 | 1.6 | 1.8 | 1.3 |
| 4 | 1.8 | 2.4 | 1.3 |
| 5 | 2.0 | 2.6 | 1.4 |
Which plant is the control group?
The answer is Plant A. Plant A is getting no extra treatment, whereas Plants B and C are getting added chemicals. (Even though Plant C is being compared as a generic chemical vs. name brand chemical, it is still getting treatment)
The answer is Plant A. Plant A is getting no extra treatment, whereas Plants B and C are getting added chemicals. (Even though Plant C is being compared as a generic chemical vs. name brand chemical, it is still getting treatment)
Compare your answer with the correct one above
Chemotherapy No treatment Surgery and Chemotherapy 2 inches 2 inches 2 inches 2.1 inches 3 inches .05 inches 1.8 inches 5 inches .09 inches 1.4 inches 7 inches .05 inches 1 inch 9 inches .03 inches
The table above shows measurements for tumor size growth over time within three different possible treatment methods. Each tumor was first documented at an initial size of 2 inches. Every month each tumor was measured, for a total of five measurements of each tumor.
Looking at the "Surgery and Chemotherapy" treatment column, where could one infer that chemotherapy was performed?
| Chemotherapy | No treatment | Surgery and Chemotherapy |
|---|---|---|
| 2 inches | 2 inches | 2 inches |
| 2.1 inches | 3 inches | .05 inches |
| 1.8 inches | 5 inches | .09 inches |
| 1.4 inches | 7 inches | .05 inches |
| 1 inch | 9 inches | .03 inches |
The table above shows measurements for tumor size growth over time within three different possible treatment methods. Each tumor was first documented at an initial size of 2 inches. Every month each tumor was measured, for a total of five measurements of each tumor.
Looking at the "Surgery and Chemotherapy" treatment column, where could one infer that chemotherapy was performed?
One would think that surgery as opposed to chemotherapy resulted in a drastic reduction of tumor size; therefore, the smaller reduction of size can be attributed to chemotherapy (0.09 to 0.05).
One would think that surgery as opposed to chemotherapy resulted in a drastic reduction of tumor size; therefore, the smaller reduction of size can be attributed to chemotherapy (0.09 to 0.05).
Compare your answer with the correct one above
Chemotherapy No treatment Surgery and Chemotherapy 2 inches 2 inches 2 inches 2.1 inches 3 inches .05 inches 1.8 inches 5 inches .09 inches 1.4 inches 7 inches .05 inches 1 inch 9 inches .03 inches
The table above shows measurements for tumor size growth over time within three different possible treatment methods. Each tumor was first documented at an initial size of 2 inches. Every month each tumor was measured, for a total of five measurements of each tumor.
Based on the table above, which single method is most effective at reducing tumor size in the shortest period of time?
| Chemotherapy | No treatment | Surgery and Chemotherapy |
|---|---|---|
| 2 inches | 2 inches | 2 inches |
| 2.1 inches | 3 inches | .05 inches |
| 1.8 inches | 5 inches | .09 inches |
| 1.4 inches | 7 inches | .05 inches |
| 1 inch | 9 inches | .03 inches |
The table above shows measurements for tumor size growth over time within three different possible treatment methods. Each tumor was first documented at an initial size of 2 inches. Every month each tumor was measured, for a total of five measurements of each tumor.
Based on the table above, which single method is most effective at reducing tumor size in the shortest period of time?
The tumor size decrease from surgery alone was 2 to 0.05 inches, the largest decrease on the chart. Don't be tricked into answering "Surgery and Chemotherapy" because the questions asks for which single method is most effective.
The tumor size decrease from surgery alone was 2 to 0.05 inches, the largest decrease on the chart. Don't be tricked into answering "Surgery and Chemotherapy" because the questions asks for which single method is most effective.
Compare your answer with the correct one above
Chemotherapy No treatment Surgery and Chemotherapy 2 inches 2 inches 2 inches 2.1 inches 3 inches .05 inches 1.8 inches 5 inches .09 inches 1.4 inches 7 inches .05 inches 1 inch 9 inches .03 inches
The table above shows measurements for tumor size growth over time within three different possible treatment methods. Each tumor was first documented at an initial size of 2 inches. Every month each tumor was measured, for a total of five measurements of each tumor.
What information would be most important to know before drawing conclusions based on this data?
| Chemotherapy | No treatment | Surgery and Chemotherapy |
|---|---|---|
| 2 inches | 2 inches | 2 inches |
| 2.1 inches | 3 inches | .05 inches |
| 1.8 inches | 5 inches | .09 inches |
| 1.4 inches | 7 inches | .05 inches |
| 1 inch | 9 inches | .03 inches |
The table above shows measurements for tumor size growth over time within three different possible treatment methods. Each tumor was first documented at an initial size of 2 inches. Every month each tumor was measured, for a total of five measurements of each tumor.
What information would be most important to know before drawing conclusions based on this data?
The key is here the phrase most important. The location and stage of the cancer would play the biggest role in terms of treatment results. All of the other information would be helpful, but the question asks to prioritize which is the most important.
The key is here the phrase most important. The location and stage of the cancer would play the biggest role in terms of treatment results. All of the other information would be helpful, but the question asks to prioritize which is the most important.
Compare your answer with the correct one above
Error bars are utilized in scientific graphs to show the difference between data points. If the error bars of data points overlap then they are not statistically independent from one another; therefore, they can be considered to be similar to one another. Only data points that possess non-overlapping error bars are sufficient to make or support a scientific conclusion.

Are these data points statistically significant?
Error bars are utilized in scientific graphs to show the difference between data points. If the error bars of data points overlap then they are not statistically independent from one another; therefore, they can be considered to be similar to one another. Only data points that possess non-overlapping error bars are sufficient to make or support a scientific conclusion.
Are these data points statistically significant?
Yes, there is little to no overlap between the points.
The data points in the red square possess error bars that do not overlap. These points are statistically independent from one another.
Yes, there is little to no overlap between the points.
The data points in the red square possess error bars that do not overlap. These points are statistically independent from one another.
Compare your answer with the correct one above
Chemotherapy No treatment Surgery and Chemotherapy 2 inches 2 inches 2 inches 2.1 inches 3 inches .05 inches 1.8 inches 5 inches .09 inches 1.4 inches 7 inches .05 inches 1 inch 9 inches .03 inches
The table above shows measurements for tumor size growth over time within three different possible treatment methods. Each tumor was first documented at an initial size of 2 inches. Every month each tumor was measured, for a total of five measurements of each tumor.
Based on the chart above, what conclusion could be drawn about the "no treatment" option?
| Chemotherapy | No treatment | Surgery and Chemotherapy |
|---|---|---|
| 2 inches | 2 inches | 2 inches |
| 2.1 inches | 3 inches | .05 inches |
| 1.8 inches | 5 inches | .09 inches |
| 1.4 inches | 7 inches | .05 inches |
| 1 inch | 9 inches | .03 inches |
The table above shows measurements for tumor size growth over time within three different possible treatment methods. Each tumor was first documented at an initial size of 2 inches. Every month each tumor was measured, for a total of five measurements of each tumor.
Based on the chart above, what conclusion could be drawn about the "no treatment" option?
Based on the data, the only conclusion that can be drawn is the tumor size increases. One might be tempted to draw the conclusion out further and say that some treatment is always better than no treatment; however, that is a circumstantial conclusion based on the individual patient cases, and cannot be concluded from the data shown.
Based on the data, the only conclusion that can be drawn is the tumor size increases. One might be tempted to draw the conclusion out further and say that some treatment is always better than no treatment; however, that is a circumstantial conclusion based on the individual patient cases, and cannot be concluded from the data shown.
Compare your answer with the correct one above
Chemotherapy No treatment Surgery and Chemotherapy 2 inches 2 inches 2 inches 2.1 inches 3 inches .05 inches 1.8 inches 5 inches .09 inches 1.4 inches 7 inches .05 inches 1 inch 9 inches .03 inches
The table above shows measurements for tumor size growth over time within three different possible treatment methods. Each tumor was first documented at an initial size of 2 inches. Every month each tumor was measured, for a total of five measurements of each tumor.
What conclusion CANNOT be reached based on the data shown above?
| Chemotherapy | No treatment | Surgery and Chemotherapy |
|---|---|---|
| 2 inches | 2 inches | 2 inches |
| 2.1 inches | 3 inches | .05 inches |
| 1.8 inches | 5 inches | .09 inches |
| 1.4 inches | 7 inches | .05 inches |
| 1 inch | 9 inches | .03 inches |
The table above shows measurements for tumor size growth over time within three different possible treatment methods. Each tumor was first documented at an initial size of 2 inches. Every month each tumor was measured, for a total of five measurements of each tumor.
What conclusion CANNOT be reached based on the data shown above?
There is not enough information in the data to know that the cancer cells in all three groups grew at the same rate. Cancer cells can grow at different rates depending on size, stage, and other factors.
There is not enough information in the data to know that the cancer cells in all three groups grew at the same rate. Cancer cells can grow at different rates depending on size, stage, and other factors.
Compare your answer with the correct one above
| | G | g | |
| ---- | -- | -- |
| g | Gg | gg |
| g | Gg | gg |
Scientist’s believe they have found the gene accountable for intelligence. The allele “G” is dominant, and the allele “g” is recessive. The intelligence gene is optimally expressed in the homozygous recessive form. The chart above shows the trait in the heterozygous form and the homozygous form. The form “gg” is from the mother, and “Gg” is from the father. The parents want to know what the gene might look like in their child.
What form of the gene expresses optimal intelligence?
| | G | g | | | ---- | -- | -- | | g | Gg | gg | | g | Gg | gg |
Scientist’s believe they have found the gene accountable for intelligence. The allele “G” is dominant, and the allele “g” is recessive. The intelligence gene is optimally expressed in the homozygous recessive form. The chart above shows the trait in the heterozygous form and the homozygous form. The form “gg” is from the mother, and “Gg” is from the father. The parents want to know what the gene might look like in their child.
What form of the gene expresses optimal intelligence?
The prompt states the intelligence gene is "optimally expressed in the homozygous recessive form." Therefore, this is the "gg" form.
The prompt states the intelligence gene is "optimally expressed in the homozygous recessive form." Therefore, this is the "gg" form.
Compare your answer with the correct one above
| | G | g | |
| ---- | -- | -- |
| g | Gg | gg |
| g | Gg | gg |
Scientist’s believe they have found the gene accountable for intelligence. The allele “G” is dominant, and the allele “g” is recessive. The intelligence gene is optimally expressed in the homozygous recessive form. The chart above shows the trait in the heterozygous form and the homozygous form. The form “gg” is from the mother, and “Gg” is from the father. The parents want to know what the gene might look like in their child.
According to the chart above, what are the chances of the child inheriting the optimal form of the gene?
| | G | g | | | ---- | -- | -- | | g | Gg | gg | | g | Gg | gg |
Scientist’s believe they have found the gene accountable for intelligence. The allele “G” is dominant, and the allele “g” is recessive. The intelligence gene is optimally expressed in the homozygous recessive form. The chart above shows the trait in the heterozygous form and the homozygous form. The form “gg” is from the mother, and “Gg” is from the father. The parents want to know what the gene might look like in their child.
According to the chart above, what are the chances of the child inheriting the optimal form of the gene?
The optimal form of the gene is the homozygous reccesive "gg," which has a 50 percent chance of resulting from the parental cross.
The optimal form of the gene is the homozygous reccesive "gg," which has a 50 percent chance of resulting from the parental cross.
Compare your answer with the correct one above