Representing and Interpreting Data
Help Questions
1st Grade Math › Representing and Interpreting Data
Look at the chart below. If we take away 


Explanation
We are starting with 


Look at the chart below. If we take away
Explanation
We are starting with
Look at the chart below. How many birds are there?


Explanation
Birds are show in the last bar. That bar goes up to the number 

Look at the chart below. How many birds are there?
Explanation
Birds are show in the last bar. That bar goes up to the number
Look at the chart below. How many cats are there?


Explanation
Cats are show in the middle bar. That bar goes up to the number 

Look at the chart below. If we add 


Explanation
We are starting with 


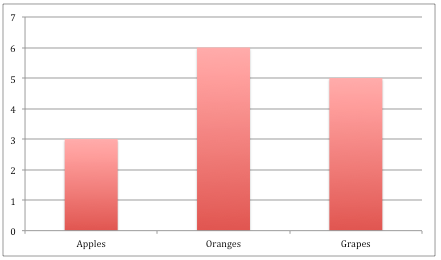
Look at the chart below. How many apples are there?


Explanation
In the chart, apples are shown in the first bar. That bar goes up to the number 

Look at the chart below. How many more grapes are there than apples?


Explanation
There are 


Look at the chart below. How many apples are there?
Explanation
In the chart, apples are shown in the first bar. That bar goes up to the number
Look at the chart below. If we add 


Explanation
We have 


