College Algebra : Graphing Polynomials

Study concepts, example questions & explanations for College Algebra

varsity tutors app store varsity tutors android store

Example Questions

Example Question #1 : Transformations Of Parabolic Functions

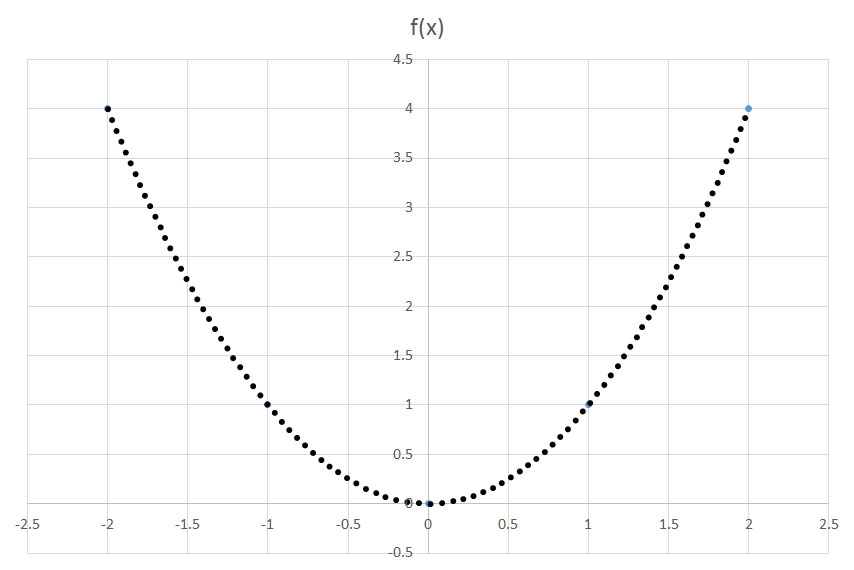
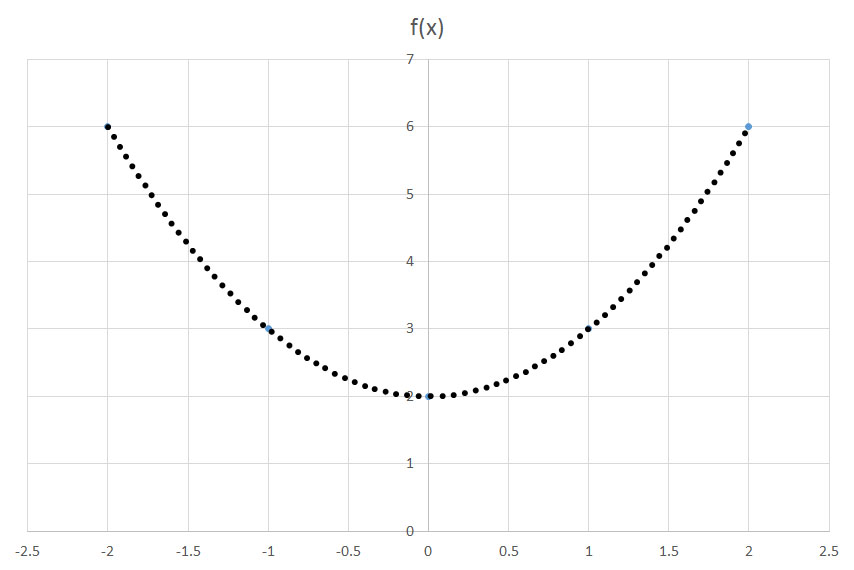
If the function  is depicted here, which answer choice graphs ?

Possible Answers:

C

B

None of these graphs are correct.

Correct answer:
Explanation:

The function  shifts a function f(x) units to the left. Conversely,  shifts a function f(x) units to the right. In this question, we are translating the graph two units to the left.

To translate along the y-axis, we use the function  or .

Example Question #1 : Graphing Polynomials

Which of the following graphs correctly represents the quadratic inequality below (solutions to the inequalities are shaded in blue)?

Possible Answers:

Incorrect3

Incorrect2

Correct

Incorrect4

Incorrect1

Correct answer:

Correct

Explanation:

To begin, we analyze the equation given: the base equation,  is shifted left one unit and vertically stretched by a factor of 2. The graph of the equation  is:

Graph of equation

To solve the inequality, we need to take a test point and plug it in to see if it matches the inequality. The only points that cannot be used are those directly on our parabola, so let's use the origin . If plugging this point in makes the inequality true, then we shade the area containing that point (in this case, outside the parabola); if it makes the inequality untrue, then the opposite side is shaded (in this case, the inside of the parabola). Plugging the numbers in shows:

Simplified as:

Which is not true, so the area inside of the parabola should be shaded, resulting in the following graph:

Correct

Example Question #2 : Graphing Polynomials

How many zeroes does the following polynomial have?

Possible Answers:

Correct answer:

Explanation:

 is a degree 3 polynomial, so we don't have any easy formulas for calculating possible roots--we just have to check individual values to see if they work. We can use the rational root test to narrow the options down. Remember, if we have a polynomial of the form  then any rational root will be of the form p/q where p is a factor of  and q is a factor of . Fortunately in this case,  so we only need to check the factors of , which is -15. Let's start with the easiest one: 1.

 It doesn't work.

If we try the next number up, 3, we get this:

 It worked! So we know that a factor of our polynomial is . We can divide this factor out:


and now we need to see if  has any roots. We can actually solve quadratics so this is easier.

There aren't any real numbers that square to get -5 so this has no roots. Thus,  only has one root.

Example Question #3 : Graphing Polynomials

 is a polynomial function. .

True or false: By the Intermediate Value Theorem,  cannot have a zero on the interval .

Possible Answers:

True

False

Correct answer:

False

Explanation:

As a polynomial function, the graph of  is continuous. By the Intermediate Value Theorem, if  or , then there must exist a value  such that 

Set  and . It is not true that , so the Intermediate Value Theorem does not prove that there exists  such that . However, it does not disprove that such a value exists either. For example, observe the graphs below:

Untitled

Both are polynomial graphs fitting the given conditions, but the only the equation graphed at right has a zero on .

Example Question #4 : Graphing Polynomials

True or false:

The polynomial  has  as a factor.

Possible Answers:

False

True

Correct answer:

True

Explanation:

One way to answer this question is as follows:

Let . By a corollary of the Factor Theorem,  is divisible by  if and only if the sum of its coefficients (accounting for minus symbols) is 0.  has 

as its coefficient sum, so  is indeed divisible by .

Example Question #5 : Graphing Polynomials

True or false:

The polynomial  has  as a factor.

Possible Answers:

False

True

Correct answer:

False

Explanation:

Let . By a corollary of the Factor Theorem,  is divisible by  if and only if the alternating sum of its coefficients (accounting for minus symbols) is 0.

To find this alternating sum, it is necessary to reverse the symbol before all terms of odd degree. In , there is one such terms, the  term, so the alternating coefficient sum is  

,

so  is not divisible by .

Example Question #5 : Graphing Polynomials

 is a polynomial function.  and .

True or false: By the Intermediate Value Theorem,  must have a zero on the interval .

Possible Answers:

False

True

Correct answer:

True

Explanation:

As a polynomial function, the graph of  is continuous. By the Intermediate Value Theorem, if  or , then there must exist a value  such that 

Setting , and looking at the second condition alone, this becomes: If , then there must exist a value  such that  - that is,  must have a zero on . The conditions of this statement are met , since   - and  - so  does have a zero on this interval.

Example Question #7 : Graphing Polynomials

Let  be an even polynomial function with  as a factor. 

True or false: It follows that  is also a factor of .

Possible Answers:

False

True

Correct answer:

True

Explanation:

By the Factor Theorem,  is a factor of a polynomial  if and only if . It is given that  is a factor of , so it follows that .

 is an even function, so, by definition, for all  in its domain, . Setting ; by substitution, . It follows that  is also a factor of , making the statement true. 

Example Question #4 : Graphing Parabolas

Which of the following graphs matches the function ?

Possible Answers:

Graph

Graph3

Graph2

Graph1

Graph4

Correct answer:

Graph

Explanation:

Start by visualizing the graph associated with the function :

Graph5

Terms within the parentheses associated with the squared x-variable will shift the parabola horizontally, while terms outside of the parentheses will shift the parabola vertically. In the provided equation, 2 is located outside of the parentheses and is subtracted from the terms located within the parentheses; therefore, the parabola in the graph will shift down by 2 units. A simplified graph of  looks like this:

Graph6

Remember that there is also a term within the parentheses. Within the parentheses, 1 is subtracted from the x-variable; thus, the parabola in the graph will shift to the right by 1 unit. As a result, the following graph matches the given function  :

Graph

Learning Tools by Varsity Tutors