How to find experimental design in chemistry
Help Questions
ACT Science › How to find experimental design in chemistry
During digestion, the energy in food is converted to energy the body can use. Scientists use calorimetry experiments to measure the calories, or energy, provided by food when it is digested or burned.
The relationship used to find the heat transferred energy ")


In this experiment, food was burned over a Bunsen burner under a can of 200 ml of water. The temperature change of the water and mass change of the food can be used to determine the calories in four different food items.
Table 1 shows the values of the change of mass of the food items, the change in temperature of the water and the energy. Table 2 shows the energy to mass ratio of three of those food items.
Table 1
Roasted Peanut Peanut Cracker Cheese Puff
Water Temp. Initial 23.9 °C 33.2 °C 40.3 °C 53.9 °C
Water Temp. Final 30.0 °C 40.9 °C 55.9 °C 62.8 °C
Food Mass Initial 0.69 g 0.61 g 3.21 g 1.22 g
Food Mass Final 0.38 g 0.21 g 0.91 g 0.48 g
Energy 1.22 Cal 1.54 Cal 3.12 Cal 1.78 Cal
Table 2
Sample Energy to Mass Ratio (Cal/g)
1 1.36
2 3.93
3 2.40
Based on the information in Table 1, what variables must be measured in order to calculate the energy of the food samples?
Change in mass of the food and change in temperature of the water
Change in mass and temperature of the water
Change in temperature of the water alone
Change in mass of the food sample alone
Explanation
Based on the given equation for calculating heat energy, the heat capacity of the water, change of mass of the material, and change in temperature of the material must be measured. However, because the heat capacity of water is consistent, it does not affect the measure of the different calorie measurements. Additionally, because the change in heat of the food samples must approximately equal the change in temperature of the food item due to their proximity, only the change in temperature of the water and change in mass of the food samples needs to be known. Also, this answer is given in the description of the experiment.
Kevin wants to know if a particular kind of chemical fertilizer will help or hinder the growth of his tomato plants. He decides to conduct an experiment in which he grows three plants, one left untreated, one treated with the chemical fertilizer RapidGro and one treated with an organic compost. He records his findings in the charts below, measuring plant height and number of tomatoes over a period of time.
Height of plant (inches):
| Day | No Fertilizer | RapidGro | Compost |
|---|---|---|---|
| 1 | 3 | 3 | 3 |
| 2 | 5 | 6 | 4 |
| 3 | 7 | 9 | 6 |
| 4 | 9 | 12 | 8 |
| 7 | 15 | 21 | 14 |
| 10 | 16 | 21 | 19 |
| 14 | 18 | 18 | 21 |
Number of tomatoes:
| Day | No fertilizer | RapidGro | Compost |
|---|---|---|---|
| 1 | 0 | 0 | 0 |
| 2 | 1 | 2 | 1 |
| 3 | 1 | 3 | 2 |
| 4 | 2 | 4 | 3 |
| 7 | 4 | 7 | 5 |
| 10 | 6 | 7 | 6 |
| 14 | 6 | 4 | 7 |
On the fourteenth day Kevin picks the biggest tomato from each plant and record its dimensions, as well as other information, which is found below.
Tomato 1 (no fertilizer): 
Tomato 2 (RapidGro): 
Tomato 3 (compost): 
Which plant is the control?
The plant without fertilizer or compost
The plant with chemical fertilizer
The plant with compost
There is no control
Explanation
In an experiment, the control is what does not change or remains untreated by the variables being tested, in this case the fertilizer or compost.
There are two types of forces that occur with all substances on Earth. Intramolecular forces occur between atoms in a molecule, while intermolecular forces occur between neighboring molecules. Intermolecular forces can be dipole-dipole forces, hydrogen bonding, or London dispersion forces.
Professor 1:
Water molecules represent an example of hydrogen bonding due to the attraction between the hydrogen atoms and the oxygen atoms in the molecule. This strong dipole-dipole occurs due to lone pairs present on such atoms as Fluorine, Nitrogen, and Oxygen, which are able to pair more closely to the hydrogen atom in another nearby molecule. Water can be present in a solid, liquid, or gaseous state on Earth depending on the competition between the strength of intermolecular bonds and the thermal energy of the system. In 1873, a Dutch scientist, Van der Waals derived an equation that included both the force of attraction between the particles of a gas and the volume of the particles at high pressures. This equation led to a better fit for experimental data than the Ideal Gas Law.
Professor 2:
Water is the only substance on Earth that we routinely encounter as a solid, liquid, and gas. At low temperatures, the water molecules lock into a rigid structure, but as the temperature increases, the average kinetic energy of the water molecules increases and the molecules are able to move more creating its other natural states of matter. The higher the temperature, the more likely water is to be a gas. Water is proof of the kinetic theory, which assumes that there is no force of attraction between the particles of the gas state. The best fit for experimental data involving water in a gaseous form is found by using the Ideal Gas Law, since there is no interaction between the gaseous molecules. This law accounts for all of the forces that occur with gases on Earth.
Which of the following experiments could solve the debate between the two professors?
An experiment involving one or more gases where the actual experimental results found are compared with the results found by both equations.
An experiment that measures the kinetic energy in various samples of water.
An experiment that tests various gases against the values found in the Ideal Gas Law.
An experiment testing how strong the hydrogen bonding present in various samples of water in different states of matter are and comparing that to the kinetic energy present.
Explanation
The main argument between the two professors is regarding which equation- Van der Waals' or the Ideal Gas Law- is the most appropriate way to estimate experimental data.
An experiment that would resolve the conflict would be one that sets up a scenario involving one or more gases and compares the actual experimental results found with the results found by both equations. This way the equation that found results that were closer to the actual results measured in the experiment would be considered the "best fit" to use.
Naturally occurring water in lakes and reservoirs used as sources for drinking water feature a variety of dissolved minerals such as magnesium, sodium, and calcium. Water treatment plants must closely monitor the levels of these minerals to ensure they do not exceed unsafe levels. An experiment carried out by a scientist at a water treatment plant are described below.
Experiment 1:
A common way to determine the concentration of a particular chemical is by titration. In this titration, 10mL of the treated water sample was placed in a flask as shown below in Figure 1. A buret, (a special funnel with volume markings on the side and a knob on the bottom to control how much of the substance in the buret is dispensed) was placed above the flask as shown in Figure 1. It was filled with 50mL of a 20ppm (parts per million) solution of EDTA, a chemical that can react with magnesium to chemically remove it from the water. An indicator (a substance that changes color to indicate a chemical change) was also placed into the flask; this indicator appears purple in water solutions containing magnesium, and blue in water solutions without magnesium. The buret was used to dispense EDTA solution until enough EDTA had been added to the purple magnesium-containing water solutions to remove all the magnesium and turn the solution blue. The volume, in milliliters, of EDTA solution added to each of five water samples is recorded in Table 1.

Figure 1

Why does the researcher use the buret?
This is the best way to control exactly the amount of EDTA solution added to be able to calculate an accurate concentration of magnesium
This way the researcher doesn't have to add the EDTA titrant manually
This is a good way to provide a control for the experiment
The EDTA solution must be kept separate from the water solution
Explanation
It states in the introduction that a buret is a good way to control the exact amount of EDTA titrant added, and as we saw in other questions, the amount of titrant added is how we calculate magnesium concentrations.
Clock reactions are chemical interactions that exhibit a physical change periodically over a given time interval. Many of these reactions involve iodine, the most famous being the Chlorine Dioxide-Iodine-Malonic Acid reaction. These reactions can be quite startling as flasks of colorless liquid periodically turn dark blue and then resolve back to their original colorless state. Even more striking, they seem to alternate between being colorless and blue several times. The term "clock reaction" is derived from the fact that the time at which these sudden changes occur can be predicted.
Beyond performing these reactions in a well stirred beaker, there are two other notable ways to conduct experiments with clock reactions that demonstrate interesting properties of these reactions. The first is in a continuous flow stirred tank reactor (CSTR). In a CSTR, the reactants are introduced at a continuous rate while the volume of liquid in the reactor is kept constant by siphoning off excess fluid. The result of this process is that one can maintain the ideal conditions in which the reaction may occur over time and restricts the buildup of excess product or reactant that would otherwise make the oscillations of the reactions decay. In a CSTR, clock reactions can be maintained switching predictably from colorless to blue, for example, for far longer than in a simple beaker.
The second way to conduct a clock reaction experiment is in a tank with no stirring at all. This allows the reactants to interact heterogeneously, or without being thoroughly mixed. When this occurs, we can get some parts of the tank that are one color and other parts that are another color. This means that we can observe two different stages of the reaction in one vessel. The patterns that this makes are called Turing patterns, named by the great computer scientist Alan Turing. Turing predicted that the heterogeneous mixing of chemicals called morphogens in complex organisms were responsible for biological pattern formation like spots on a leopard, stripes on a zebra, or patterns on a tropical fish. The existence of such patterns and chemicals has since been confirmed and clock reactions are often used to study these types of Turing patterns.
Given that different patterns happen when different concentrations of the reactants interact with each other, which of the following would NOT be a useful experimental variable in an experiment designed to explore the mechanism and dynamics of different patterns of chemicals in clock reactions?
Time
The size of the reaction tank
The initial concentration of reactants
The volume of water in the tank before adding reactants
The depth of the tank
Explanation
Since concentration is important to the pattern formation and the reactions happen over and over again in time, it seems that any answer that involves changing either the concentration of reactants directly or indirectly (via the volume of the reaction vessel into which the reactants are placed) is a valid experimental variable. The answer that would not be the most helpful is time because we know these reactions proceed over and over again in time.
A brilliant but underpaid high school chemistry teacher, together with his former student, manufactures a chemical compound, which they sell for a large mark-up. Their set of reactions are given below:
(1) A + B + C + acid --> D
(2) D --> intermediate
(3) Intermediate --> E
(4) E + acid --> X
His student notes the following observations:
Observation 1) If a greater amount of B and C are used in the reaction, this yields no increased amount of product D.
Observation 2) At any given point, D, the intermediate, and E may co-exist in equal proportions. However, at higher temperatures, higher proportions of product E are noted.
Observation 3) The addition of a strong base can reverse reaction 4.
If reagent A was the limiting reagent, how might the student determine this?
Plot varied amounts of A used against amount of D produced, holding B, C, and acid in excess.
Hold amount of A constant and increase amounts of B, C, and acid. Then plot againt amount of D produced.
Construct a table measuring amount of D produced at regular time intervals while holding A, B, and C constant.
Construct a table measuring amount of D produced at regular time intervals while holding A constants and varying amount of B and C produced.
Explanation
The definition of limiting reagent means that the amount of product produced is directly correlated to the amount of limiting reagent available. While the option saying, "Hold amount of A constant and increase amounts of B, C, and acid. Then plot againt amount of D produced," may show that increased B, C, and acid has no effect in increasing the amount of D produced, it does not show that increasing A does. In contrast, the option holding B, C, and acid in excess, while increasing A, may show a direct increase in the amount of D produced. In this setting, there is no indication that time will be helpful in determining the role of A; rather, only using varied amounts of A while holding B, C, and acid in excess, can help determine if A, is in fact, the limiting reagent.
Naturally occurring water in lakes and reservoirs used as sources for drinking water feature a variety of dissolved minerals such as magnesium, sodium, and calcium. Water treatment plants must closely monitor the levels of these minerals to ensure they do not exceed unsafe levels. An experiment carried out by a scientist at a water treatment plant are described below.
Experiment 1:
A common way to determine the concentration of a particular chemical is by titration. In this titration, 10mL of the treated water sample was placed in a flask as shown below in Figure 1. A buret, (a special funnel with volume markings on the side and a knob on the bottom to control how much of the substance in the buret is dispensed) was placed above the flask as shown in Figure 1. It was filled with 50mL of a 20ppm (parts per million) solution of EDTA, a chemical that can react with magnesium to chemically remove it from the water. An indicator (a substance that changes color to indicate a chemical change) was also placed into the flask; this indicator appears purple in water solutions containing magnesium, and blue in water solutions without magnesium. The buret was used to dispense EDTA solution until enough EDTA had been added to the purple magnesium-containing water solutions to remove all the magnesium and turn the solution blue. The volume, in milliliters, of EDTA solution added to each of five water samples is recorded in Table 1.
Figure 1
A new EDTA titration solution is prepared with 40ppm EDTA. Approximately how much EDTA titration solution should the scientist expect to use to titrate a 10mL sample of the same water?


Explanation
The equation in question 1, shown below, states that ppm of magnesium is given by multiply the volume of titration solution used by the ppm of EDTA in the titration solution, all divided by the volume of water in the sample.

By filling in the known 60ppm magnesium in the water sample as was determined in question 1, and replacing the original 20ppm concentration of EDTA in the solution with 40ppm, we see that:


Alternatively, we see that because the concentration has doubled, half as much will be used to remove the magnesium. As an average of 30mL was used in the original experiment, we can see that 15mL will now be used.

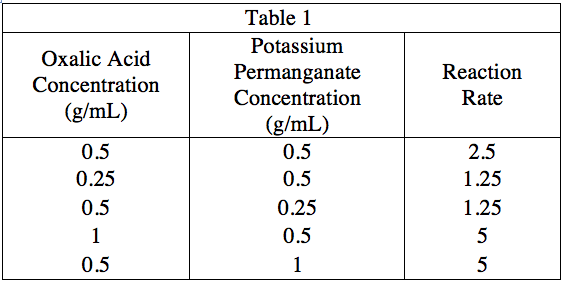
The rate of a reaction is defined as the rate at which the products of a reaction are produced. A researcher wants to investigate the rate of reaction of the combustion of theoretical compound 

The results of the experiment are shown in the table below. The brackets (\[\]) indicate concentration measured in mol/L.

Which of the following is the best explanation for the repetition of trial 1 during the experiment?
Repeating trial 1 acted as a control.
Repeating trial 1 did not serve any purpose.
Repeating trial 1 ensured the original results of trial 1 were due to chance.
Repeating trial 1 caused the reactions measured in trials 2 and 3.
Repeating trial 1 revealed that the results of trials 2 and 3 were due to chance.
Explanation
This question is a bit tricky because it can be easy to get distracted with the other answers. If you go back into the passage, you see that the researcher expressed concern that the lab's conditions could change and therefore could affect measurements. Therefore, repeating trial 1 during the experiment was simply a control to account for possible changes in the lab that could affect the results. As it states in the passage, the researcher's concerns were unfounded, and repeating trial 1 was indeed unnecessary. However, that does notmean that it did not serve the purpose of proving to the researcher that the conditions of the lab stayed steady throughout the experiment—which is well worth the additional effort.
A student wanted to study the kinetics, or rates of a chemical reaction based on the concentrations of its reactants and products, of the reaction shown below.
}+2KMnO_4_{(aq)}+3H_2SO_4_{(aq)}\rightarrow")
}+2MnSO_4_{(aq)}+K_2SO_4_{(aq)}+8H_2O_{(l)}")
This reaction is easy to monitor using a spectrophotometer, which measures how much light of a particular wavelength is absorbed by a solution. The deep purple potassium permanganate, or 

Experiment 1:
The student constructed a standard curve, or a graph of the absorbance of solutions of varying concentrations of potassium permanganate, to quantify the relationship between concentration and absorbance. To prepare five sample of increasing concentration, he labeled five test tubes A, B, C, D, and E, weighed out 0.1, 0.2, 0.3, 0.4, and 0.5 grams of potassium permanganate into each, respectively, and added 1 milliliter (mL) of water to each test tube to dissolve. Then, he used the spectrophotometer to determine the absorbance at 550 nm of each sample. The data is graphed in Figure 1 below.
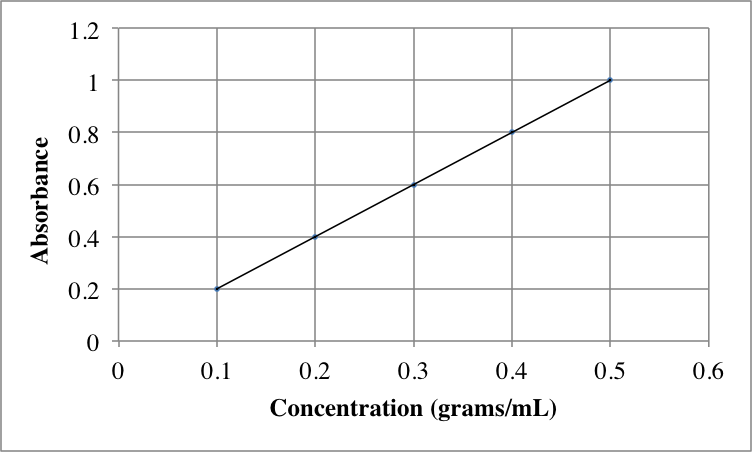
Figure 1
Experiment 2:
The student then studied potassium permanganate in the presence of oxalic acid, 
A scientific relationship, known as Beer's Law, mathematically correlates absorbance to concentration via the following equation:

where 


Explanation
You can solve for 


 = E(0.1)")
By dividing, we can see that 
Alternatively, you may view the equation 


The Environmental Protection Agency compiled the following information about heavy metals in drinking water. Heavy metals are toxic, and thus must be monitored very closely. All amounts are given in parts per billion (ppb), a common measurement of concentration for trace contaminants. Figure 1 shows total heavy metal contamination in each city as a makeup of various percentages of specific contaminants. Figure 2 shows specific amounts of contaminants (with the same color coding) in ppb as well as total contamination level in ppb.

Figure 1

Figure 2
A scientist wants to publish a paper about water treatment standards in the United States. Which figure is a better figure to include in her report?
Figure 2, because it shows both relative amounts of each contaminant in various cities, and also because it shows numerical amounts of each contaminant in ppb.
Figure 1, because it shows the numerical amounts of each contaminant in ppb, a useful metric.
Figure 2, because it shows which cities have the most total contamination.
Figure 1, because it shows percent contamination most clearly, and this is the most important piece of data for contamination studies.
Explanation
Figure 2 shows the relative amounts of each contaminant. For example, you can see that Fargo clearly has more mercury contamination, shown in green, than Boston, by comparing the relative heights of the green part of the two bars. The figure also shows numerical amounts of contaminant in ppb on the y-axis. We can see the amount of each contaminant in each city in ppb or the total amount of contamination in ppb.
Figure 1 shows relative contaminant amounts as a percentage of the total of each city's total contamination. It gives no data whatsoever about numerical parts per billion contaminant concentrations. This second type of information is probably more important for scientists to truly understand the degree of contamination in each of these cities.
While Figure 2 does show which cities have the most total contamination, it is not the sole reason that Figure 2 is the more useful figure. The other statement about Figure 2 is a more complete answer.
It is true that Figure 1 shows percent contamination more clearly than Figure 2. However, as Figure 2 imparts more information in total, including percentage information, it is more useful. Additionally, percent contamination of a total wherein the totals for each city differ does not give a lot of information that can be compared city to city.