Organize, Represent, and Interpret Data: CCSS.MATH.CONTENT.1.MD.C.4 - 1st Grade Math
Card 0 of 192
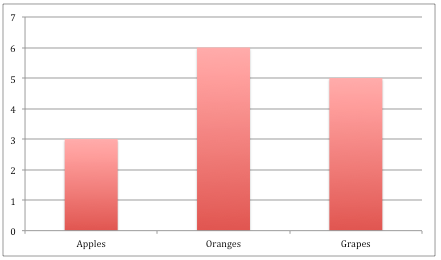
Look at the chart below. How many oranges are there?
Look at the chart below. How many oranges are there?
In the chart, oranges are shown in the second bar. That bar goes up to the number  , which means there are
  oranges.
In the chart, oranges are shown in the second bar. That bar goes up to the number
Compare your answer with the correct one above
Look at the chart below. How many grapes are there?
Look at the chart below. How many grapes are there?
In the chart, grapes are shown in the last bar. That bar goes up to the number  , which means there are
  grapes.
In the chart, grapes are shown in the last bar. That bar goes up to the number
Compare your answer with the correct one above
Look at the chart below. What is there the most of?

Look at the chart below. What is there the most of?
There are  pens,
pens,  pencils, and
  markers.
  is the biggest number, which means there are more pencils than pens or markers.
There are
Compare your answer with the correct one above
Look at the chart below. What is there the least of?
Look at the chart below. What is there the least of?
There are  pens,
pens,  pencils, and
  markers.
  is the smallest number, which means there are less pens than pencils or markers.
There are
Compare your answer with the correct one above
Look at the chart below. What is there the most of?
Look at the chart below. What is there the most of?
There are  oranges,
  grapes, and
  apples.
  is the biggest number, so there are more oranges than grapes or apples.
There are
Compare your answer with the correct one above
Look at the chart below. What is there the least of?
Look at the chart below. What is there the least of?
There are  oranges,
  grapes, and
  apples.
  is the smallest number, which means there are less apples than grapes and oranges.
There are
Compare your answer with the correct one above
Look at the chart below. How many apples are there?
Look at the chart below. How many apples are there?
In the chart, apples are shown in the first bar. That bar goes up to the number  , which means there are
  apples.
In the chart, apples are shown in the first bar. That bar goes up to the number
Compare your answer with the correct one above
Look at the chart below. How many more oranges are there than apples?
Look at the chart below. How many more oranges are there than apples?
There are  oranges and
  apples. To find the difference we subtract.

There are
Compare your answer with the correct one above
Look at the chart below. How many more oranges are there than grapes?
Look at the chart below. How many more oranges are there than grapes?
There are  oranges and
  grapes. To find the difference we subtract.

There are
Compare your answer with the correct one above
Look at the chart below. How many more grapes are there than apples?
Look at the chart below. How many more grapes are there than apples?
There are  grapes and
  apples. To find the difference we subtract.

There are
Compare your answer with the correct one above
Look at the chart below. If we add  more apples to our
  apples, how many more apples will we have?
Look at the chart below. If we add
We are starting with  apples and we are going to add
  more apples, which means we will have
  apples.

We are starting with
Compare your answer with the correct one above
Look at the chart below. If we take away  oranges, how many oranges will we have left?
Look at the chart below. If we take away
We are starting with  oranges and we are taking
  away, which means we are subtracting.

We are starting with
Compare your answer with the correct one above
Look at the chart below. If we add  grapes, how many grapes will we have?
Look at the chart below. If we add
We are starting with  grapes. If we add
  more grapes we will have
  grapes.

We are starting with
Compare your answer with the correct one above
Look at the chart below. If we add  more orange, how many oranges will we have?
Look at the chart below. If we add
We have  oranges. If we add
  more orange we will have
  oranges.


We have
Compare your answer with the correct one above
Look at the chart below. What is there the most of?

Look at the chart below. What is there the most of?
The bar for spoons goes up to  , the bar for forks goes up to
  , and the bar for knives goes up to
  .
.  is our biggest number, which means there are more spoons than forks or knives.
The bar for spoons goes up to
Compare your answer with the correct one above
Look at the chart below. What is there the least of?
Look at the chart below. What is there the least of?
The bar for spoons goes up to  , the bar for forks goes up to
  , and the bar for knives goes up to
  .
.  is our smallest number, which means there are less forks than spoons or knives.
The bar for spoons goes up to
Compare your answer with the correct one above
Look at the chart below. How many forks are there?
Look at the chart below. How many forks are there?
In the chart, forks are show in the first bar. The bar goes up to the number  which means there are
  forks.
In the chart, forks are show in the first bar. The bar goes up to the number
Compare your answer with the correct one above
Look at the chart below. How may spoons are there?
Look at the chart below. How may spoons are there?
In the chart, the spoons are show in the middle bar. That bar goes up to the number  which means there are
  spoons.
In the chart, the spoons are show in the middle bar. That bar goes up to the number
Compare your answer with the correct one above
Look at the chart below. How many knives are there?
Look at the chart below. How many knives are there?
In the chart, the knives are show in the last bar. The bar goes up to the number  which means there are
  knives.
In the chart, the knives are show in the last bar. The bar goes up to the number
Compare your answer with the correct one above
Look at the chart below. How many more spoons are there than forks?
Look at the chart below. How many more spoons are there than forks?
There are  spoons and
  forks. To find the difference we subtract.

There are
Compare your answer with the correct one above