ISEE Middle Level (grades 7-8) Quantitative Reasoning
Help Questions
ISEE Middle Level Quantitative Reasoning › ISEE Middle Level (grades 7-8) Quantitative Reasoning
Find the decimal equivalent of 


Explanation
To solve, divide:

Another way to solve is to reduce the fraction by removing the greatest common factor.

Eight over ten, or eight-tenths, is equal to 
Answer:

Annie has a piece of wallpaper that is 


Explanation
This problem asks us to calculate the amount of space that the wallpaper will cover. The amount of space that something covers can be described as its area. In this case area is calculated by using the formula


Solve:


Explanation
First, find the square root:

Then, solve:

Answer:


Which is greater?
(A)

(B)

(B) is greater
(A) is greater
(A) and (B) are equal
It is impossible to determine which is greater from the information given
Explanation

 = 91 \div (-7)")


 = 72 \div (-6)")


Therefore 
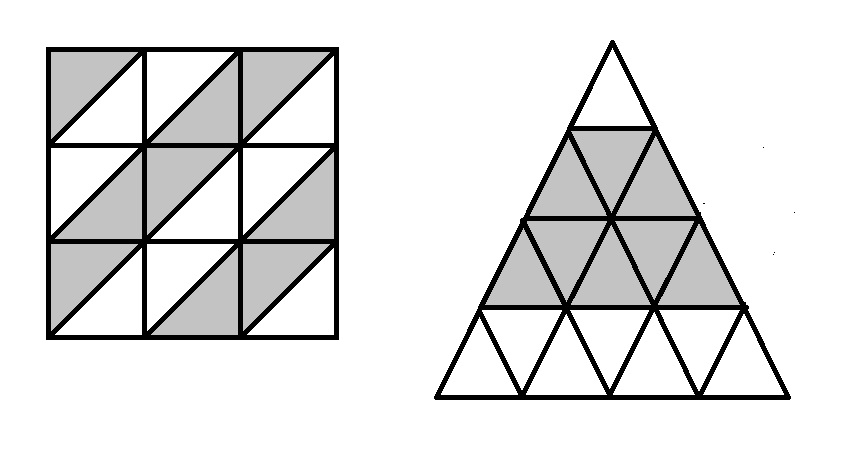
The square and the triangle in the above diagram are both equally divided. Which is the greater quantity?
(a) The fraction of the square that is shaded
(b) The fraction of the triangle that is shaded
(a) and (b) are equal
(b) is the greater quantity
(a) is the greater quantity
It is impossible to determine which is greater from the information given
Explanation
The square is divided into eighteen triangles of equal size and shape; nine are shaded, so the fraction of the square that is shaded is

The triangle is divided into sixteen triangles of equal size and shape; eight are shaded, so the fraction of the square that is shaded is

The fractions are equal.
What is the area of the figure below?


Explanation
To find the area of the figure above, we need to slip the figure into two rectangles.

Using our area formula, 


To find our final answer, we need to add the areas together.

The ratio of the perimeter of one square to that of another square is 


Explanation
For the sake of simplicity, we will assume that the second square has sidelength 1; Then its perimeter is 

The perimeter of the first square is 

^{2} =\frac{49}{16}")
The ratio of the areas is therefore 
A rectangular postage stamp has a width of 3 cm and a height of 12 cm. Find the area of the stamp.


Explanation
A rectangular postage stamp has a width of 3 cm and a height of 12 cm. Find the area of the stamp.
To find the area of a rectangle, we must perform the following:

Where l and w are our length and width.
This means we need to multiply the given measurements. Be sure to use the right units!

And we have our answer. It must be centimeters squared, because we are dealing with area.
Multiply the following:


Explanation
To multiply fractions, we will multiply the numerators together, then we will multiply the denominators together. Note that we do NOT need to find a common denominator.
So, in the problem

We will first write 18 as a fraction. We know that whole numbers can be written as a fraction over 1. So, we get

Now, before we multiply, we can simplify to make things easier. The 3 and the 18 can both be divided by 3. We get

Now, we can multiply straight across. We get


Solve the following:


Explanation
To multiply equations, we will multiply the numerators together, then we will multiply the denominators together. So, we get


