Grade 7
Help Questions
7th Grade Math › Grade 7
Solve:


Explanation
We know the following information:

However, the 
- A negative number multiplied by a positive number will always equal a negative number
- A negative number multiplied by a negative number will always equal a positive number
Thus,

Use the number line provided to help solve the following problem:


Explanation
In order to solve this problem, we need to start at 

Next, we have 

")
")

The orange arrow moved 


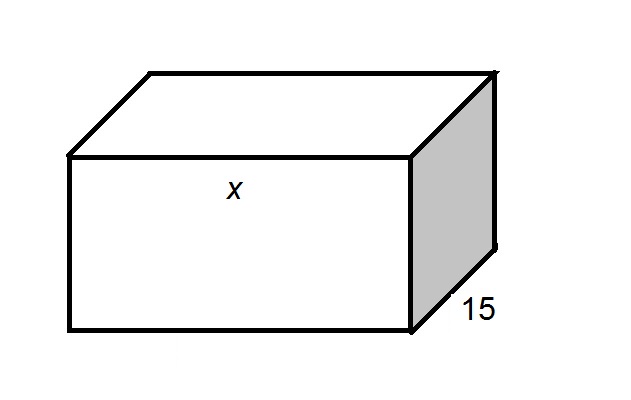
The above diagram shows a rectangular solid. The shaded side is a square. In terms of 


Explanation
A square has four sides of equal length, as seen in the diagram below.
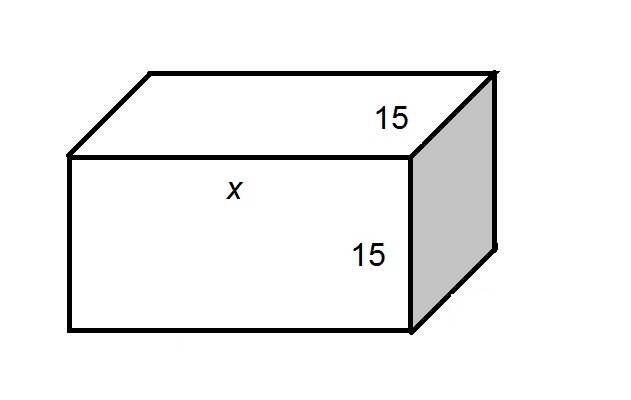
The volume of the solid is equal to the product of its length, width, and height, as follows:

For the equation provided, what value, when substituted for 


Explanation
In order to answer this question, we can solve for 


We can subtract 


Use the number line provided to help solve the following problem:


Explanation
In order to solve this problem, we need to start at 

Next, we have 


The orange arrow moved 


Use the number line provided to help solve the following problem:


Explanation
In order to solve this problem, we need to start at 

Next, we have 


The orange arrow moved 


Solve:
}{-2(-2-2)}")


Explanation
When solving this problem remember our orders of operation, or PEMDAS.
PEMDAS stands for parentheses, exponents, multiplication/division, and addition/subtraction. When you have a problem with several different operations, you need to solve the problem in this order and you work from left to right for multiplication/division and addition/subtraction.
Evaluate the quantities inside the parentheses first.
}{-2(-2-2)}")
}{-2(-4)}")

A bag contains 


Explanation
The probability (p) is equal to the number of a specific event (purple marbles) divided by the total number of events. The probability of NOT p (called q) is equal to 


The owner of a zoo wants to find out which animal exhibit is the most popular. The owner decided to take a random sample of the zoo's visitors to find out which exhibit was the visitor's favorite. Out of the 

What inference can be made based on the results shown in the provided table?

The Panda Exhibit and the Gorilla Exhibit are the top two most popular exhibits
The Panda Exhibit and the Gibbons Exhibit are the top two most popular exhibits
The Gorilla Exhibit and the Gibbons Exhibit are the top two most popular exhibits
No inference can be made based on this data
Explanation
We can use data from a random sample to make inferences about a population. In this case, our population is all of the visitors of the zoo on Friday, and the random sample is the 
Based on our answer choices, we are making an inference about which two animal exhibits are the most popular. The pandas received the most votes out of the owner's pole, followed by the gorillas; thus, we can infer—based on these results—that the Panda Exhibit and the Gorilla Exhibit are the two most popular exhibits at the zoo.
In a dice game, what is the probability of rolling a factor of 5 on a six-sided die?


Explanation
To find the probability of an event, we will use the following formula:

Now, given the event of rolling a factor of 5, we can calculate the following.

because there are 2 factors of 5 on a dice:
- 1
- 5
We can also calculate the following.

because there are 6 different possible numbers we can roll on a dice:
- 1
- 2
- 3
- 4
- 5
- 6
Knowing this, we can substitute into the formula. We get


Therefore, the probability of rolling a factor of 5 on a dice is 