College Comparison
University of Iowa vs University of Pittsburgh-Pittsburgh Campus
Compare acceptance rates, costs, test scores, graduation rates, and more to find your best fit.
At a Glance
Type
Public
Public
Location
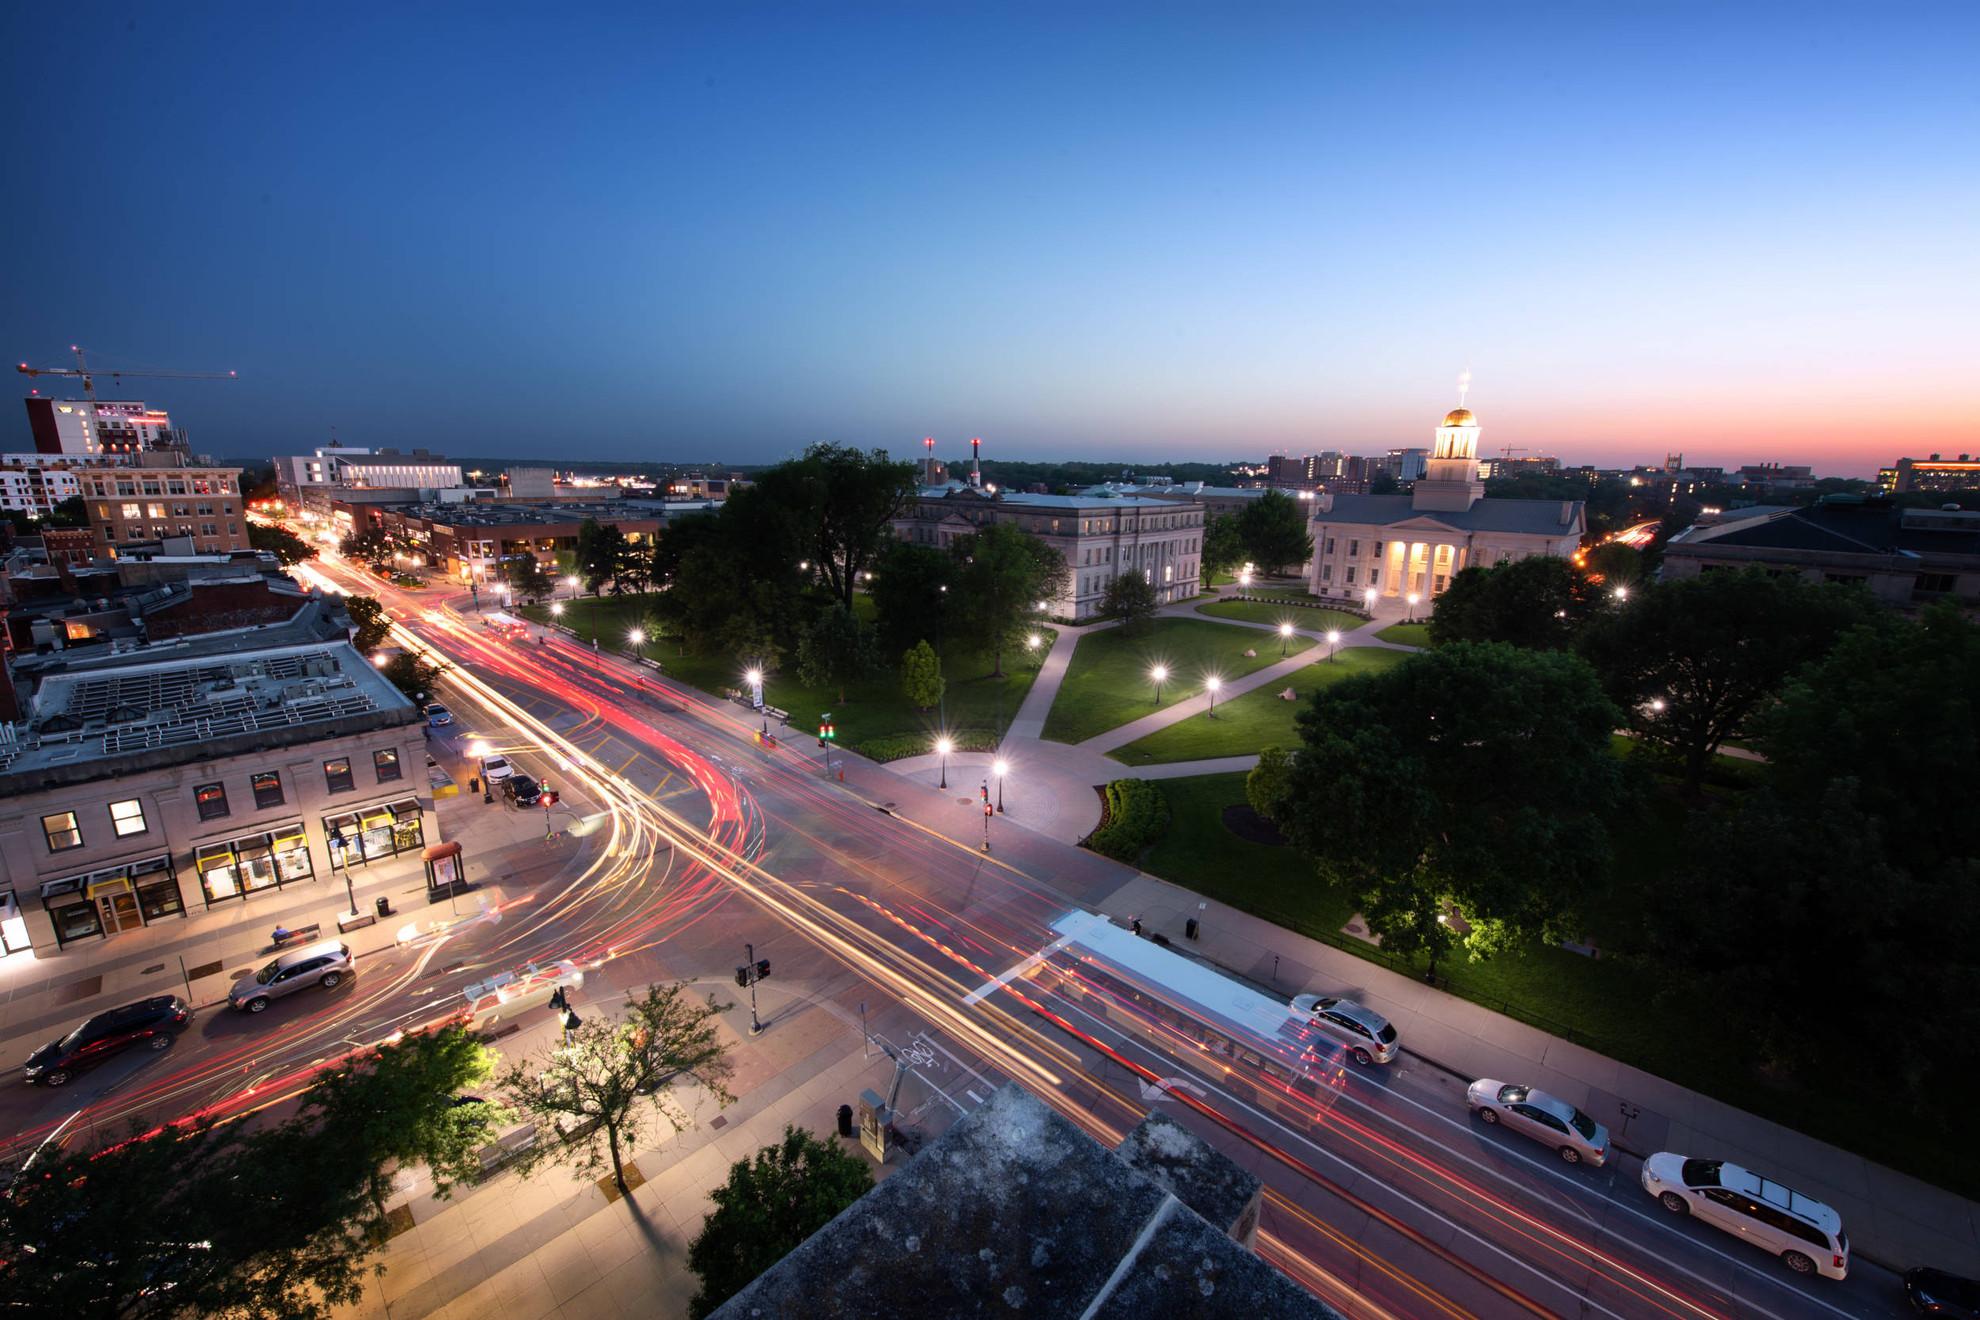
Iowa City, IA
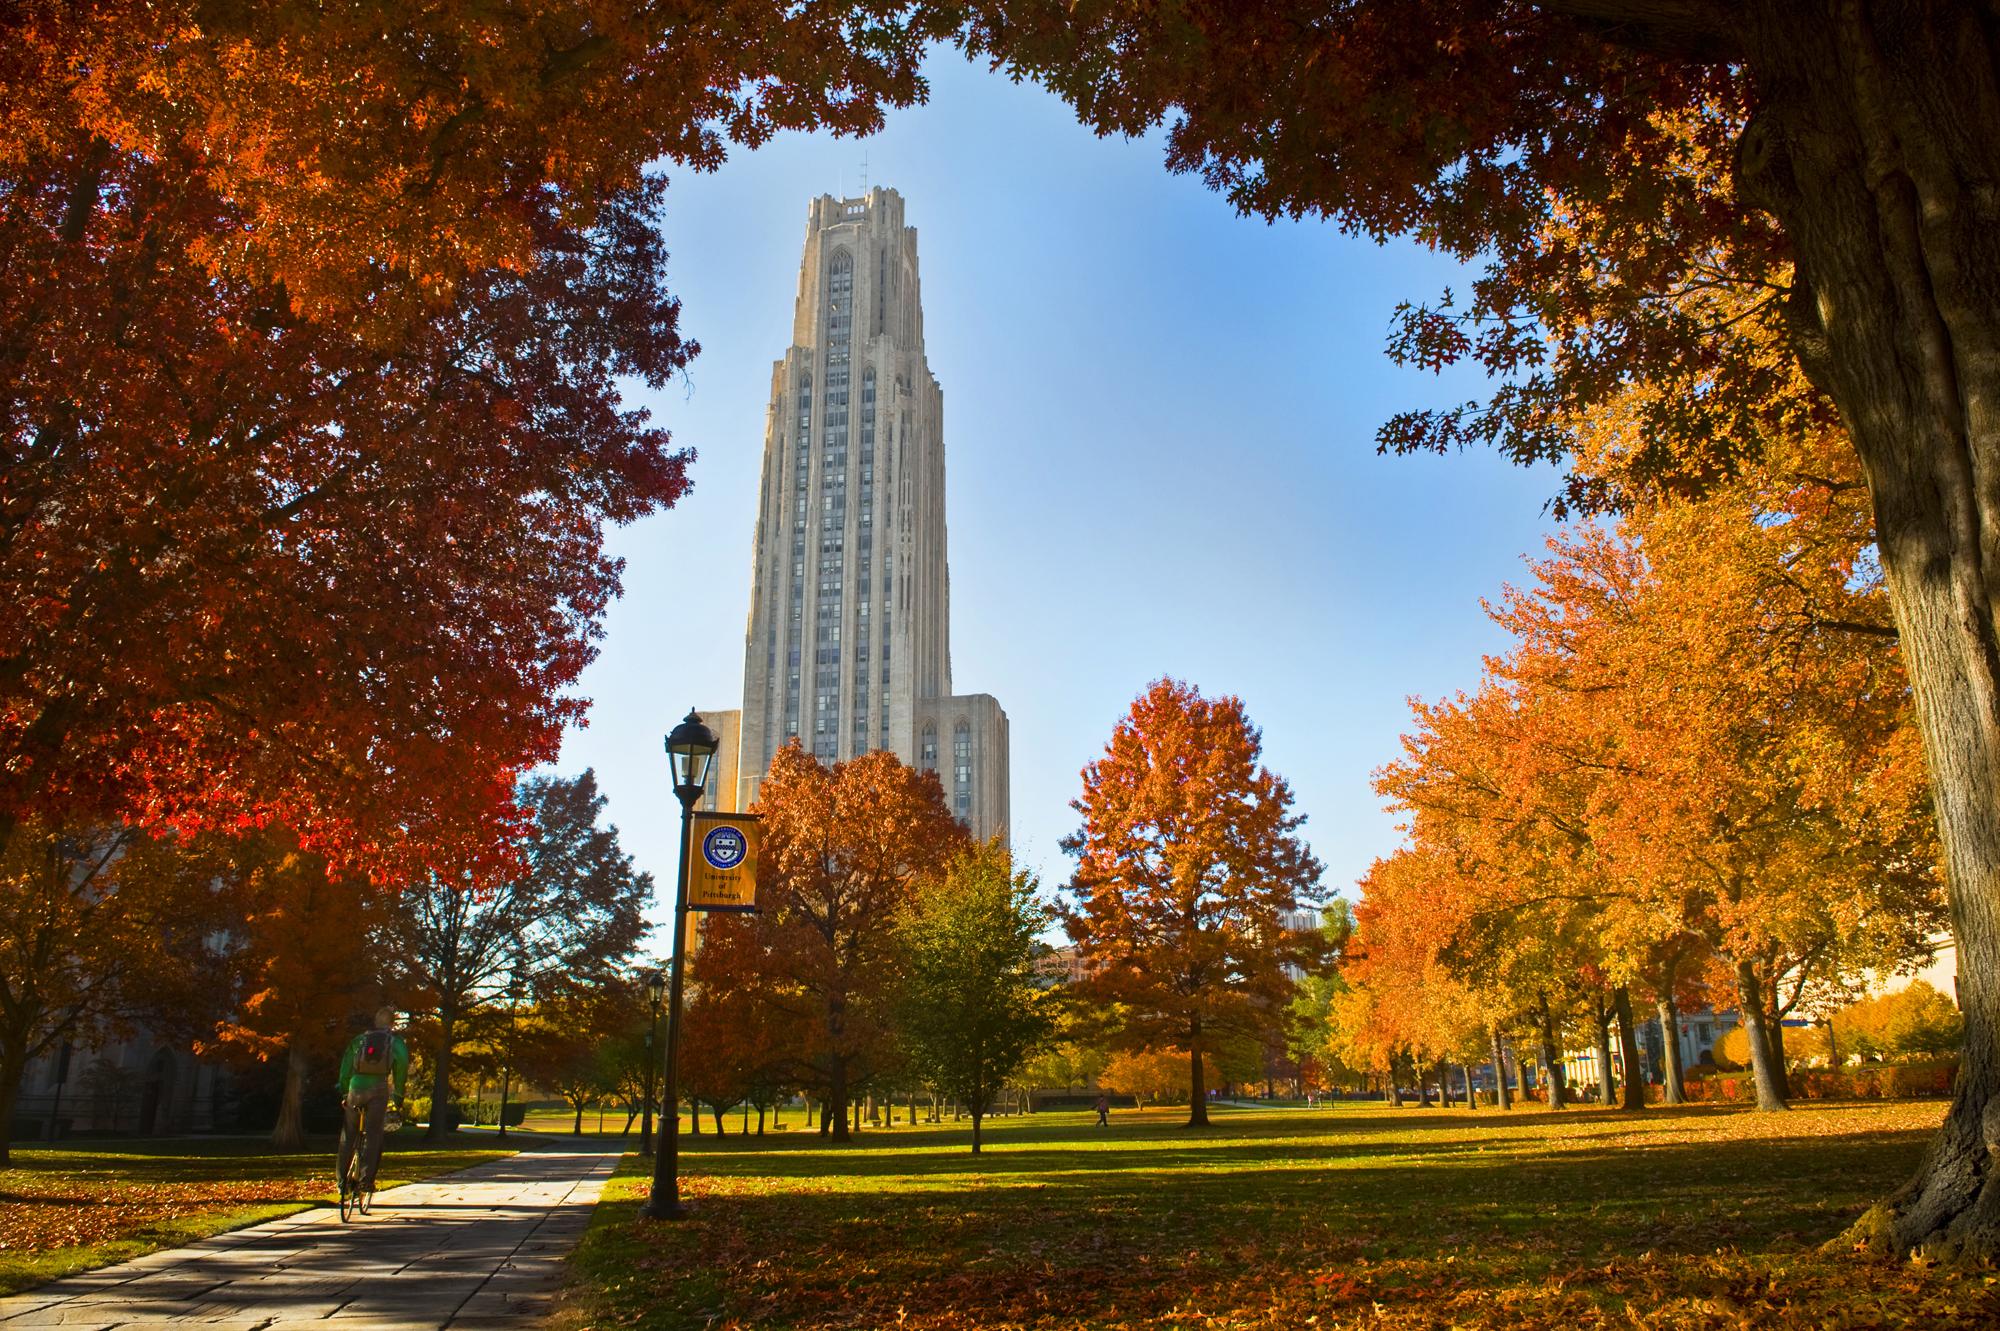
Pittsburgh, PA
Total Enrollment
30,779
35,724
Undergrad Enrollment
22,738
25,900
Student-Faculty Ratio
16:1
13:1
NCAA Athletics
Division I · FBS
—
Admissions
Acceptance Rate
83.6%
58.1%
Average GPA
3.8
3.89
SAT Range
1130–1330
1280–1460
ACT Range
21–28
29–33
Test Policy
Optional
Optional
Application Fee
$40
$55
Total Applicants
27,770
60,898
Academics & Faculty
Full-Time Faculty
2,536
4,813
Women Faculty
45%
47%
Research Spending
$437M
$625M
Offers Online Degree
Yes
Yes
Student Body
Women
56%
58%
Men
44%
42%
White
72%
60%
Black / African American
3%
6%
Hispanic / Latino
8%
6%
Asian
5%
12%
International
5%
9%
Cost & Value
Sticker Price
$21,631
$33,380
Total Cost of Attendance
$29,219
$39,156
Avg Net Price
$20,121
$24,338
In-State Tuition
$8,711
$19,760
Out-of-State Tuition
$30,674
$36,000
Room and Board
$12,920
$13,620
Percent Receiving Aid
76.0%
53.0%
Avg Grant Amount
$9,865
$16,494
Outcomes
4-Year Graduation Rate
56.0%
70.0%
6-Year Graduation Rate
74.0%
84.0%
8-Year Graduation Rate
75.0%
84.0%
Retention Rate
90.0%
92.0%
Employment Rate
79.7%
73.1%
10 Year Median Earnings
$64,762
$66,125
Type
Public
Public
Location
Iowa City, IA
Pittsburgh, PA
Total Enrollment
30,779
35,724
Undergrad Enrollment
22,738
25,900
Student-Faculty Ratio
16:1
13:1
NCAA Athletics
Division I · FBS
—
Acceptance Rate
83.6%
58.1%
Average GPA
3.8
3.89
SAT Range
1130–1330
1280–1460
ACT Range
21–28
29–33
Test Policy
Optional
Optional
Application Fee
$40
$55
Total Applicants
27,770
60,898
Full-Time Faculty
2,536
4,813
Women Faculty
45%
47%
Research Spending
$437M
$625M
Offers Online Degree
Yes
Yes
Women
56%
58%
Men
44%
42%
White
72%
60%
Black / African American
3%
6%
Hispanic / Latino
8%
6%
Asian
5%
12%
International
5%
9%
Sticker Price
$21,631
$33,380
Total Cost of Attendance
$29,219
$39,156
Avg Net Price
$20,121
$24,338
In-State Tuition
$8,711
$19,760
Out-of-State Tuition
$30,674
$36,000
Room and Board
$12,920
$13,620
Percent Receiving Aid
76.0%
53.0%
Avg Grant Amount
$9,865
$16,494
4-Year Graduation Rate
56.0%
70.0%
6-Year Graduation Rate
74.0%
84.0%
8-Year Graduation Rate
75.0%
84.0%
Retention Rate
90.0%
92.0%
Employment Rate
79.7%
73.1%
10 Year Median Earnings
$64,762
$66,125
Explore by Location
Iowa is in Iowa City, IA
Pittsburgh-Pittsburgh Campus is in Pittsburgh, PA
Frequently Asked Questions
University of Iowa has an acceptance rate of 84%, while Pittsburgh-Pittsburgh Campus has an acceptance rate of 58%. This means Pittsburgh-Pittsburgh Campus is more selective than University of Iowa.
Let’s find your perfect tutor
Answer a few quick questions. We’ll recommend the right plan and match you with a top 5% tutor.