How to graph an absolute value function
Help Questions
Algebra › How to graph an absolute value function
Give the 
The graph has no 
Explanation
To find the 


Rewrite this as the compound equation:

Solve each separately:
There are two 

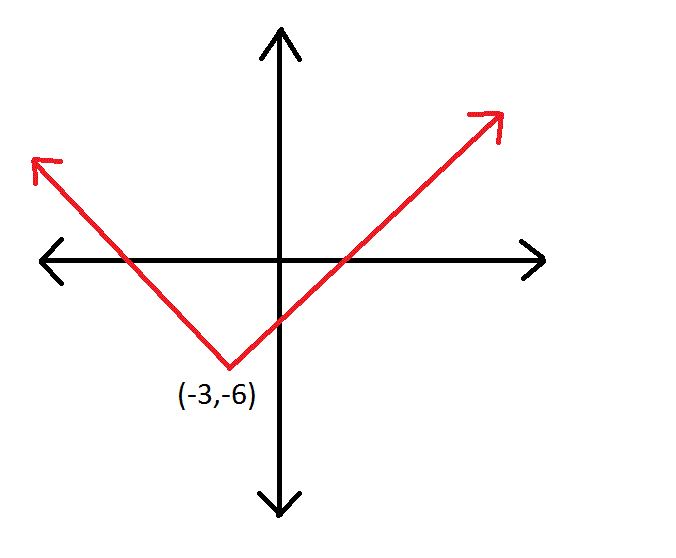
Which of these would most likely be the equation corresponding to the above graph?
Explanation
This is an absolute value graph. Its equation takes the form 


Since the graph of 


Plug these values into the general form of the equation:
Simplify:
Explanation
Explanation
Explanation

Which of these would most likely be the equation corresponding to the above graph?
Explanation
This is an absolute value graph. Its equation takes the form 


Since the graph of 


or


