What this quiz covers
This quiz focuses on Statistics And Probability In Context, giving you a quick way to practice the rules, question types, and explanations that matter most for TACHS.
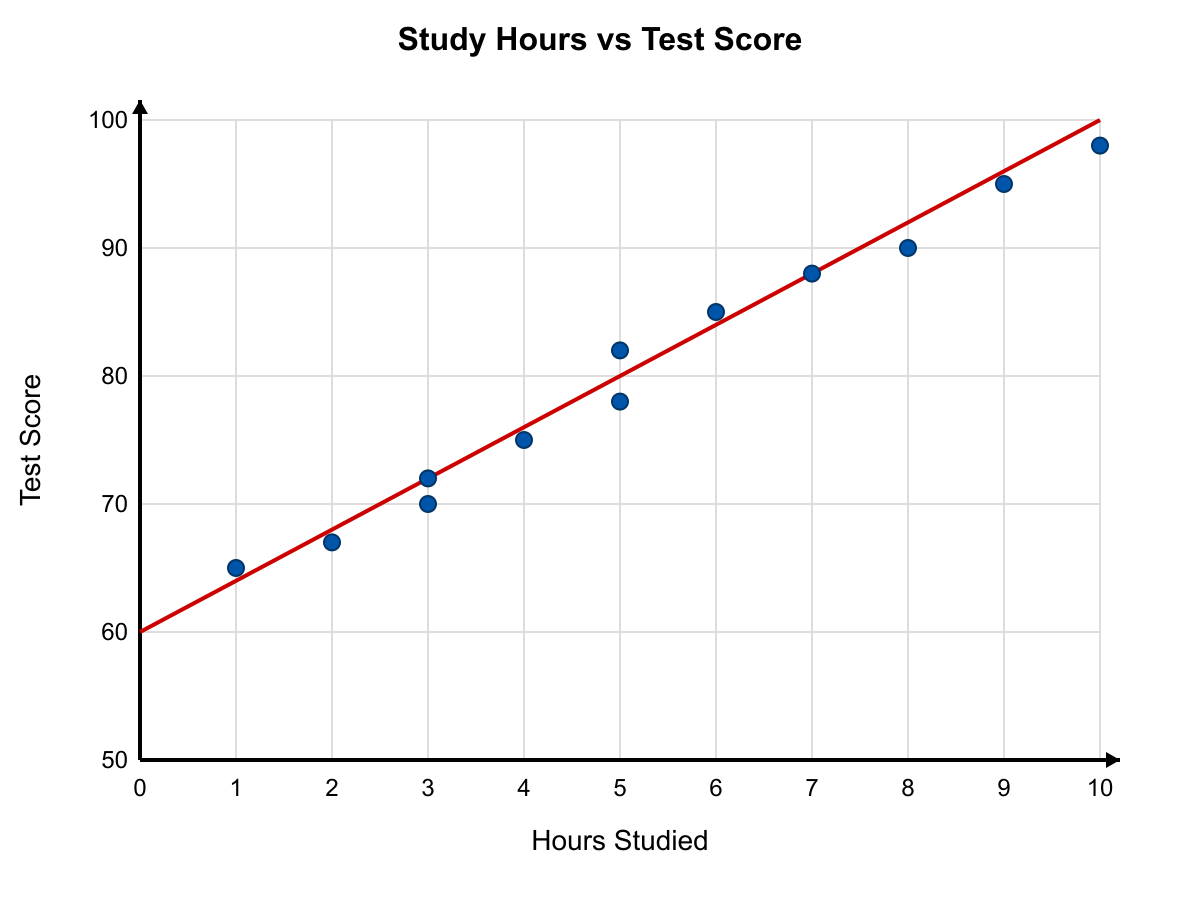
The scatter plot below shows the relationship between hours studied and test scores for 12 students. Refer to the scatter plot to answer the question. If a student studied 6 hours, which is the best prediction of the test score based on the trend line?
TACHS Quiz
Practice Statistics And Probability In Context in TACHS with focused quiz questions that help you check what you know, review explanations, and build confidence with test-style prompts.
This quiz focuses on Statistics And Probability In Context, giving you a quick way to practice the rules, question types, and explanations that matter most for TACHS.
Try each quiz question before looking at the correct answer. Use the explanations to review missed ideas, then come back to similar questions until the pattern feels familiar.
The scatter plot below shows the relationship between hours studied and test scores for 12 students. Refer to the scatter plot to answer the question. If a student studied 6 hours, which is the best prediction of the test score based on the trend line?
The double bar graph below compares the number of minutes Ana and Ben exercised each day from Monday to Friday. Refer to the graph to answer the question. On how many days did Ana's minutes differ from Ben's minutes by MORE than the mean of the daily differences?
The circle graph below shows how students travel to Lincoln Middle School. Refer to the graph to answer the question. If the school has 480 students and 25% of bus riders are sixth-graders, how many sixth-graders ride the bus?
A jar contains 4 red marbles, 5 blue marbles, and 7 green marbles. If one marble is selected at random, what is the probability that the marble is blue?
The ages of seven cousins are 11,12,13,13,14,15,16 years. If the youngest cousin is not included, what is the median age of the remaining six cousins?
For the set of numbers 4,9,11,19,22, what is the range?
The daily high temperatures (in °F) for one week were 68,70,70,72,68,70,74. What is the mode of these temperatures?
Before the birth of a new sibling, the average age of four children in a family was 8.5 years. After the baby was born, the average age of the five children became 7.2 years. How old (in years) was the newborn counted as for this calculation?
In a class of 30 students, 14 like chocolate ice cream, 18 like vanilla ice cream, and 7 like both flavors. If one student is selected at random, what is the probability that the student likes neither flavor?
The stem-and-leaf plot shows test scores for a class. Use the plot to answer the question. If a passing score is 70 or higher, what is the probability that a randomly chosen student passed AND scored above the class median?
The table below shows the results of drawing colored marbles from a bag 200 times (with replacement). Refer to the table to answer the question. Based on this experiment, if the bag contains 40 marbles, what is the best estimate of how many are NOT green?
The bar graph below shows the number of books read by members of a reading club in one month. Use the graph to answer the question. If one member is selected at random, what is the probability that the member read more than the mean number of books?
The Venn diagram below shows the number of students in a class who play basketball (B), soccer (S), or both. Refer to the Venn diagram to answer the question. If a student who plays at least one sport is chosen at random, what is the probability they play ONLY soccer?
The line plot below shows the number of hours 15 students spent on homework last week. Use the line plot to answer the question. Which of the following statements is true?
The box-and-whisker plot represents scores on a science test. Use the plot to answer the question. Which statement MUST be true?
Maria played five basketball games and scored 12, 15, 18, 21, and 24 points. After a sixth game, her overall mean rose to 20 points per game. How many points did she score in the sixth game?
A standard deck contains 52 playing cards, 26 of which are red. If one card is drawn at random, what is the probability that the card is not red?
The word "STATISTICS" is written on individual letter tiles, one letter per tile. If a tile is selected at random, what is the probability that it shows a vowel?
Consider all consecutive integers from 7 through 15, inclusive. What is the median of this data set?
A fair number cube with faces numbered 1 through 6 is rolled once. What is the probability that the number shown is either a prime number or divisible by 4?