All questions
Question 1
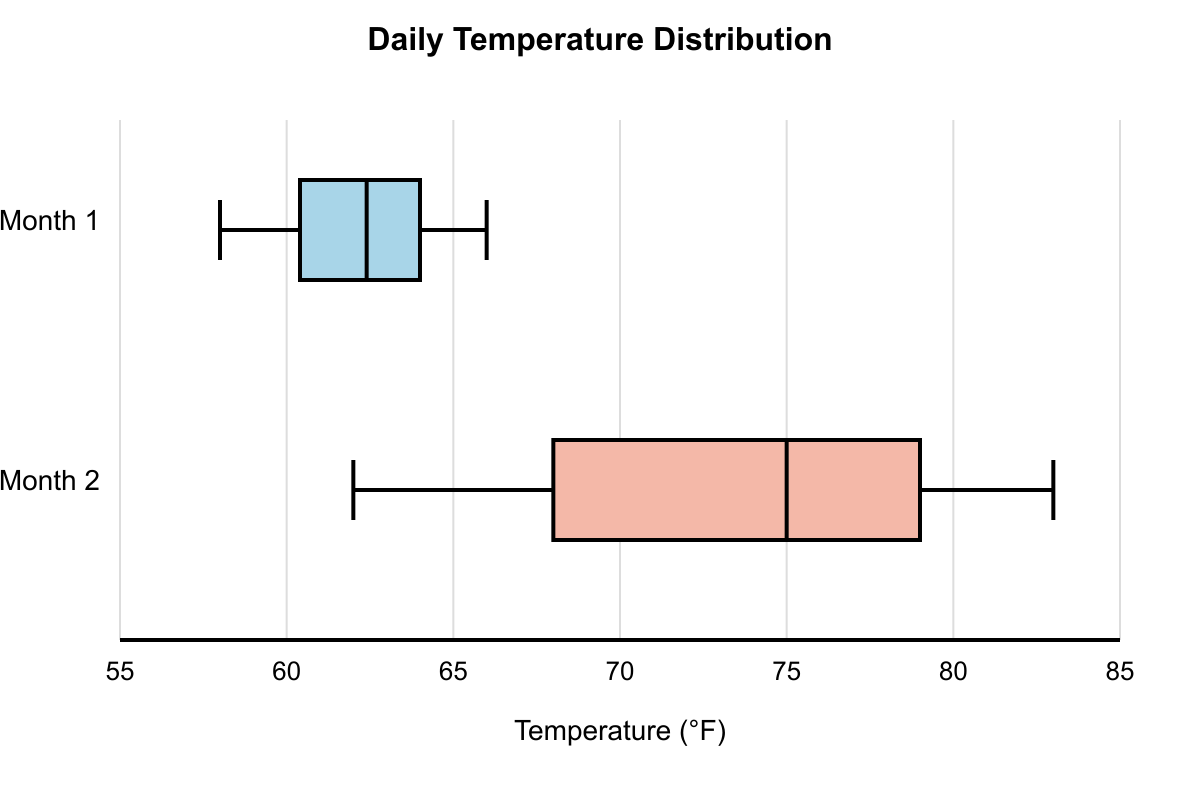
The box plot below shows the distribution of daily temperatures (°F) for two different months. Based on the median temperatures shown, what was the average of the two medians?
- 67°F
- 69°F (correct answer)
- 71°F
- 73°F
- 75°F
Explanation: From the box plots: Month 1 median = 63°F (center line of first box), Month 2 median = 75°F (center line of second box). Average of medians = (69+75)÷2 = 144÷2 = 72°F.
Question 2
A teacher calculated that her class average on a test was 78 points. After discovering that one student's score of 65 was incorrectly recorded as 56, she recalculated the average. If there are 24 students in the class, what is the new average?
- 78.25 points
- 78.375 points (correct answer)
- 78.5 points
- 79.125 points
- 79.25 points
Explanation: When you encounter questions about correcting errors in averages, you need to understand how changes to individual data points affect the overall average. The key insight is that you don't need to recalculate everything from scratch—you can work with the change directly.
Start with what you know: the original average was 78 points with 24 students, so the total points for all students was 78×24=1,872 points. When the error is corrected, one student's score changes from 56 to 65, adding 65−56=9 points to the class total.
The new total becomes 1,872+9=1,881 points. With 24 students, the new average is 241,881=78.375 points.
Looking at the wrong answers: Choice A (78.25) likely comes from adding only 6 points instead of 9, perhaps from miscalculating the difference. Choice C (78.5) might result from rounding errors or adding exactly 12 points (0.5 × 24). Choice D (79.125) is too large and suggests either doubling the correction or making an error in the division.
For average correction problems, remember this efficient approach: find the total change in points, add it to the original total (original average × number of items), then divide by the number of items. This saves time compared to listing all individual scores and avoids arithmetic errors from handling large datasets. Question 3
A quality control inspector measured the weights of 15 packages. The first 10 packages had an average weight of 2.4 pounds each. The remaining 5 packages weighed 2.1, 2.8, 2.6, 2.3, and 2.7 pounds respectively. What was the overall average weight of all 15 packages?
- 2.45 pounds
- 2.47 pounds (correct answer)
- 2.50 pounds
- 2.53 pounds
- 2.55 pounds
Explanation: When you encounter questions about finding the overall average of combined groups, you need to work with total weights rather than just averaging the given averages.
To find the overall average weight, you must first calculate the total weight of all packages, then divide by the total number of packages.
For the first 10 packages with an average of 2.4 pounds each:
Total weight = 10×2.4=24 pounds
For the remaining 5 packages:
Total weight = 2.1+2.8+2.6+2.3+2.7=12.5 pounds
Combined total weight = 24+12.5=36.5 pounds
Overall average = 1536.5=2.466... pounds, which rounds to 2.47 pounds.
Looking at the wrong answers: Choice A (2.45 pounds) is too low and might result from calculation errors in adding the individual weights. Choice C (2.50 pounds) could come from incorrectly averaging the two group averages (2.4 and 2.5) without considering that the groups have different sizes. Choice D (2.53 pounds) is too high and might result from errors in the initial calculations or rounding mistakes.
The key strategy here is remembering that you cannot simply average two averages when the groups are different sizes. Always convert to totals first, then find the overall average. This weighted average concept appears frequently on standardized tests, so practice identifying when group sizes differ. Question 4
A baseball player's batting averages for each month of the season were: April 0.285, May 0.312, June 0.298, July 0.276, August 0.334, and September 0.291. If batting average represents hits per at-bat, and the player had 85 at-bats each month, what was his overall batting average for the season?
- 0.296
- 0.299 (correct answer)
- 0.302
- 0.305
- 0.308
Explanation: When you encounter batting average problems, remember that batting average is calculated as total hits divided by total at-bats. The key insight here is that you can't simply average the monthly batting averages—you need to work with the actual hits and at-bats.
First, calculate the total hits for each month by multiplying each batting average by 85 at-bats:
- April: 0.285×85=24.225 hits
- May: 0.312×85=26.52 hits
- June: 0.298×85=25.33 hits
- July: 0.276×85=23.46 hits
- August: 0.334×85=28.39 hits
- September: 0.291×85=24.735 hits
Total hits: 24.225+26.52+25.33+23.46+28.39+24.735=152.66
Total at-bats: 85×6=510
Overall batting average: 510152.66=0.299
The correct answer is B) 0.299.
Answer A) 0.296 would result from calculation errors in the hit totals. Answer C) 0.302 and D) 0.305 likely come from incorrectly averaging the six monthly averages (60.285+0.312+0.298+0.276+0.334+0.291≈0.299), but this approach ignores the weighted nature of the calculation.
Remember: When dealing with rates or averages across different time periods, always work with the underlying totals rather than averaging the rates directly, especially when the sample sizes are equal across periods. Question 5
A fitness trainer recorded the number of push-ups completed by 8 clients: 25, 32, 28, 35, 30, 26, 33, and 29. The trainer wants to compare this group's average to the gym's overall average of 31 push-ups. By how much does this group's average differ from the gym average?
- 2.25 push-ups below gym average
- 1.25 push-ups below gym average (correct answer)
- 1.0 push-ups below gym average
- 0.5 push-ups above gym average
- Exactly matches the gym average
Explanation: When you encounter average comparison problems, you need to calculate the group's mean and then find the difference from the reference value.
To find this group's average, add all the push-up counts and divide by 8: 825+32+28+35+30+26+33+29=8238=29.75 push-ups.
Now compare this to the gym's overall average of 31 push-ups: 31−29.75=1.25. Since the group's average (29.75) is less than the gym average (31), the group performed 1.25 push-ups below the gym average.
Looking at the wrong answers: Choice A (2.25 below) likely comes from a calculation error, perhaps miscounting the sum or dividing incorrectly. Choice C (1.0 below) might result from rounding 29.75 to 30 before comparing, which loses important precision. Choice D (0.5 above) represents a sign error—getting the magnitude wrong or mistakenly thinking the group performed better than average.
The key trap here is precision. Many students rush through the division or round prematurely, leading to incorrect differences. Always carry your decimal calculations through to the end before rounding, and pay careful attention to whether the difference represents "above" or "below" the reference value. When working with averages, double-check your arithmetic since small errors in addition or division create noticeably wrong final answers. Question 6
The bar graph shows the number of customers served each day at a restaurant. On which day was the number of customers closest to the weekly average?
- Monday
- Tuesday
- Wednesday (correct answer)
- Thursday
- Friday
Explanation: From the graph: Mon=45, Tue=62, Wed=58, Thu=51, Fri=69, Sat=74, Sun=41. Total = 400 customers. Weekly average = 400÷7 ≈ 57.14 customers. Distances from average: Mon=12.14, Tue=4.86, Wed=0.86, Thu=6.14, Fri=11.86. Wednesday (58 customers) is closest to the average of 57.14.
Question 7
The line graph shows the temperature readings taken every 2 hours from 6 AM to 6 PM. What was the average temperature during the time period from 10 AM to 4 PM?
- 73°F
- 75°F
- 77°F (correct answer)
- 79°F
- 81°F
Explanation: From 10 AM to 4 PM includes readings at: 10 AM (74°F), 12 PM (78°F), 2 PM (80°F), and 4 PM (76°F). Average = (74+78+80+76)÷4 = 308÷4 = 77°F.
Question 8
The table shows quiz scores for four students across five quizzes. Which student had the most consistent performance, as measured by having the smallest difference between their highest and lowest individual quiz scores?
- Anna had the most consistent quiz performance
- Ben had the most consistent quiz performance (correct answer)
- Carlos had the most consistent quiz performance
- Diana had the most consistent quiz performance
- Two students tied for most consistent performance
Explanation: Calculate the range (highest - lowest) for each student: Anna: 92-78 = 14 points; Ben: 87-79 = 8 points; Carlos: 95-75 = 20 points; Diana: 90-76 = 14 points. Ben had the smallest range at 8 points, making his performance most consistent. Anna and Diana both had ranges of 14 points. Carlos had the largest range at 20 points.
Question 9
The stem-and-leaf plot shows test scores for 20 students. What is the average score for students who scored in the 80s (scores from 80-89)?
- 84.2
- 85.1
- 85.5 (correct answer)
- 86.4
- 87
Explanation: From the stem-and-leaf plot, scores in the 80s are: 82, 84, 85, 86, 87, 89. Total: 82 + 84 + 85 + 86 + 87 + 89 = 513 points. Number of scores: 6 students. Average: 513 ÷ 6 = 85.5.