All questions
Question 1
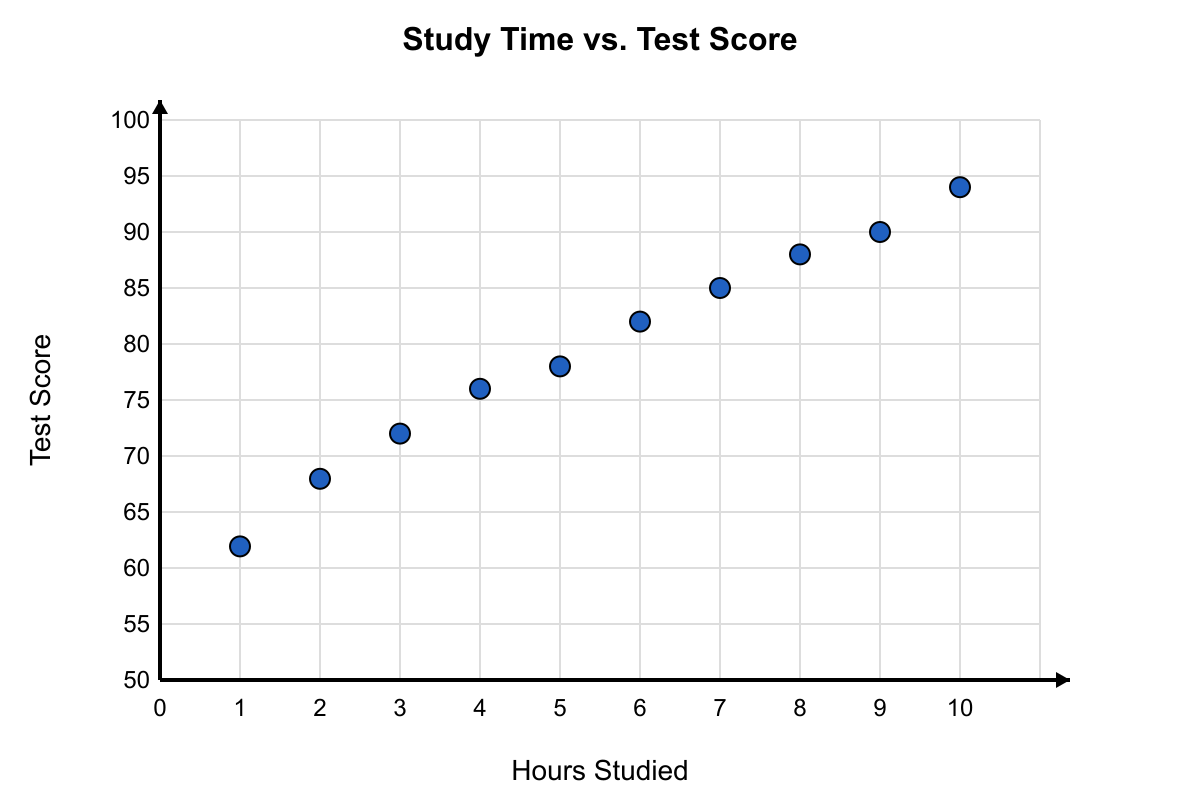
The scatter plot shown displays the number of hours studied and the test scores for 10 students. Based only on the data points shown, what is the median test score?
- 76
- 78
- 80 (correct answer)
- 82
Explanation: Reading the 10 test scores from the scatter plot: 62, 68, 72, 76, 78, 82, 85, 88, 90, 94. With 10 values, the median is the average of the 5th and 6th: (78 + 82)/2 = 80. Answer (C). (A) and (B) are individual values (5th alone or 4th) rather than the average; (D) is the 6th value alone. Many students forget to average the two middle values when n is even.
Question 2
Which statement about the data set 1,1,2,3,3,4,4,5 is true?
- The data set has no mode.
- The mode is 1.
- The modes are 1, 3, and 4. (correct answer)
- The mode is 4.
Explanation: When you encounter a question about mode, you're looking for the value(s) that appear most frequently in a data set. The key is to count how many times each number appears and identify which ones tie for the highest frequency.
Let's count the frequency of each value in the data set 1,1,2,3,3,4,4,5:
- 1 appears 2 times
- 2 appears 1 time
- 3 appears 2 times
- 4 appears 2 times
- 5 appears 1 time
The highest frequency is 2, and three different values (1, 3, and 4) all appear exactly 2 times each. Since these three values are tied for most frequent, they are all modes of this data set.
Choice A is incorrect because the data set does have modes—multiple values appear with the same highest frequency. Choice B is wrong because while 1 does appear most frequently, it's not the only value that does so; 3 and 4 also appear 2 times each. Choice D makes the same error as B, identifying only one of the three modes instead of recognizing that multiple values tie for most frequent.
Remember that a data set can have no mode (when all values appear equally), one mode (unimodal), two modes (bimodal), or even more modes (multimodal) when multiple values tie for the highest frequency. Always count carefully and identify all values that appear most frequently—don't stop after finding just one. Question 3
A student's first four quiz scores have an average of 78. What score on the fifth quiz is needed to raise the average to 80?
- 82
- 86
- 88 (correct answer)
- 90
Explanation: When you encounter average problems that ask what's needed to reach a new average, you're working with the relationship between totals and averages. The key insight is that average equals total divided by number of items.
Let's work through this systematically. If the first four quiz scores average 78, then the total of those four scores is 4×78=312 points. To have an average of 80 across five quizzes, the total points needed would be 5×80=400 points.
Since you already have 312 points from the first four quizzes, the fifth quiz must provide the remaining points: 400−312=88 points. This confirms that answer C) 88 is correct.
Looking at the wrong answers: A) 82 would give you a total of 312+82=394 points, resulting in an average of 394÷5=78.8, which falls short of 80. B) 86 would give you 312+86=398 points and an average of 398÷5=79.6, still not quite 80. D) 90 would give you 312+90=402 points and an average of 402÷5=80.4, which exceeds the target of 80.
For average problems on the SHSAT, always convert to totals first—it makes the arithmetic much clearer than trying to work directly with averages. Remember: find the current total, find the target total, then calculate the difference. Question 4
The test scores 66,72,66,84,90,72,72,88 were recorded for eight students. What is the mode of these scores?
- 66
- 72 (correct answer)
- 84
- 90
Explanation: When you encounter a question asking for the mode, you're being tested on measures of central tendency. The mode is simply the value that appears most frequently in a data set.
To find the mode, count how many times each score appears in the list 66,72,66,84,90,72,72,88. Organizing the data helps: 66 appears twice, 72 appears three times, 84 appears once, 88 appears once, and 90 appears once. Since 72 appears more frequently than any other value (three times), it's the mode.
Looking at the wrong answers: Choice A (66) appears twice, making it the second most frequent value, but frequency alone doesn't make it the mode—it needs to be the most frequent. Choice C (84) and Choice D (90) each appear only once, so they're among the least frequent values, not the most frequent.
A common mistake is confusing the mode with other measures of central tendency. The mode isn't the middle value (that's the median) or the average (that's the mean)—it's strictly about frequency of occurrence. Another trap is assuming that larger numbers are more likely to be the mode, but the mode depends entirely on how often values repeat, not their size.
Remember: mode equals "most." When finding the mode, always count frequencies systematically. If no value repeats, there's no mode. If multiple values tie for highest frequency, the data set has multiple modes. Question 5
To the nearest tenth, what is the mean of 2.5,3.0,3.5,4.0,4.0,4.5?
- 3.5
- 3.6 (correct answer)
- 3.7
- 3.8
Explanation: Finding the mean (or average) of a data set is one of the most fundamental statistics concepts you'll encounter. When you see a question asking for the mean, remember that you need to add all values and divide by the number of values.
To find the mean of 2.5,3.0,3.5,4.0,4.0,4.5, start by adding all the values: 2.5+3.0+3.5+4.0+4.0+4.5=21.5. Next, count how many values you have—there are 6 numbers in this data set. Finally, divide the sum by the count: 621.5=3.5833. Since the question asks for the answer to the nearest tenth, you round 3.5833 to 3.6.
Looking at the wrong answers: Choice A (3.5) might tempt you if you mistakenly found the median instead of the mean, since 3.5 falls right in the middle when you arrange these numbers in order. Choice C (3.7) could result from a rounding error—perhaps rounding 3.5833 incorrectly or making an arithmetic mistake in your addition. Choice D (3.8) is too high and likely comes from calculation errors in either the sum or the division step.
The correct answer is B (3.6).
Study tip: Always double-check your arithmetic when calculating means, especially your addition. Also, make sure you're answering what the question asks for—mean, median, and mode are different concepts that students often confuse under pressure. Question 6
The mean of the numbers 7,9,x,11,13 is 10. What is the value of x?
- 8
- 10 (correct answer)
- 12
- 14
Explanation: When you encounter a problem involving the mean (average) of a set of numbers, remember that the mean equals the sum of all values divided by the count of values. Here, you need to work backwards from the given mean to find the missing value.
Since the mean of the five numbers 7,9,x,11,13 is 10, you can set up the equation: 57+9+x+11+13=10
Multiply both sides by 5: 7+9+x+11+13=50
Simplify the left side: 40+x=50
Therefore: x=10
Looking at the wrong answers: Choice A (8) would give a sum of 48, making the mean 9.6, not 10. Choice C (12) would create a sum of 52, resulting in a mean of 10.4. Choice D (14) would produce a sum of 54, giving a mean of 10.8. Each of these represents what you'd get if you made calculation errors or misunderstood the setup.
Choice B (10) is correct because it's the only value that makes the total sum equal 50, which divided by 5 gives the required mean of 10.
Strategy tip: When finding a missing value in a mean problem, always multiply the given mean by the total number of values first—this gives you the required sum. Then subtract the known values to find what's missing. This approach prevents arithmetic mistakes and works every time. Question 7
The dot plot shown displays the scores of 12 students on a quiz. If the teacher discovers that the two lowest scores were recorded incorrectly and each should be increased by 3 points, what is the new median score?
- 7
- 7.5 (correct answer)
- 8
- 8.5
Explanation: Original scores (from dot plot): 3, 4, 6, 6, 7, 7, 8, 8, 8, 9, 9, 10. After correction, 3→6 and 4→7. New sorted data: 6, 6, 6, 7, 7, 7, 8, 8, 8, 9, 9, 10. With 12 values the median is the average of the 6th and 7th: (7+8)/2=7.5. (A) ignores the sort after correction; (C) takes only the 7th value; (D) averages 8 and 9. Question 8
The circle graph shown displays the distribution of 60 survey responses rating a product 1, 2, 3, 4, or 5 stars. Based on the circle graph, what is the median rating?
- 2
- 3 (correct answer)
- 3.5
- 4
Explanation: From the circle graph: 1-star = 10% (6 responses), 2-star = 20% (12), 3-star = 30% (18), 4-star = 25% (15), 5-star = 15% (9). Ordered data positions: 1s at 1–6, 2s at 7–18, 3s at 19–36, 4s at 37–51, 5s at 52–60. Median = average of 30th and 31st values, both of which are 3. Median = 3. Answer (B). (A) is the modal value misidentified; (C) averages two adjacent categories; (D) is the category with the second-largest share.
Question 9
A student recorded the number of books read by classmates over summer break. When arranged in order, the data set is: 2, 3, 5, 7, 9, 12, 15. If two additional students report reading 6 books and 8 books respectively, what is the difference between the new median and the original mean?
- 0
- 0.4
- 0.6 (correct answer)
- 1.4
Explanation: Original data: 2, 3, 5, 7, 9, 12, 15. Original mean = (2+3+5+7+9+12+15)/7 = 53/7 ≈ 7.57. New data set: 2, 3, 5, 6, 7, 8, 9, 12, 15 (9 values). New median = 7 (middle value). Difference = 7.57 - 7 = 0.57 ≈ 0.6. Choice A incorrectly assumes the values are equal. Choice B uses the wrong calculation or rounds incorrectly. Choice D likely adds instead of subtracting.
Question 10
Use the table above to find the median test score.
- 75
- 80 (correct answer)
- 85
- 82
Explanation: Total tests =18; median is between 9th and 10th scores. Cumulative frequency up to 80 covers 12 tests, so both middle scores are 80.
Why the others are wrong:
A. 75 is below the two middle positions.
C & D exceed the median positions.
Question 11
Based on the dot plot below, what is the mean number of pets per student?
- 1.2
- 1.3 (correct answer)
- 1.5
- 1.6
Explanation: Compute using the frequencies: 2+4+3+10(2)+1(4)+2(3)+3(1)=1013=1.3.
Why the others are wrong:
A. 1.2 is obtained by mis-counting one dot.
C & D inflate the numerator by treating two-pet owners as three-pet owners. Question 12
Based on the histogram below, what is the median age of the participants?
- 12
- 12.5
- 13 (correct answer)
- 13.5
Explanation: Total participants =20. The median is between the 10th and 11th values. Cumulative counts place both in the 13-year-old bar, so the median age is 13.
Why the others are wrong:
A & B stop inside the 12-year-old group.
D passes the two middle values.
Question 13
A data set consists of 12 values. When the values are arranged in ascending order, the 6th value is 45 and the 7th value is 51. If the mean of all 12 values is 48, what is the sum of all the values in the data set?
- 528
- 576 (correct answer)
- 588
- 624
Explanation: If the mean of 12 values is 48, then the sum of all values = 12 × 48 = 576. The information about the 6th and 7th values (which give us the median = (45+51)/2 = 48) is consistent with the mean but doesn't change the calculation for the sum. Choice A uses 11 instead of 12 values (11 × 48). Choice C incorrectly adds the median to the sum (576 + 12). Choice D uses the wrong mean (52 instead of 48).
Question 14
A data set has 9 values with a median of 12. The values below the median are: 3, 7, 8, 11. The values above the median are: 15, 17, 20, 24. What is the difference between the mean and the median of this data set?
- 1.0 (correct answer)
- 1.3
- 2.0
- 2.3
Explanation: The complete data set is: 3, 7, 8, 11, 12, 15, 17, 20, 24. The median is 12 (5th value out of 9). The mean = (3+7+8+11+12+15+17+20+24)/9 = 117/9 = 13. The difference = 13 - 12 = 1. Choice B might result from a calculation error. Choice C assumes the mean is 14. Choice D assumes the mean is 14.3.
Question 15
A teacher calculated that the mean score on a quiz was 16 points. After discovering an error, she needed to add 3 points to one student's score and subtract 1 point from another student's score. If there are 20 students in the class, what is the new mean score?
- 16.0
- 16.1 (correct answer)
- 16.2
- 18.0
Explanation: The original total points for all students was 20 × 16 = 320 points. After corrections: +3 points and -1 point gives a net change of +2 points. New total = 320 + 2 = 322 points. New mean = 322/20 = 16.1 points. Choice A assumes no net change. Choice C incorrectly calculates the net change as +4 points. Choice D incorrectly adds the corrections to the mean directly (16 + 3 - 1 = 18).
Question 16
The histogram shown groups the test scores of 40 students into five intervals. Using the midpoint of each interval to estimate scores, what is the approximate mean score?
- 72.5
- 74
- 75.5 (correct answer)
- 77
Explanation: Using midpoints and frequencies: 55(4) + 65(6) + 75(14) + 85(12) + 95(4) = 220 + 390 + 1050 + 1020 + 380 = 3060. Mean = 3060/40 = 76.5. The closest choice is (C) 75.5.
Question 17
The stem-and-leaf plot shown displays the heights (in cm) of 15 plants in a greenhouse. Based on the plot, what is the positive difference between the mean and the median of the data?
- 0.4 (correct answer)
- 0.6
- 1
- 1.4
Explanation: Data from stems 2,3,4,5 with leaves: 24, 25, 28; 31, 33, 35, 37, 39; 42, 44, 46, 48; 51, 53, 55. That's 15 values. Sum = 24+25+28+31+33+35+37+39+42+44+46+48+51+53+55 = 591. Mean = 591/15 = 39.4. Median is the 8th value = 39. Difference = |39.4 - 39| = 0.4.
Question 18
A bag contains marbles of four colors with the counts shown.
Red: 12 marbles
Blue: 18 marbles
Green: 7 marbles
Yellow: 15 marbles
Which color is the mode of the data set?
- Red
- Blue (correct answer)
- Green
- Yellow
Explanation: When you encounter a question asking for the "mode" of a data set, you're being tested on measures of central tendency. The mode is simply the value that appears most frequently in a data set.
To find the mode among these marble colors, you need to compare the frequency (count) of each color:
- Red: 12 marbles
- Blue: 18 marbles
- Green: 7 marbles
- Yellow: 15 marbles
Since Blue has 18 marbles, which is higher than any other color's count, Blue is the mode of this data set.
Let's examine why the other choices are incorrect:
Choice (A) Red has 12 marbles, which is fewer than Blue's 18, so it cannot be the mode.
Choice (C) Green has only 7 marbles, the smallest count of all four colors, making it the opposite of what we're looking for.
Choice (D) Yellow has 15 marbles, which is more than Red and Green but still fewer than Blue's 18 marbles.
The key insight is that mode is about frequency, not about which category comes first alphabetically or appears in any particular position. You simply count occurrences and identify the highest.
Study tip: Remember that mode = "most." This connection can help you quickly recall that you're looking for the category with the highest frequency. Also, unlike mean and median, mode can apply to non-numerical data (like colors), making it particularly useful for categorical data analysis questions on the SHSAT. Question 19
What is the median of the numbers −3,7,0,2,−1?
- -1
- 0 (correct answer)
- 1
- 2
Explanation: When you encounter a median question, you're looking for the middle value when numbers are arranged in order. This is a fundamental measure of central tendency that appears frequently on the SHSAT.
To find the median, first arrange the given numbers in ascending order: −3,−1,0,2,7. Since there are 5 numbers (an odd count), the median is simply the middle value—the 3rd number in your ordered list. That middle value is 0, making B the correct answer.
Let's examine why the other choices are wrong. Choice A gives −1, which is the 2nd value in our ordered list—this would be a common error if you miscounted positions or confused median with another measure. Choice C suggests 1, but this number doesn't even appear in our original set, so it cannot be the median of these specific values. Choice D offers 2, which is the 4th value in our ordered sequence—another position-counting mistake.
The key trap here is forgetting to order the numbers first. If you tried to find the middle of the original sequence −3,7,0,2,−1, you might incorrectly choose 0 by accident (which happens to be right) or pick the wrong middle position entirely.
Remember this pattern: always sort first, then count to the middle. With an odd number of values, you'll have exactly one middle number. With an even number of values, you'd average the two middle numbers. Question 20
The data set 15,20,25,20,30 is given. Which measure or measures of central tendency are equal to 20?
- Median only
- Mode only
- Median and Mode only (correct answer)
- Mean, Median, and Mode
Explanation: When you encounter questions about measures of central tendency, you need to calculate the mean, median, and mode separately to see which ones equal the given value.
Let's work through the data set 15,20,25,20,30 systematically:
Mean: Add all values and divide by the number of data points: 515+20+25+20+30=5110=22
Median: Arrange the data in order: 15,20,20,25,30. The middle value (3rd position) is 20.
Mode: The value that appears most frequently is 20 (it appears twice, while all others appear once).
So the median and mode both equal 20, while the mean equals 22.
Looking at the answer choices: Choice A says "Median only" — this is wrong because the mode also equals 20. Choice B says "Mode only" — this is also wrong because the median equals 20 as well. Choice D says "Mean, Median, and Mode" — this is incorrect because the mean equals 22, not 20. Choice C correctly identifies that both the median and mode equal 20.
Strategy tip: Always calculate all three measures separately rather than assuming relationships between them. The mean can be "pulled" toward extreme values, while the median resists outliers, and the mode depends entirely on frequency. Don't let the presence of repeated values trick you into thinking all measures will be equal.