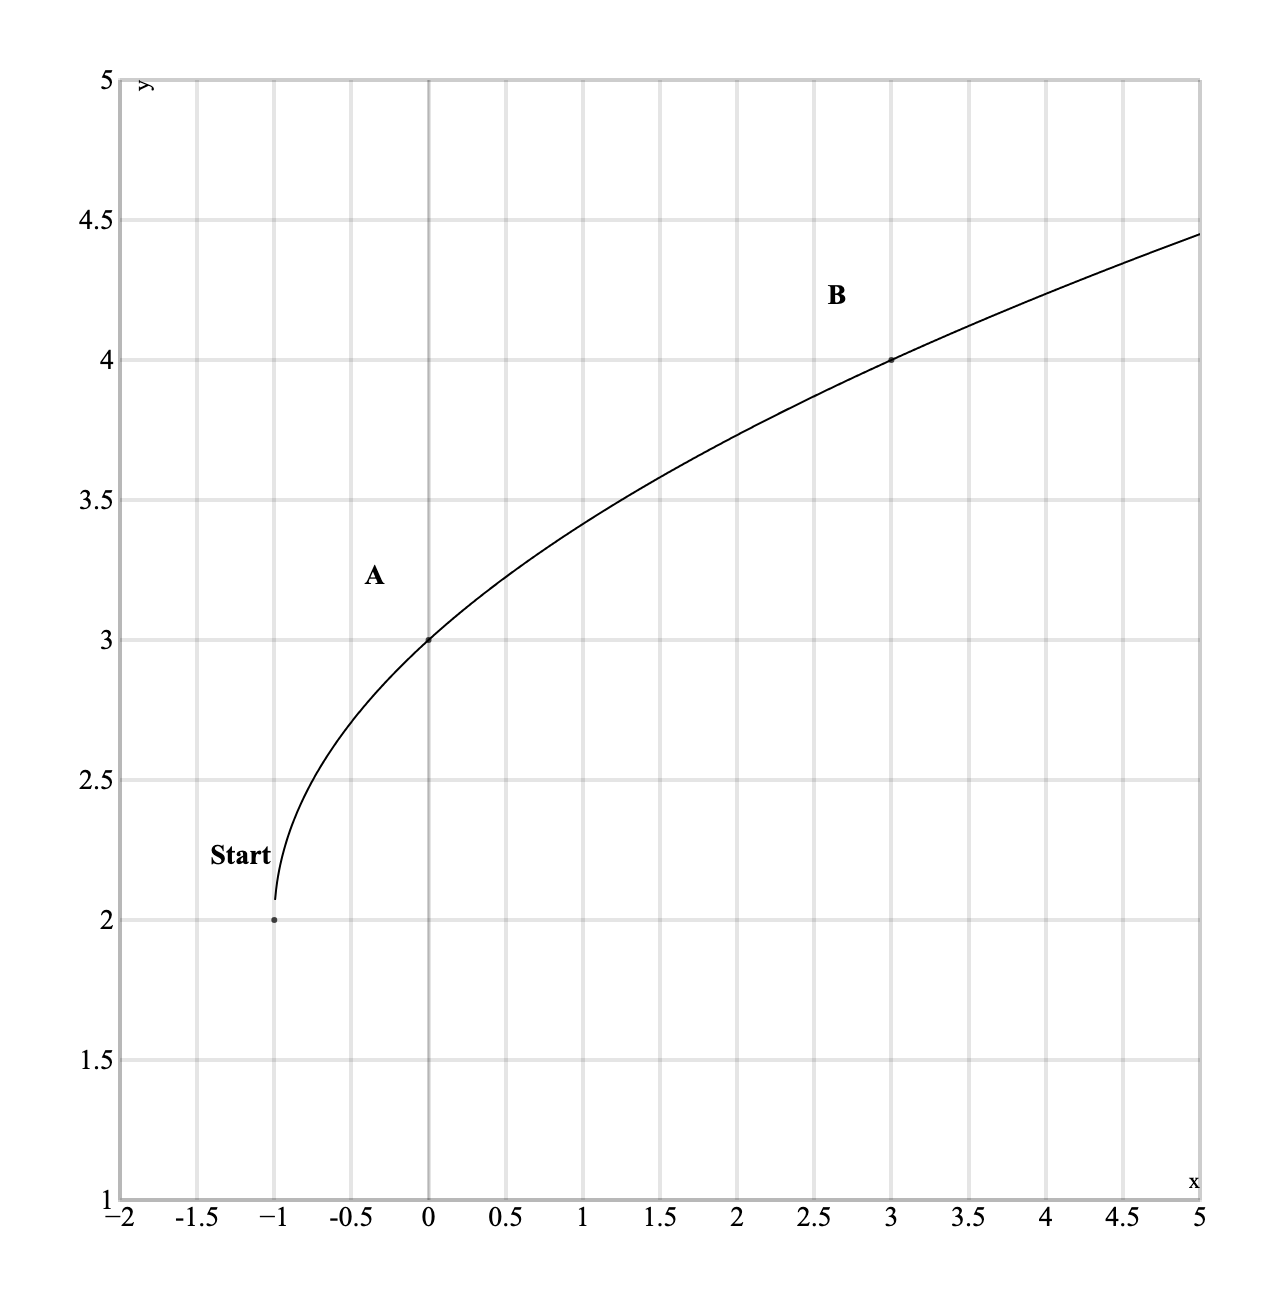
A coordinate plane graph shows f(x) as a square-root curve starting at (−1,2) and increasing to the right, passing through (0,3) and (3,4). Which equation matches the graph?
Practice Graphing Functions in SAT Math with focused quiz questions that help you check what you know, review explanations, and build confidence with test-style prompts.
What this quiz covers
This quiz focuses on Graphing Functions, giving you a quick way to practice the rules, question types, and explanations that matter most for SAT Math.
How to use this quiz
Try each quiz question before looking at the correct answer. Use the explanations to review missed ideas, then come back to similar questions until the pattern feels familiar.
All questions
Question 1
A coordinate plane graph shows f(x) as a square-root curve starting at (−1,2) and increasing to the right, passing through (0,3) and (3,4). Which equation matches the graph?
f(x)=x+1+2 (correct answer)
f(x)=2x+1+2
f(x)=x+1−2
f(x)=x−1+2
Explanation: The question asks us to identify a square root function starting at (-1, 2) and passing through (0, 3) and (3, 4). The general form is f(x) = a√(x - h) + k, where (h, k) is the starting point, giving us f(x) = a√(x - (-1)) + 2 = a√(x + 1) + 2. To find a, we use point (0, 3): 3 = a√(0 + 1) + 2 = a(1) + 2, so a = 1. Therefore, f(x) = √(x + 1) + 2. Common errors include shifting right instead of left (using √(x - 1)) or forgetting the vertical shift entirely. Remember that the square root function starts where the expression under the radical equals zero.
Question 2
The coordinate plane shows the graph of f(x) with a vertical asymptote at x=1 and a horizontal asymptote at y=0. The curve passes through (2,1) and decreases for x>1. Which equation matches the graph?
f(x)=x−11 (correct answer)
f(x)=x+11
f(x)=1−x1
f(x)=x−11+1
Explanation: We need to identify a rational function with vertical asymptote at x = 1, horizontal asymptote at y = 0, passing through (2, 1) and decreasing for x > 1. The vertical asymptote at x = 1 means the denominator has factor (x - 1), and the horizontal asymptote at y = 0 suggests f(x) = k/(x - 1) for some constant k. Using point (2, 1): 1 = k/(2 - 1) = k/1, so k = 1. Therefore, f(x) = 1/(x - 1). A common error is misplacing the asymptote at x = -1, leading to f(x) = 1/(x + 1). Always verify asymptotes by checking where the denominator equals zero.
Question 3
The coordinate plane shows f(x) as a square-root curve starting at (2,0) and passing through (3,1) and (6,2). Which equation matches the graph?
f(x)=x−2 (correct answer)
f(x)=x+2
f(x)=x−2+2
f(x)=2x−2
Explanation: We need to identify a square root function starting at (2, 0) and passing through (3, 1) and (6, 2). The general form is f(x) = a√(x - h) + k, where (h, k) is the starting point, giving us f(x) = a√(x - 2) + 0 = a√(x - 2). To verify a = 1, check point (3, 1): 1 = a√(3 - 2) = a√1 = a, so a = 1. Let's verify with (6, 2): f(6) = √(6 - 2) = √4 = 2 ✓. Therefore, f(x) = √(x - 2). Common mistakes include using √(x + 2) (shifting left instead of right) or adding an unnecessary vertical shift.
Question 4
A coordinate plane graph shows the function f(x) as an exponential growth curve with horizontal asymptote y=0. The curve passes through (0,1) and (2,9). Which equation represents the graph?
y=3x (correct answer)
y=9x
y=2x
y=3x−2
Explanation: The question requires the equation of an exponential growth curve with asymptote y=0, passing through (0, 1) and (2, 9). The graph shows a curve rising from (0, 1) and steepening to (2, 9), approaching the x-axis leftward, typical of base greater than 1 without shifts. The form y = a * b^x fits; at x=0, a=1, and at x=2, 1 * b^2 =9 so b=3, giving y=3^x. This links the y-intercept and growth rate to the base, verifying 3^2=9 matches the point. A common error is assuming base 2 from misreading (2, 9) as (2, 8) or 4, or adding a shift. For exponentials, use the y-intercept for a and another point for b, checking the asymptote for no vertical shift.
Question 5
The coordinate-plane graph shows f(x) as a V-shaped absolute value graph with vertex at (−2,1) and slopes ±1. Which equation represents f(x)?
f(x)=−∣x+2∣+1
f(x)=∣x+2∣−1
f(x)=∣x−2∣+1
f(x)=∣x+2∣+1 (correct answer)
Explanation: This question asks us to identify the equation of an absolute value function from its graph. The V-shaped graph has its vertex at (-2, 1) and slopes of ±1, indicating the basic absolute value function |x| has been shifted. For an absolute value function f(x) = |x - h| + k, the vertex is at (h, k), so with vertex at (-2, 1), we need h = -2 and k = 1, giving us f(x) = |x - (-2)| + 1 = |x + 2| + 1. The slopes of ±1 confirm there's no vertical stretch or compression. Common errors include shifting in the wrong direction (using |x - 2| instead of |x + 2|) or reflecting across the x-axis (using -|x + 2| + 1). When the vertex is at a negative x-value, remember that you add inside the absolute value bars.
Question 6
The coordinate plane graph shows a function with a sharp corner at the origin and two rays: one ray goes up to the right through (2,2), and the other goes up to the left through (−2,2). This indicates symmetry about the y-axis. Which equation matches the graph?
y=x
y=∣x∣ (correct answer)
y=−∣x∣
y=∣x−2∣
Explanation: The question seeks the equation for a graph with a sharp corner at the origin and rays upward to (2, 2) and (-2, 2), symmetric about the y-axis. The graph resembles a V-shape opening upward, with equal slopes of 1 on both sides, indicating an absolute value function centered at the origin. The form y = |x| fits, as at x=2, y=2, and at x=-2, y=2, matching the points and symmetry. This links the visual corner and rays to the absolute value's algebraic property of reflecting negative inputs. A common mistake is choosing a linear equation like y=x, which doesn't account for the left ray's upward direction. For piecewise-like graphs, identify symmetry and corners to select absolute value over linear functions.
Question 7
The coordinate-plane graph shows a line labeled f(x) passing through (0,−2) and (3,4). Which equation matches the graph?
f(x)=2x−2 (correct answer)
f(x)=32x−2
f(x)=23x−2
f(x)=−2x−2
Explanation: We need to find the equation of a line passing through (0,−2) and (3,4). The y-intercept is already given as -2 (when x=0, y=−2). Calculate the slope: m=3−04−(−2)=36=2. Using slope-intercept form: f(x)=mx+b=2x−2. To verify, check both points: f(0)=2(0)−2=−2 ✓ and f(3)=2(3)−2=6−2=4 ✓. A common error is calculating slope as Δx/Δy=3/6=1/2 instead of Δy/Δx=6/3=2. When finding linear equations, always verify your answer by substituting both given points.
Question 8
The coordinate-plane graph shows a piecewise relation: a circle centered at the origin with radius 3. Does the graph represent a function of x?
Yes, for all x
No, it fails the vertical line test (correct answer)
Yes, except at x=0
Cannot be determined
Explanation: The graph shows a circle centered at the origin with radius 3. To determine if this represents a function of x, we apply the vertical line test: does any vertical line intersect the graph at more than one point? For any x-value between -3 and 3 (except x = -3 and x = 3), a vertical line will intersect the circle at two points - one on the upper semicircle and one on the lower semicircle. For example, at x = 0, the circle passes through both (0, 3) and (0, -3). Since vertical lines intersect the graph at multiple points, this fails the vertical line test and is not a function of x. The key insight is that circles (except for single points) always fail the vertical line test because they curve back on themselves.
Question 9
The coordinate-plane graph shows an exponential decay function f(x) passing through (0,4) and (1,2). Which equation matches the graph?
f(x)=2x
f(x)=4(21)x (correct answer)
f(x)=4⋅2x
f(x)=2(21)x
Explanation: The exponential function passes through (0, 4) and (1, 2), showing decay since the y-values decrease as x increases. For exponential functions f(x) = a·b^x, the point (0, 4) gives us a = 4. Using point (1, 2): 2 = 4·b^1, so b = 1/2. Therefore, f(x) = 4(1/2)^x. This matches option B. To verify the decay: as x increases, (1/2)^x decreases since the base is between 0 and 1. A common mistake is confusing growth and decay functions, or using 2^x instead of (1/2)^x. When identifying exponential functions from graphs, always check whether y-values increase (growth) or decrease (decay) as x increases.
Question 10
The coordinate-plane graph shows f(x) as a line segment from (−4,2) to (2,−1) with solid endpoints. What is the domain of the graphed function?
[−4,2] (correct answer)
[−1,2]
(−4,2)
[−4,−1]
Explanation: The graph shows a line segment from (-4, 2) to (2, -1) with solid endpoints. The domain of a function is the set of all possible x-values. Looking at the x-coordinates, the segment extends from x = -4 to x = 2. Since the endpoints are solid (filled in), both -4 and 2 are included in the domain. Therefore, the domain is [-4, 2], using square brackets to indicate inclusion of endpoints. A common mistake is giving the range [-1, 2] instead of the domain, or using parentheses (-4, 2) which would exclude the endpoints. When finding domain from a graph, focus on the horizontal extent and pay attention to whether endpoints are included (solid dots) or excluded (open circles).
Question 11
The graph of a rational function f(x) is shown on a coordinate plane. It has a vertical asymptote at x=1 and a horizontal asymptote at y=2, and it passes through (0,1). Which equation could be the graphed function? (Misreading asymptotes leads to convincing distractors.)
f(x)=x−11+2 (correct answer)
f(x)=x+11+2
f(x)=x−11−2
f(x)=x−12+1
Explanation: The rational function has a vertical asymptote at x = 1, horizontal asymptote at y = 2, and passes through (0, 1). A vertical asymptote at x = 1 means the denominator has factor (x - 1). A horizontal asymptote at y = 2 suggests the function has form f(x) = 1/(x - 1) + 2. Let's verify with point (0, 1): f(0) = 1/(0 - 1) + 2 = 1/(-1) + 2 = -1 + 2 = 1 ✓. This confirms option A is correct. Common errors include confusing vertical and horizontal asymptotes, or using the wrong sign in the denominator. When dealing with rational functions, always verify your equation using a known point on the graph.
Question 12
A coordinate plane graph shows two curves: f(x) and g(x). The curve f(x) is the parabola with vertex at (0,0) opening upward. The curve g(x) has the same shape but its vertex is at (0,2). Which relationship between the functions is correct? Confusing vertical and horizontal shifts is a common trap.
g(x)=f(x−2)
g(x)=f(x)+2 (correct answer)
g(x)=f(x+2)
g(x)=−f(x)+2
Explanation: We need to identify the transformation from f(x) with vertex at (0, 0) to g(x) with vertex at (0, 2), where both parabolas have the same shape. Since g(x) has the same shape as f(x) but its vertex is shifted from (0, 0) to (0, 2), this is a vertical shift up by 2 units. This transformation is represented by g(x) = f(x) + 2. Common errors include confusing vertical and horizontal shifts: g(x) = f(x - 2) would shift right 2 units, while g(x) = f(x + 2) would shift left 2 units. Remember that transformations outside the function affect y-values (vertical), while transformations inside affect x-values (horizontal).
Question 13
The coordinate plane shows f(x) as a parabola opening upward with vertex at (−1,1). The graph passes through (0,3) and (−2,3). What is the axis of symmetry of the parabola? If you confuse axis of symmetry with an intercept, you may pick y=1 instead.
y=1
x=−1 (correct answer)
y=−1
x=1
Explanation: We need to find the axis of symmetry of a parabola with vertex at (-1, 1) that passes through (0, 3) and (-2, 3). The axis of symmetry of a parabola is a vertical line that passes through the vertex, given by x = h where (h, k) is the vertex. Since the vertex is at (-1, 1), the axis of symmetry is x = -1. The fact that points (0, 3) and (-2, 3) have the same y-value confirms they are equidistant from x = -1. A common error is confusing the axis of symmetry with a horizontal line through the vertex, which would be y = 1.
Question 14
A coordinate plane graph shows a piecewise linear function made of two line segments: one from (−4,−1) to (0,3) and another from (0,3) to (4,−1). The graph forms an upside-down V with a peak at (0,3). Which equation matches the graph? A sign error can flip the V upward.
f(x)=−∣x∣+3 (correct answer)
f(x)=∣x∣+3
f(x)=−∣x−3∣
f(x)=∣x∣−3
Explanation: We need to find the equation for an upside-down V-shaped graph with peak at (0, 3). The graph forms an inverted V with vertex at (0, 3) and passes through (-4, -1) and (4, -1), indicating a downward-opening absolute value function. The general form is f(x) = -a|x| + 3 where a > 0. Using point (4, -1): -1 = -a|4| + 3 = -4a + 3, which gives -4a = -4, so a = 1. Therefore, f(x) = -|x| + 3. The negative coefficient flips the V upside down, and the +3 shifts it up. A common error is forgetting the negative sign, which would give f(x) = |x| + 3, an upward-opening V. Always verify the coefficient sign matches the orientation shown in the graph.
Question 15
A coordinate plane graph shows f(x) as a parabola opening upward with x-intercepts at x=−4 and x=0. The vertex is midway between them at x=−2 and lies at y=−4. What is the minimum value of f(x)?
−4 (correct answer)
−2
0
4
Explanation: We need to find the minimum value of an upward-opening parabola with vertex at (-2, -4). The graph shows a parabola opening upward with x-intercepts at -4 and 0, and vertex at (-2, -4). For an upward-opening parabola, the vertex represents the minimum point, so the minimum value is the y-coordinate of the vertex, which is -4. We can verify this is correct: the vertex x-coordinate (-2) is indeed the midpoint between the x-intercepts: (-4 + 0)/2 = -2. A common error is reporting the x-coordinate of the vertex (-2) as the minimum value, but we need the y-coordinate. For upward-opening parabolas, always identify the vertex's y-coordinate as the minimum value.
Question 16
A coordinate plane graph shows the line f(x) passing through (0,1) and (2,5). Let g(x)=f(x−3). Which point must lie on the graph of g(x)? Shifting the wrong direction gives a tempting distractor.
(−3,1)
(6,1)
(3,1) (correct answer)
(0,1)
Explanation: We need to find a point on g(x) = f(x - 3) where f(x) passes through (0, 1) and (2, 5). The transformation g(x) = f(x - 3) shifts the graph of f(x) right by 3 units, so every point (a, b) on f becomes (a + 3, b) on g. Since (0, 1) is on f(x), the corresponding point on g(x) is (0 + 3, 1) = (3, 1). We can verify: if f(0) = 1, then g(3) = f(3 - 3) = f(0) = 1. A common error is shifting left instead of right, which would give (-3, 1). Remember that f(x - 3) shifts right by 3, while f(x + 3) shifts left by 3.
Question 17
A coordinate plane graph shows f(x) as a parabola opening upward with vertex at (2,1) and passing through (3,3). Let g(x)=−f(x). Which point must lie on the graph of g(x)?
(−3,3)
(3,−3) (correct answer)
(3,3)
(2,−1)
Explanation: We need to find a point on g(x) = -f(x) where f(x) is a parabola with vertex at (2, 1) passing through (3, 3). The transformation g(x) = -f(x) reflects the graph of f(x) across the x-axis, changing the sign of all y-values while keeping x-values the same. Since (3, 3) is on f(x), we have f(3) = 3, so g(3) = -f(3) = -3. Therefore, (3, -3) is on g(x). A common error is reflecting across the y-axis (which would change x-values) instead of the x-axis. Remember that -f(x) negates y-values only, creating a reflection across the x-axis.
Question 18
A coordinate plane graph shows f(x) as a square-root curve with endpoint at (−1,0) and passing through (3,2). The curve increases slowly to the right and is defined only for x≥−1. What is the domain of f(x)? Misreading the endpoint as an x-intercept at a different location can change the answer.
x≥−1 (correct answer)
x≤−1
All real x
x≥0
Explanation: We need to find the domain of a square root function with endpoint at (-1, 0). The graph shows a square root curve starting at (-1, 0) and extending to the right, existing only for x ≥ -1. For square root functions, the domain is restricted to where the expression under the radical is non-negative. Since the curve starts at x = -1 and continues to the right, the domain is x ≥ -1. A common error is misreading the endpoint location or thinking the domain starts at x = 0 because that's where the basic square root function starts. When finding domains of radical functions, identify the leftmost point where the function begins.
Question 19
A coordinate plane graph shows f(x) as a square-root curve that starts at (1,−2) and increases to the right, passing through (5,0). The curve exists only for x≥1. Which equation matches the graph?
f(x)=x−1−2 (correct answer)
f(x)=x+1−2
f(x)=x−1+2
f(x)=−x−1−2
Explanation: We need to find the equation of a square root function starting at (1, -2). The graph shows a square root curve with its starting point (domain restriction) at (1, -2), indicating a horizontal shift right 1 unit and vertical shift down 2 units. The general form is f(x) = a√(x - h) + k where (h, k) is the starting point, giving f(x) = a√(x - 1) - 2. Since the curve passes through (5, 0), we substitute: 0 = a√(5 - 1) - 2, which gives 0 = 2a - 2, so a = 1. Therefore, f(x) = √(x - 1) - 2. A common error is shifting left instead of right, writing √(x + 1) when the starting point is at x = 1. Remember that √(x - 1) shifts the basic square root function right by 1 unit.
Question 20
A coordinate plane graph shows f(x) as a V-shaped absolute value graph with vertex at (−2,1). The graph passes through the point (0,3) and has the usual slopes of ±1 on each side. Which equation matches the graph?
f(x)=∣x+2∣+1 (correct answer)
f(x)=∣x−2∣+1
f(x)=∣x+2∣−1
f(x)=−∣x+2∣+1
Explanation: We need to find the equation of an absolute value function with vertex at (-2, 1). The V-shaped graph has its vertex (sharp point) at (-2, 1) and opens upward, indicating a positive coefficient. The general form is f(x) = a|x - h| + k where (h, k) is the vertex, so we have f(x) = a|x - (-2)| + 1 = a|x + 2| + 1. Since the graph passes through (0, 3), we substitute: 3 = a|0 + 2| + 1, which gives 3 = 2a + 1, so a = 1. Therefore, f(x) = |x + 2| + 1. A common mistake is confusing the shift direction: |x + 2| shifts left 2 units, not right. When the vertex is at x = -2, you need x + 2 inside the absolute value, not x - 2.