Practice Graphing Functions in PSAT Math with focused quiz questions that help you check what you know, review explanations, and build confidence with test-style prompts.
What this quiz covers
This quiz focuses on Graphing Functions, giving you a quick way to practice the rules, question types, and explanations that matter most for PSAT Math.
How to use this quiz
Try each quiz question before looking at the correct answer. Use the explanations to review missed ideas, then come back to similar questions until the pattern feels familiar.
All questions
Question 1
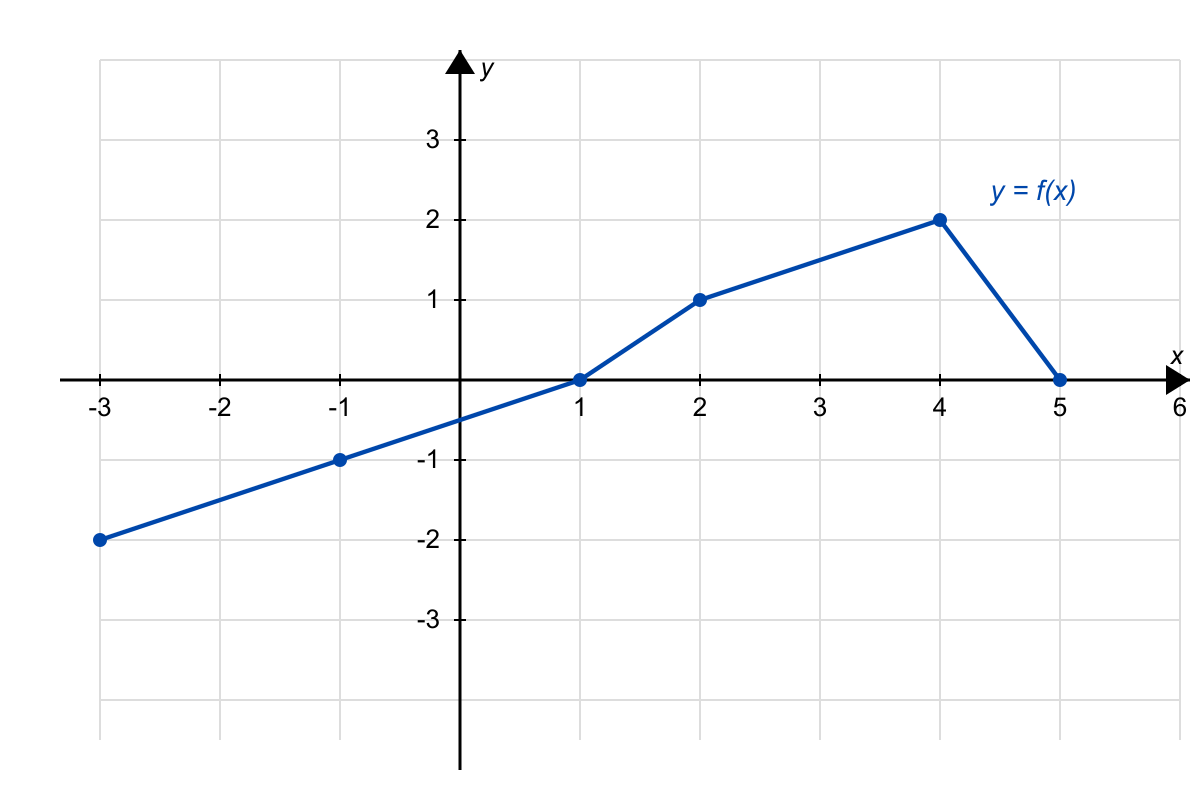
The graph of y=f(x) shown consists of line segments. What is the value of f−1(2)+f−1(−1)?
−1
1
3 (correct answer)
5
Explanation: f−1(2) is the x-value where f(x)=2. From the graph, f(x)=2 at x=4. f−1(−1) is where f(x)=−1, which occurs at x=−1. Sum: 4+(−1)=3. A confuses inverse with negation; B reads coordinates as (input, input); D swaps inputs and outputs incorrectly.
Question 2
The graph shown represents the function f(x)=a(x−h)2+k, where a, h, and k are constants. Based on the graph, what is the value of f(1)+f(5)?
−6
−4
0 (correct answer)
4
Explanation: From the graph, the parabola has vertex at (3, -4) and x-intercepts at x = 1 and x = 5. This means f(1) = 0 and f(5) = 0. Therefore, f(1) + f(5) = 0 + 0 = 0. This can also be verified by the symmetry property: since the axis of symmetry is x = 3, and points x = 1 and x = 5 are equidistant from this axis, f(1) = f(5).
Question 3
Based on the graph of the polynomial function p(x) shown, which of the following could be the equation for p(x)?
p(x)=−41(x+2)(x−1)2(x−4) (correct answer)
p(x)=41(x+2)(x−1)2(x−4)
p(x)=−41(x+2)(x−1)(x−4)2
p(x)=41(x−2)(x+1)2(x+4)
Explanation: The graph shows zeros at x = -2 (crosses axis), x = 1 (touches axis, indicating multiplicity 2), and x = 4 (crosses axis). This gives the factored form (x+2)(x-1)²(x-4). The end behavior shows that as x → +∞, y → -∞, indicating a negative leading coefficient. Therefore, the equation is p(x) = -¼(x+2)(x-1)²(x-4).
Question 4
The graph of y=f(x) is shown. Let h(x)=2f(2x). What is the value of h(4)?
−6
−3
6 (correct answer)
12
Explanation: h(4)=2f(4/2)=2f(2). From the graph, f(2)=3, so h(4)=2(3)=6. A negates incorrectly; B forgets to multiply by 2; D uses f(4) instead of f(2).
Question 5
The figure shows the graph of y=f(x). For how many values of x in the interval −5≤x≤5 does f(x)=f(−x)?
One
Two
Three (correct answer)
Infinitely many
Explanation: f(x)=f(−x) when a point and its reflection across the y-axis have the same y-value. From the graph, this happens at x=0 (trivially), and at the two x-values where the graph intersects its reflection. Checking the graph: the values x=−3 and x=3 give matching y-values (both 1), and x=0 works. That gives 3 values. A common error is counting only the nonzero matches (2) or missing the symmetric pair.
Question 6
The figure shows the graph of y=f(x), a quadratic function. The function g is defined by g(x)=f(x)+k for some constant k. If the graph of g has exactly one x-intercept, what is the value of k?
−4
−2
2
4 (correct answer)
Explanation: The graph of f is an upward parabola with vertex at (1,−4). Adding k shifts the graph vertically by k. For exactly one x-intercept, the vertex must lie on the x-axis: −4+k=0, so k=4. A is the y-coordinate of vertex (wrong sign); B and C misidentify the shift needed.
Question 7
The graphs of y=f(x) and y=g(x) are shown on the same coordinate plane. For how many integer values of x in −4≤x≤4 is f(x)>g(x)?
Three
Four (correct answer)
Five
Six
Explanation: To find where f(x) > g(x), we need to identify the x-values where the graph of f lies above the graph of g. Checking each integer from -4 to 4: f(x) > g(x) occurs at x = -4, -3, 2, and 3. At the other integer values, either g(x) > f(x) or the functions are equal. Therefore, there are 4 integer values where f(x) > g(x).
Question 8
Refer to the graph of y=f(x). Which of the following equations could represent the function shown?
f(x)=x+3−2 (correct answer)
f(x)=x−3−2
f(x)=−x+3−2
f(x)=−(x+3)−2
Explanation: The graph is a square root curve starting at (−3,−2) and increasing to the right. The starting point (−3,−2) means the basic x was shifted left 3 and down 2: f(x)=x+3−2. B has wrong horizontal shift; C has wrong orientation (decreasing); D has wrong direction (opens left).
Question 9
A coordinate plane shows the graph of f(x) as an increasing line that crosses the y-axis at −1 and passes through (2,3). If g(x)=f(x−3), which change occurs to the graph when moving from f to g?
Shift left 3 units
Shift right 3 units (correct answer)
Shift up 3 units
Reflect across y-axis
Explanation: The question asks how g(x) = f(x - 3) transforms the graph of f(x), where f(x) is a line crossing the y-axis at -1 and passing through (2, 3). When we have g(x) = f(x - 3), this represents a horizontal shift of the graph. The transformation x - 3 inside the function shifts the graph right by 3 units (counterintuitively, subtracting inside shifts right). Every point (x, y) on f becomes (x + 3, y) on g. For example, the y-intercept (0, -1) becomes (3, -1), and the point (2, 3) becomes (5, 3). A common error is thinking that f(x - 3) shifts left because of the minus sign, but remember: inside the function, minus means right.
Question 10
On the coordinate plane, the graph of f(x) is a V-shaped absolute value function with vertex at (2,−1). The right branch passes through (4,3). If g(x)=f(x)+2, which graph represents g(x)? Select the option that correctly describes the transformation shown by the new graph.
Shift down 2 units
Shift up 2 units (correct answer)
Shift right 2 units
Reflect across x-axis
Explanation: The question asks how the graph of g(x) = f(x) + 2 relates to the graph of f(x), where f(x) is an absolute value function with vertex at (2, -1). When we add a constant to a function, it shifts the entire graph vertically by that amount - adding 2 shifts the graph up 2 units. The original vertex at (2, -1) becomes (2, 1) in the transformed function, and the point (4, 3) becomes (4, 5). A common mistake is confusing vertical shifts (adding/subtracting outside the function) with horizontal shifts (adding/subtracting inside the function). Remember that g(x) = f(x) + k shifts vertically, while g(x) = f(x + k) shifts horizontally.
Question 11
The coordinate plane shows a rational function with a vertical asymptote at x=1 and a horizontal asymptote at y=0. The curve is in Quadrant I for x>1 and in Quadrant III for x<1, and it passes through (2,1). Which equation matches the graph? (Sign errors can swap the branches.)
y=x+11
y=x−11 (correct answer)
y=−x−11
y=x1−1
Explanation: The question asks for the equation of a rational function with vertical asymptote at x=1, horizontal at y=0, in quadrants I and III, passing through (2,1). The graph shows branches approaching x=1 from both sides without crossing, hugging y=0 at extremes, positive in quadrant I for x>1 and negative in quadrant III for x<1. The form y = 1/(x - h) has asymptote at x=h=1, and at x=2, 1/(2-1)=1, matching the point and quadrant placements. The positive reciprocal connects the visual asymptotes and signs to the algebraic denominator shift. Key errors include sign flips, as in C, which places branches in quadrants II and IV, or wrong asymptote shifts like A at x=-1. Misinterpreting the horizontal asymptote might lead to D, which shifts vertically. Always check a test point and asymptote positions to match the graph.
Question 12
A coordinate plane graph shows an exponential curve that passes through (0,1) and increases to the right. It also appears to pass near (1,2) and (2,4). Which equation best matches the graph? (If the scale is misread, 2x and 3x can look similar for small x.)
y=3x
y=2x (correct answer)
y=(21)x
y=2x−1
Explanation: The question seeks the equation for an exponential graph passing through (0,1), increasing rightward, and near (1,2) and (2,4). The curve starts at y=1 on the y-axis, rises steeply to the right, and shows growth consistent with base greater than 1, without a horizontal asymptote visible above y=0. Evaluating y = 2^x gives 2^0 = 1, 2^1 = 2, and 2^2 = 4, aligning perfectly with the points and connecting the visual growth to the exponential base. For comparison, y = 3^x at x=1 is 3, overshooting the near-point at 2. A common error is misreading the scale, confusing 2^x with 3^x for small x, or selecting decaying functions like C. Another mistake is choosing shifted versions like D, which passes through (0,0.5). To verify exponentials, check key points like the y-intercept and integer inputs against the graph.
Question 13
On the coordinate plane, the graph of a parabola opens upward and has vertex at (2,−1). It passes through the point (0,3). Which equation matches this graph? (Watch for confusing a horizontal shift with a vertical shift, since both can place the curve near the same points.)
y=(x−2)2−1 (correct answer)
y=(x+2)2−1
y=(x−2)2+1
y=−(x−2)2−1
Explanation: The question requires identifying the quadratic equation for a parabola opening upward with vertex at (2,-1) and passing through (0,3). The graph displays a U-shaped curve with its lowest point at (2,-1), symmetric about x=2, and extending upward, visible through the given point shifting leftward to a higher y-value. The vertex form y = (x - h)^2 + k fits with (h,k) = (2,-1), giving y = (x - 2)^2 - 1; substituting x=0 yields ( -2)^2 - 1 = 3, confirming the point. The positive coefficient ensures it opens upward, connecting the visual minimum to the algebraic representation. Common errors include reversing the horizontal shift, as in B with vertex at (-2,-1), or changing the vertical shift sign, like C raising it to (2,1). Misinterpreting the opening direction might lead to D, which opens downward. A useful strategy is to plug in the given point after identifying the vertex to verify the equation.
Question 14
The coordinate plane shows an exponential curve that passes through the labeled points (0,2) and (1,4). The graph increases as x increases and approaches y=0 as x becomes very negative. Which equation matches the graph?
y=2⋅2x (correct answer)
y=4⋅2x
y=2⋅(21)x
y=2x+2
Explanation: The question seeks the equation of an exponential curve passing through (0,2) and (1,4), increasing with x and approaching y=0 as x decreases. The graph displays a rising curve from near the x-axis on the left, through the given points, characteristic of exponential growth with base greater than 1. Substituting points into y = a * b^x gives a=2, b=2 for y=2*2^x, matching both points and the asymptotic behavior to y=0, connecting the visual growth to the base-2 exponent. This aligns with the graphed features. Common mistakes include incorrect bases leading to decay like choice C, or vertical shifts mismatched to points as in choice D. For exponential graphs, test points in the options to verify fit with the curve's direction and asymptote.
Question 15
A coordinate plane graph shows the function f(x) as a line passing through (0,2) and (4,0). The function g(x) is defined by g(x)=f(x)−3. Which graph best represents g(x) compared to f(x)?
Shift up 3 units
Shift down 3 units (correct answer)
Shift right 3 units
Reflect over x-axis
Explanation: We need to determine how g(x) = f(x) - 3 transforms the graph of f(x). The transformation g(x) = f(x) - 3 subtracts 3 from every y-value of f(x), which shifts the entire graph down by 3 units. Since f(x) passes through (0, 2), g(x) will pass through (0, 2 - 3) = (0, -1). Similarly, since f(x) passes through (4, 0), g(x) will pass through (4, 0 - 3) = (4, -3). This confirms a downward shift of 3 units. A common error is thinking that subtracting from the function shifts it up, but remember: adding to f(x) shifts up, subtracting shifts down. For quick verification on tests, pick any point on the original graph and apply the transformation.
Question 16
A coordinate plane graph shows a function with a horizontal asymptote at y=2. The curve passes through (0,3) and decreases toward y=2 as x increases. Which equation best matches the graph? (If you miss the asymptote, you might choose an unshifted exponential.)
y=2x+2
y=(21)x+2 (correct answer)
y=(21)x−2
y=2x−2
Explanation: The question requires the equation for a graph with horizontal asymptote y=2, passing through (0,3), decreasing toward 2 as x increases. The curve approaches y=2 from above without crossing, starting higher at x=0 and flattening rightward, indicating exponential decay shifted up. y = (1/2)^x + 2 fits: at x=0, 1 + 2 = 3; as x→∞, (1/2)^x →0, y→2, matching decay and asymptote. The base less than 1 ensures decreasing, connecting visual approach to algebraic form. Missing the asymptote might lead to unshifted A or D; sign errors select C, which goes below. Confusing growth with decay picks increasing options. Check y-intercept and long-term behavior to confirm exponentials.
Question 17
The graph of a line is shown on a coordinate plane. It crosses the y-axis at −2 and the x-axis at 4. Which equation represents the line? (A common error is using the reciprocal slope from swapping rise and run.)
y=21x−2 (correct answer)
y=−21x−2
y=21x+2
y=−2x−2
Explanation: The question asks for the line equation crossing the y-axis at -2 and x-axis at 4. The graph depicts a straight line with positive slope, intersecting axes at these points, visible as it rises from the negative y-axis to the positive x-axis. Using intercepts, the slope is rise over run: from (0,-2) to (4,0), that's 2/4 = 1/2, so y = (1/2)x - 2, connecting the visual crossings to slope-intercept form. Verifying, at x=4, (1/2)*4 - 2 = 0, and y-intercept is -2. A frequent error is inverting the slope to 2, perhaps leading to steeper lines like D, or sign errors giving negative slopes like B. Confusing intercept signs might select C with +2. Calculate slope directly from intercepts to avoid reciprocal mistakes.
Question 18
On the coordinate plane, the graph of a function f(x) is shown as a V-shaped absolute value graph. A new function is defined by g(x)=f(x−2). Which statement describes how the graph changes from f to g? Watch the sign inside the parentheses: it is often reversed when interpreting shifts.
Shift left 2 units
Shift right 2 units (correct answer)
Shift up 2 units
Shift down 2 units
Explanation: This question tests understanding of horizontal shifts in function transformations. The transformation g(x)=f(x−2) involves replacing x with (x−2) inside the function. This shifts the entire graph horizontally: every point (x,y) on the original graph becomes (x+2,y) on the new graph, shifting RIGHT by 2 units. The key insight is that f(x−2) shifts right (positive direction) even though we see a minus sign. Students often think the minus means shift left, but inside the function, signs work opposite to intuition. To verify, pick a point on f: if (0,3) is on f, then (2,3) is on g because g(2)=f(2−2)=f(0)=3.
Question 19
A coordinate plane shows the graph of a quadratic function f(x). The parabola opens upward and has a vertex at (−1,−4). It crosses the x-axis at x=−3 and x=1. Which equation matches the graphed function? Choose the equation whose graph has the same vertex and intercepts.
f(x)=(x+1)2−4
f(x)=(x+3)(x−1) (correct answer)
f(x)=(x−1)2−4
f(x)=−(x+3)(x−1)
Explanation: The question asks us to identify which equation matches a parabola with vertex at (-1, -4) that crosses the x-axis at x = -3 and x = 1. Looking at the graph features, we have an upward-opening parabola with x-intercepts at -3 and 1, which means the function can be written in factored form as f(x) = a(x + 3)(x - 1) where a > 0. Since the parabola opens upward, a must be positive, and we can verify that f(x) = (x + 3)(x - 1) expands to f(x) = x² + 2x - 3. To check the vertex, we find x = -b/2a = -2/2 = -1, and f(-1) = (-1)² + 2(-1) - 3 = -4, confirming the vertex is at (-1, -4). A common error is confusing the vertex form with the factored form or making sign errors with the x-intercepts. When given x-intercepts, the factored form is often the quickest path to the answer.
Question 20
A coordinate plane graph shows a rational function r(x) with a vertical asymptote at x=1 and a horizontal asymptote at y=0. The curve passes through the labeled point (2,1). Which equation matches the graph of r(x)?
r(x)=x−11 (correct answer)
r(x)=x+11
r(x)=x−11+1
r(x)=x−1−1
Explanation: We need to identify a rational function with vertical asymptote at x = 1, horizontal asymptote at y = 0, and passing through (2, 1). A vertical asymptote at x = 1 means the denominator equals zero when x = 1, suggesting a factor of (x - 1) in the denominator. A horizontal asymptote at y = 0 indicates the degree of the numerator is less than the denominator's degree. The simplest form is r(x) = a/(x - 1) for some constant a. Using the point (2, 1): 1 = a/(2 - 1) = a/1, so a = 1. Therefore, r(x) = 1/(x - 1). This matches choice A and can be verified by checking the asymptotes and the given point. When matching rational functions to graphs, always start by identifying asymptotes to narrow down the possibilities.