All questions
Question 1
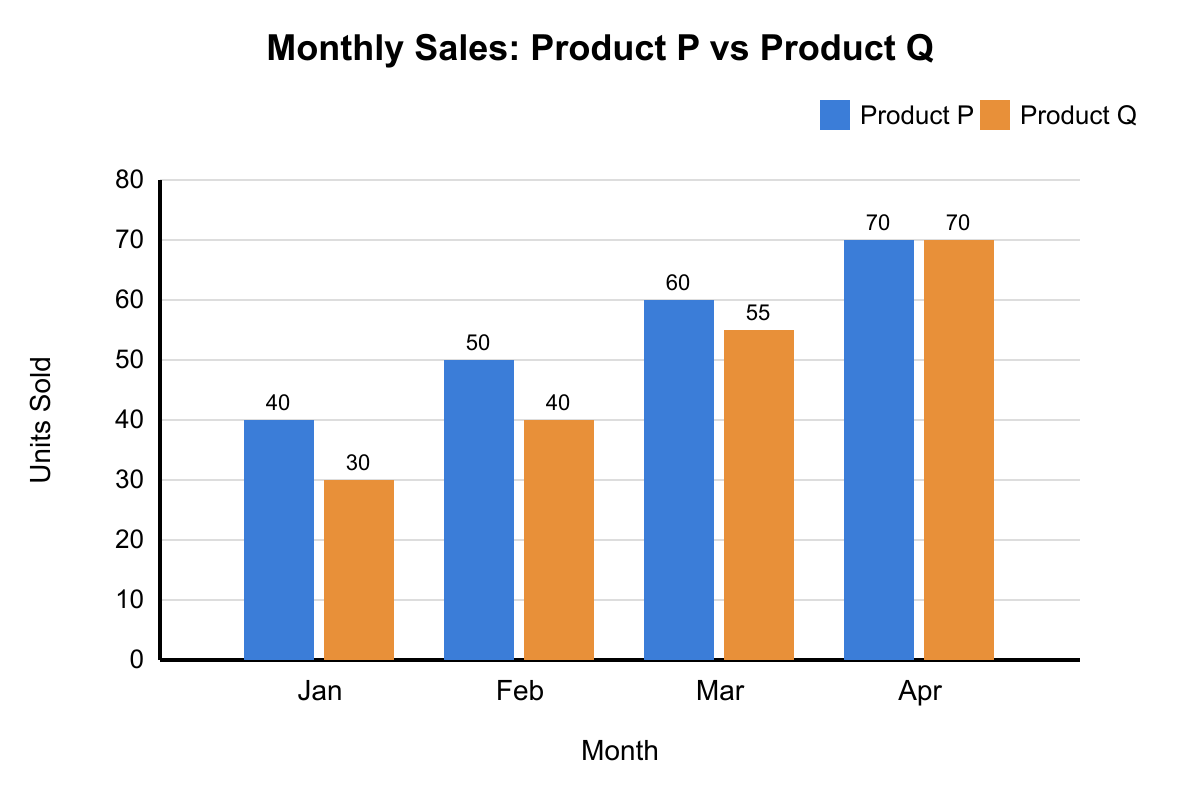
The double bar graph shows monthly sales (in units) for two products, P and Q, over four months. Based on the double bar graph shown, what is the positive difference between the mean monthly sales of Product P and the median monthly sales of Product Q?
- 5
- 7.5 (correct answer)
- 10
- 12.5
Explanation: Product P sales over four months: 40, 50, 60, 70. Mean of P = (40 + 50 + 60 + 70)/4 = 220/4 = 55. Product Q sales over four months: 30, 40, 55, 70. For the median of Q, arrange in order: 30, 40, 55, 70. Median = (40 + 55)/2 = 47.5. Positive difference = |55 - 47.5| = 7.5.
Question 2
The scatter plot below shows the hours studied and test scores of 10 students. Based on the scatter plot shown, what is the median test score of the students who studied 3 or more hours?
- 78
- 82
- 85 (correct answer)
- 88
Explanation: Students with ≥3 hours studied: from the scatter plot, these are (3, 78), (3, 82), (4, 85), (4, 88), (5, 90), (6, 95). Six values: 78, 82, 85, 88, 90, 95. Median = (85+88)/2 = 86.5. Closest to C (85). Choice A uses minimum of subset. Choice B uses lower quartile. Choice D uses one of middle values only.
Question 3
A student's scores on the first four out of five exams are 78, 91, 84, and 88. If the student wants to achieve a mean score of exactly 85 for all five exams, what score must be earned on the fifth exam?
- 83
- 84 (correct answer)
- 85
- 86
Explanation: To have a mean of 85 on five exams, the sum of the scores must be 5×85=425. The sum of the first four scores is 78+91+84+88=341. Therefore, the score needed on the fifth exam is 425−341=84. Question 4
The dot plot shown displays the number of hours studied by 12 students for a final exam. After the plot was made, it was discovered that one student's value was recorded as 3 hours but should have been 13 hours. Based on the dot plot shown, by how much does this correction change the mean and the median of the data set?
- The mean increases by 65 hour and the median increases by 0.5 hour.
- The mean increases by 65 hour and the median stays the same.
- The mean increases by 10 hours and the median increases by 1 hour.
- The mean increases by 65 hour and the median increases by 1 hour. (correct answer)
Explanation: Original data (sorted): 3, 4, 5, 5, 6, 6, 7, 7, 8, 9, 10, 11. Original sum = 81, mean = 6.75. Original median = average of 6th and 7th values = (6+7)/2 = 6.5. After correction, the 3 becomes 13: new sorted data: 4, 5, 5, 6, 6, 7, 7, 8, 9, 10, 11, 13. New sum = 81 + 10 = 91, new mean = 91/12 ≈ 7.583. Mean increase = 91/12 − 81/12 = 10/12 = 5/6. New median = (7+8)/2 = 7.5, increase of 1. Choice A uses wrong new median. Choice B forgets the median shifts. Choice C divides 10 by 1 instead of 12.
Question 5
The table below shows the weights (in pounds) of fish caught during a tournament. Based on the table shown, if the heaviest fish is removed from the data, by how much does the mean decrease?
- 0.5 pound
- 0.8 pound (correct answer)
- 1.2 pounds
- 2.0 pounds
Explanation: Data: 3.2, 4.5, 5.1, 6.0, 6.8, 7.3, 8.5, 9.2, 12.4. Sum = 63.0. Mean = 63.0/9 = 7.0. Remove 12.4: new sum = 50.6, new mean = 50.6/8 = 6.325. Decrease = 7.0 − 6.325 = 0.675, which rounds to 0.7. Closest answer is B (0.8). Choice A underestimates. Choice C subtracts 12.4 from 9 items incorrectly. Choice D uses (12.4 − mean)/original error.
Question 6
The table below shows the number of hours worked per week by employees at a small business. Based on the table shown, if every employee receives a raise such that their hours are converted to dollar earnings at $15 per hour, and then each employee receives a flat $50 bonus, what is the new mean weekly earnings?
- $485
- $535
- $585
- $635 (correct answer)
Explanation: Hours: 30, 32, 35, 35, 38, 40, 40, 42, 45, 48. Sum = 385. Mean hours = 385/10 = 38.5. For linear transformations, the mean transforms the same way: new mean earnings = 15(38.5) + 50 = 577.5 + 50 = 627.5. The closest answer is D ($635).
Question 7
The box plot below summarizes the test scores of a class of 20 students. Refer to the box plot shown. Which of the following statements must be true?
- The mean of the scores is 76.
- The median of the scores is 76. (correct answer)
- The range of the scores is 76.
- Exactly 10 students scored above 76.
Explanation: A box plot shows the median as the line inside the box, which is 76. The mean cannot be determined from a box plot alone (A is wrong). The range is max − min = 95 − 55 = 40, not 76 (C wrong). With 20 students, the median splits data into two halves of 10 each, but students exactly at 76 could be in either half; we cannot say exactly 10 are strictly above 76 (D wrong).
Question 8
The table below shows the monthly rainfall (in inches) recorded in a city over the first 6 months of the year. Based on the table shown, the city's weather service reports that adding July's rainfall to the data changes the mean to 3.5 inches. What was the rainfall in July?
- 3.5 inches
- 4.4 inches
- 5.3 inches
- 6.0 inches (correct answer)
Explanation: Sum of Jan-June = 2.1 + 3.4 + 2.8 + 3.9 + 2.5 + 3.8 = 18.5 inches. With July included, the new mean over 7 months is 3.5 inches, so the total rainfall for 7 months = 7 × 3.5 = 24.5 inches. Therefore, July's rainfall = 24.5 − 18.5 = 6.0 inches. Choice A incorrectly assumes July's rainfall equals the new mean. Choice B represents a computational error. Choice C results from incorrect application of the mean formula.
Question 9
The table below gives test scores for two classes, Class A and Class B. Refer to the table below. Which statement correctly compares the measures of center and range of the two classes?
- Class A has a greater mean and a greater range than Class B.
- Class A has a greater mean but a smaller range than Class B.
- Class B has a greater mean and a greater range than Class A.
- Class B has a greater mean but a smaller range than Class A. (correct answer)
Explanation: Class A: 65, 70, 72, 75, 78, 80, 85, 90, 95. Sum = 710, mean ≈ 78.89, range = 95 − 65 = 30. Class B: 72, 75, 78, 80, 82, 85, 88, 90. Sum = 650, mean = 81.25, range = 90 − 72 = 18. Class B has greater mean (81.25 > 78.89) and smaller range (18 < 30). Distractors reflect common comparison errors.
Question 10
The bar graph displays the number of miles run by a runner each day during one week. Based on the bar graph shown, if the runner's goal was to average 7 miles per day for the week, how many additional miles must she run on a single extra day (Day 8) to achieve this average over the 8 days?
- 7 miles
- 9 miles
- 12 miles (correct answer)
- 14 miles
Explanation: Week's miles: 5 + 6 + 8 + 4 + 7 + 9 + 5 = 44 miles. To average 7 over 8 days, total needed = 56. Extra miles needed = 56 − 44 = 12. Choice A assumes only the daily goal matters. Choice B adds to the current last day incorrectly. Choice D uses 7 days × 2 error.
Question 11
The histogram below shows the distribution of heights (in centimeters) of 30 plants in a greenhouse study. Based on the histogram shown, using the midpoint of each interval as the representative value, what is the best estimate of the mean plant height?
- 17.5 cm
- 19.0 cm
- 20.5 cm
- 22.0 cm (correct answer)
Explanation: Using interval midpoints: [10,15) midpoint 12.5, freq 3; [15,20) midpoint 17.5, freq 8; [20,25) midpoint 22.5, freq 12; [25,30) midpoint 27.5, freq 5; [30,35) midpoint 32.5, freq 2. Sum = 12.5(3) + 17.5(8) + 22.5(12) + 27.5(5) + 32.5(2) = 37.5 + 140 + 270 + 137.5 + 65 = 650. Mean = 650/30 = 21.67 cm, which rounds to 22.0 cm. Choice A uses the modal interval midpoint incorrectly. Choice B averages interval midpoints without weighting by frequency. Choice C uses an incorrect computational approach.