Middle School Math Quiz: Analyze And Sketch Function Graphs
Practice Analyze And Sketch Function Graphs in Middle School Math with focused quiz questions that help you check what you know, review explanations, and build confidence with test-style prompts.
What this quiz covers
This quiz focuses on Analyze And Sketch Function Graphs, giving you a quick way to practice the rules, question types, and explanations that matter most for Middle School Math.
How to use this quiz
Try each quiz question before looking at the correct answer. Use the explanations to review missed ideas, then come back to similar questions until the pattern feels familiar.
All questions
Question 1
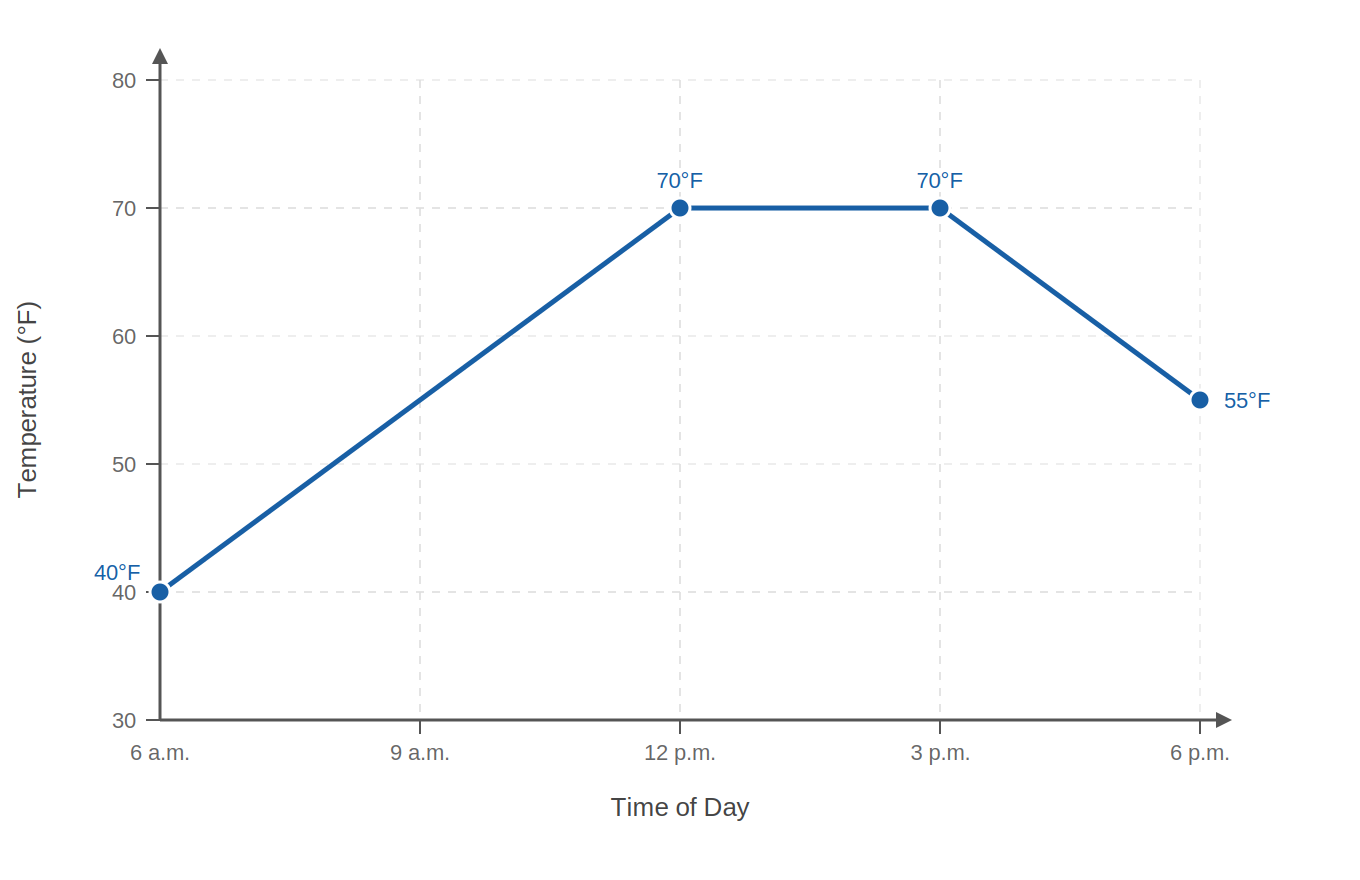
A student records the temperature outside from 6 a.m. to 6 p.m. The temperature changes like this:
From 6 a.m. to 12 p.m., it increases at a constant rate from 40∘F to 70∘F.
From 12 p.m. to 3 p.m., it stays constant at 70∘F.
From 3 p.m. to 6 p.m., it decreases at a constant rate to 55∘F.
Which graph best represents temperature (y) versus time (x)?
Stays flat 6–12, rises linearly 12–3, then drops linearly 3–6
Rises linearly from 6–12, stays flat 12–3, then drops linearly 3–6 (correct answer)
Rises linearly from 6–12, then curves upward 12–3, then drops linearly 3–6
Drops linearly from 6–12, stays flat 12–3, then rises linearly 3–6
Explanation: This question tests sketching graphs from qualitative descriptions, focusing on increasing/decreasing behaviors, linear segments, and constant intervals over time. Sketching involves reading the description for behaviors like linear increase from 6 a.m. to 12 p.m. (graph rises straight from 40°F to 70°F), constant from 12 p.m. to 3 p.m. (flat line at 70°F), and linear decrease from 3 p.m. to 6 p.m. (straight drop to 55°F), then drawing straight lines connecting these key points accordingly. For example, a temperature starting at 40°F, increasing linearly to 70°F by noon, staying constant until 3 p.m., then decreasing linearly to 55°F by evening would sketch as a straight rise, flat segment, and straight drop. The correct description is a linear rise from 6–12, flat from 12–3, and linear drop from 3–6, matching choice B. A common error is mistaking constant for curving upward or confusing rising with dropping, like choosing a drop first instead of a rise. To sketch accurately: (1) identify intervals and behaviors (6-12: increasing linear, 12-3: constant, 3-6: decreasing linear), (2) plot key points like (6,40), (12,70), (3,70), (6,55), (3) connect with straight lines, (4) label axes with time (x) and temperature (y). For analysis, scan the options to match the described behaviors and shapes, avoiding mistakes like ignoring the flat interval or adding curves where linear is specified.
Question 2
A student sketches a function with these features:
It starts at (0,2).
It increases at a constant rate until x=4.
Then it stays constant (flat) from x=4 to x=7.
Which description matches the correct sketch?
A curve rising from (0,2) to (4,6), then continuing to rise but more slowly until (7,7).
A line segment falling from (0,2) to (4,-2), then a horizontal segment from (4,-2) to (7,-2).
A line segment rising from (0,2) to (4,6), then a horizontal segment from (4,6) to (7,6). (correct answer)
A horizontal segment from (0,2) to (4,2), then a line segment rising from (4,2) to (7,6).
Explanation: Tests sketching graphs from qualitative descriptions (increasing/decreasing, linear/nonlinear, intervals) and analyzing graphs qualitatively describing behavior. Sketching: read description for behavior (increasing constant rate to x=4, then constant), shape (linear then horizontal), key points ( (0,2), at x=4 some height, flat to x=7), draw accordingly (straight up to (4,height), then horizontal). For example, starts at (0,2), increases linearly to x=4, constant to x=7, like rising segment then flat. The correct sketch is a line segment rising from (0,2) to (4,6), then a horizontal segment from (4,6) to (7,6). A common error is making the increasing part horizontal or curving it, or falling instead of rising. Sketching tips: (1) identify intervals (0-4: increasing linear, 4-7: constant), (2) determine shape (linear, horizontal), (3) plot points, (4) connect appropriately, (5) label. Mistakes: wrong behavior per interval, adding curves.
Question 3
A science experiment measures the temperature of a cup of hot water as it cools. At first, the temperature drops quickly, and later it drops more slowly (it starts steep and then levels off). Which type of graph best matches this situation (time on x-axis, temperature on y-axis)?
A curve that increases quickly at first and then levels off.
A straight line decreasing at a constant rate.
A horizontal line (constant temperature).
A curve that decreases quickly at first and then levels off (still decreasing). (correct answer)
Explanation: This question tests sketching graphs from qualitative descriptions (increasing/decreasing, linear/nonlinear, intervals) and analyzing graphs qualitatively describing behavior. Sketching: read description for behavior (decreasing quickly then slowly: graph goes down steep then flattens), shape (nonlinear: curve), no specific points but overall trend. For example, temperature starts high, decreases quickly to moderately, then slowly levels off sketches as a decreasing curve steep at first then flattening. The correct graph is a curve that decreases quickly at first and then levels off (still decreasing). Common errors include choosing a straight line when nonlinear is described, or selecting an increasing curve instead of decreasing. Sketching steps: (1) identify overall behavior (decreasing with changing rate), (2) determine shape (nonlinear curve), (3) no key points but ensure steep start and leveling, (4) draw smooth curve, (5) label axes (time, temperature). Mistakes: drawing linear when rates change, confusing decreasing with increasing, making it constant, not showing the leveling off.
Question 4
A student records the amount of water in a tank. From 0 to 5 minutes, the tank fills at a constant rate. From 5 to 8 minutes, the tank is not filling or draining (the amount stays the same). From 8 to 10 minutes, the tank drains at a constant rate.
Which sketch best matches this description (time on x-axis, amount of water on y-axis)?
Stay constant from 0–5, then increase linearly from 5–8, then stay constant from 8–10.
Decrease linearly from 0–5, stay constant from 5–8, then increase linearly from 8–10.
Increase linearly from 0–10 with no flat part.
Increase linearly from 0–5, stay constant from 5–8, then decrease linearly from 8–10. (correct answer)
Explanation: This question tests sketching graphs from qualitative descriptions (increasing/decreasing, linear/nonlinear, intervals) and analyzing graphs qualitatively describing behavior. Sketching: read description for behavior (increasing 0-5: up linear, constant 5-8: flat, decreasing 8-10: down linear), shape (linear pieces), no specific values but trends. For example, water amount increases to 5 min, constant to 8, decreases to 10 sketches as up-flat-down with straight lines. The correct sketch is increase linearly from 0–5, stay constant from 5–8, then decrease linearly from 8–10. Common errors include sketching decreasing when constant is described, or missing the flat part, or making parts curved. Sketching steps: (1) identify intervals and behavior (0-5: increasing linear, 5-8: constant, 8-10: decreasing linear), (2) determine shape (straight or flat lines), (3) plot turning points, (4) connect appropriately, (5) label axes (time, water amount). Mistakes: swapping increasing/decreasing intervals, drawing curves when linear, forgetting constant segment, wrong interval endpoints.
Question 5
A ball is thrown straight up. Its height increases quickly at first, then increases more slowly until it reaches a highest point. After that, it falls faster and faster.
Which graph best matches height vs. time?
A curve that falls, reaches one minimum, then rises; it is not a straight line.
A curve that rises, reaches one maximum, then falls; it is not a straight line. (correct answer)
A straight line increasing the entire time.
Two horizontal line segments: constant height, then constant height again at a different level.
Explanation: Tests sketching graphs from qualitative descriptions (increasing/decreasing, linear/nonlinear, intervals) and analyzing graphs qualitatively describing behavior. Sketching: read description for behavior (increasing quickly then slowly to max, then decreasing faster), shape (linear: straight lines, nonlinear: curves), key points (starts low, maximum at highest point, ends low), draw accordingly (curve up to peak, then down). For example, ball height starts increasing quickly, slows to a maximum, then falls faster, sketching as a curve that rises, reaches one maximum, then falls, nonlinear. The correct graph is a curve that rises, reaches one maximum, then falls; it is not a straight line. A common error is sketching a straight line when the description implies changing rates (nonlinear), or reversing the rise and fall like falling first then rising. Sketching tips: (1) identify intervals and behavior (initial increase slowing, then decrease accelerating), (2) determine shape (nonlinear: curve), (3) plot key points (start, max, end), (4) connect with appropriate shape (parabolic curve), (5) label axes (time, height). Mistakes: confusing up/down directions, drawing straight when curved described, missing maximum peak.
Question 6
A function starts at (0,0). For 0≤x≤4, it increases linearly to (4,8). For 4≤x≤8, it continues increasing but more and more slowly, leveling off near y=10.
Which sketch description matches this best?
A line from (0,0) to (4,8), then a curve that still rises but flattens toward y=10. (correct answer)
A curve that rises faster and faster after x=4 (gets steeper).
A straight line from (0,0) to (8,10) with constant slope.
A line from (0,0) to (4,8), then a line decreasing to (8,10).
Explanation: This question tests sketching graphs from descriptions mixing linear and nonlinear behaviors, like switching from straight increase to slowing curve. Sketching involves plotting the linear part from (0,0) to (4,8) as a straight line, then a curve from there that rises but flattens toward y=10, indicating decreasing rate. For example, a function linear to x=4 then concave down approaching a horizontal level sketches as line then flattening curve. The correct description is a line from (0,0) to (4,8), then a curve that rises but flattens toward y=10, matching choice B. A common error is keeping it fully linear or making it steepen instead of flatten. To sketch: (1) identify intervals and behaviors (0-4: increasing linear, 4-8: increasing nonlinear slowing), (2) determine shapes (straight then curve), (3) plot key points like (0,0), (4,8), near (8,10), (4) connect with line then curve, (5) label axes. For analysis, match to options avoiding mistakes like adding decreases or wrong curving direction.
Question 7
Which equation is most likely to have a graph that is a straight line (linear) and crosses the y-axis at −3?
y=3x−3
y=2x−3 (correct answer)
y=x−3
y=x2−3
Explanation: This question tests identifying equations that match qualitative graph descriptions, such as linear straight lines with specific intercepts, versus nonlinear curves. Analyzing involves recognizing that linear equations like y=mx+b produce straight lines with y-intercept b, while quadratics, square roots, or exponentials curve. For example, y=2x-3 is a straight line crossing y=-3, unlike y=x^2-3 which parabolas down to -3. The correct equation is y=2x-3, matching choice A as it's linear with y-intercept -3. A common error is picking a curving function like exponential, mistaking it for linear. To verify: (1) check for linear form (no exponents or roots), (2) identify y-intercept as constant term, (3) compare shapes mentally, (4) eliminate nonlinear options. Mistakes include ignoring the intercept or confusing quadratic with linear.
Question 8
Based on the graph shown, during which time interval does the function exhibit the steepest rate of decrease?
From t=1 to t=3 hours, where the slope is approximately −2 units per hour
From t=3 to t=5 hours, where the slope is approximately −4 units per hour (correct answer)
From t=5 to t=7 hours, where the slope is approximately −1 unit per hour
From t=7 to t=9 hours, where the slope is approximately −3 units per hour
Explanation: The steepest rate of decrease corresponds to the most negative slope. From the graph, the interval from t = 3 to t = 5 shows the steepest downward trend with a slope of approximately -4 units per hour. Choice A shows a slope of -2, Choice C shows -1, and Choice D shows -3, all of which are less steep than -4.
Question 9
The graph shows a function f(x). For what values of x is the function both positive and decreasing?
x values in the interval (1,4) where the function output is above the x-axis
x values in the interval (2,5) where the function output is above the x-axis
x values in the interval (3,6) where the function output is above the x-axis (correct answer)
x values in the interval (4,7) where the function output is above the x-axis
Explanation: For a function to be both positive and decreasing, it must be above the x-axis (positive) and have a negative slope (decreasing). From the graph, this occurs in the interval (3,6) where the function values are positive and the function is decreasing. In intervals (1,4) and (2,5), parts of the function are increasing, and in (4,7), part of the function is below the x-axis.
Question 10
A student records the temperature T (in °F) during a day. From 6 a.m. to 12 p.m., the temperature increases linearly from 40°F to 70°F. From 12 p.m. to 6 p.m., it decreases linearly to 55°F.
Which graph best represents T as a function of time?
A straight line that increases from 40°F at 6 a.m. to 55°F at 6 p.m., with no turning point.
Two straight line segments: falling from (6, 70) to (12, 40), then rising from (12, 40) to (18, 55).
A smooth curve that rises quickly from 6 a.m. to 12 p.m. and then slowly levels off, staying almost flat until 6 p.m.
Two straight line segments: rising from (6, 40) to (12, 70), then falling from (12, 70) to (18, 55). (correct answer)
Explanation: The temperature rises linearly from 40°F to 70°F between 6 a.m. and noon, then falls linearly from 70°F to 55°F between noon and 6 p.m. As a graph of temperature versus time, that's two straight-line segments: rising from (6, 40) to (12, 70), then falling from (12, 70) to (18, 55). Choice A is wrong because it ignores the turning point at noon and never reaches 70°F. Choice B is wrong because it reverses the direction of change in both time intervals. Choice C is wrong because the temperature changes linearly the whole time, not as a curve that levels off.
Question 11
Examine the function graph. Which statement best describes the relationship between the intervals where the function is increasing and decreasing?
The function increases for a longer total time duration than it decreases, with three increasing intervals
The function decreases for a longer total time duration than it increases, with two decreasing intervals
The function increases and decreases for equal total time durations, alternating between four intervals each
The function increases for a longer total time duration than it decreases, with two increasing intervals (correct answer)
Explanation: From the graph, the function increases during intervals [0,2] and [4,8], totaling 6 units of time. It decreases during interval [2,4], totaling 2 units of time. Therefore, it increases for longer (6 > 2) and has exactly two increasing intervals. Choice A incorrectly states three increasing intervals, Choice B incorrectly states decreasing takes longer, and Choice C incorrectly states equal durations and four intervals each.
Question 12
A student sketches a function with these features: it starts at (0,2); it increases at a constant rate, reaching (4,6); then it stays constant (flat) from x=4 to x=7. Which description matches the correct sketch?
A line segment rising from (0,2) to (4,6), then a horizontal segment from (4,6) to (7,6). (correct answer)
A curve rising from (0,2) to (4,6), then continuing to rise but more slowly until (7,7).
A horizontal segment from (0,2) to (4,2), then a line segment rising from (4,2) to (7,6).
A line segment falling from (0,2) to (4,-2), then a horizontal segment from (4,-2) to (7,-2).
Explanation: The description says the function starts at (0,2), rises at a constant rate to reach (4,6), and then stays flat until (7,6). A constant rate of change means a straight line, so the graph is a straight segment from (0,2) to (4,6), followed by a horizontal segment from (4,6) to (7,6). Choice B is incorrect because it shows a curve, not a constant rate. Choice C reverses the order, showing the flat part first. Choice D shows the function decreasing instead of increasing.
Question 13
A company's profit function throughout a business cycle shows several distinct phases of growth and decline.
If the profit function shows linear growth for 4 months, followed by nonlinear decline for 3 months, then nonlinear growth for 5 months, how many distinct intervals of different behavior does this function contain?
Two intervals: one for growth periods and one for decline periods, regardless of linearity
Three intervals: linear growth, nonlinear decline, and nonlinear growth phases (correct answer)
Four intervals: linear growth, transition, nonlinear decline, and nonlinear growth phases
Five intervals: each month represents a distinct behavioral interval for analysis purposes
Explanation: The function has three distinct behavioral intervals based on both the direction (increasing/decreasing) and type (linear/nonlinear) of change: linear growth (4 months), nonlinear decline (3 months), and nonlinear growth (5 months). Choice A ignores the difference between linear and nonlinear behavior, Choice C incorrectly adds a transition period, and Choice D incorrectly counts individual months rather than behavioral intervals.
Question 14
A student is asked to sketch a function with specific qualitative features for a math assignment.
Which combination of features would be impossible to include in a single continuous function over the interval [0,8]?
The function increases on (0,3), decreases on (3,6), and increases on (6,8) with nonlinear segments
The function has exactly three turning points and alternates between increasing and decreasing four times (correct answer)
The function is linear on (0,2), nonlinear on (2,5), and linear again on (5,8) while remaining continuous
The function crosses the x-axis twice and has both positive and negative values in the given interval
Explanation: If a function alternates between increasing and decreasing four times, it would need to have at least three turning points (change of direction). However, having exactly three turning points would only allow for alternating three times, not four. The statement is internally contradictory. All other choices describe possible function behaviors: Choice A describes a valid function with two turning points, Choice C describes a piecewise function that can be continuous, and Choice D describes a function that crosses the x-axis.
Question 15
An engineer is analyzing temperature data from a manufacturing process that must maintain specific heating and cooling phases.
If the temperature function must be nonlinear, start at 200°F, reach a maximum of 350°F, then cool to 150°F, and finally warm to 300°F, what is the minimum number of intervals where the function changes from increasing to decreasing or vice versa?
Four intervals: increase, decrease, increase again, with one additional transition phase required
Three intervals: initial increase, decrease, and final increase phases of the manufacturing process
Two intervals: one where it changes from increasing to decreasing, and one from decreasing to increasing (correct answer)
One interval: since the function is continuous, it represents a single behavioral change pattern
Explanation: When you encounter questions about function behavior and turning points, focus on identifying where the function changes direction from increasing to decreasing or vice versa. These transition points are called turning points or local extrema.Let's trace through this temperature function step by step. Starting at 200°F, the function increases to reach a maximum of 350°F, then decreases to 150°F, and finally increases again to 300°F. This creates exactly two direction changes: one where the function stops increasing and starts decreasing (at the 350°F maximum), and another where it stops decreasing and starts increasing again (at the 150°F minimum).Each direction change represents one interval of behavioral change. So you have two intervals: increasing-to-decreasing, and decreasing-to-increasing. This makes C correct.Choice A incorrectly suggests four intervals and mentions an "additional transition phase," but there are only two clear turning points in the described function. Choice B counts three intervals by separating the process into three phases, but the question asks specifically about direction changes, not process phases. Choice D misunderstands the concept entirely—continuity doesn't mean there's only one behavioral pattern. A continuous function can have multiple turning points.Remember this key strategy: when analyzing function behavior, count the turning points by tracking each time the function switches from going up to going down, or from going down to going up. Each switch represents one interval of change, regardless of how many total phases the process might have.
Question 16
The function graphed below represents the height of a ball over time. During which time interval does the ball experience the greatest upward velocity?
From t=0 to t=1 seconds, when the height increases from 0 to 12 feet (correct answer)
From t=1 to t=2 seconds, when the height increases from 12 to 20 feet
From t=3 to t=4 seconds, when the height increases from 8 to 16 feet
From t=4 to t=5 seconds, when the height increases from 16 to 20 feet
Explanation: Upward velocity corresponds to the rate of increase in height, which is the slope of the graph during increasing intervals. From t=0 to t=1: slope = (12-0)/(1-0) = 12 ft/s. From t=1 to t=2: slope = (20-12)/(2-1) = 8 ft/s. From t=3 to t=4: slope = (16-8)/(4-3) = 8 ft/s. From t=4 to t=5: slope = (20-16)/(5-4) = 4 ft/s. The greatest upward velocity is 12 ft/s in the first interval.
Question 17
Marcus is tracking his elevation while hiking. His elevation changes throughout the day based on the terrain he encounters.
If Marcus's elevation function is nonlinear, increases for the first 3 hours, then decreases for 2 hours, and finally increases again, which characteristic must be true about his elevation graph?
The graph contains exactly one turning point and shows curved segments in some portions
The graph contains exactly three turning points and consists entirely of straight line segments
The graph contains no turning points but shows curved segments throughout the hiking period
The graph contains exactly two turning points and shows curved segments rather than straight lines (correct answer)
Explanation: When you encounter questions about function behavior and graphs, focus on connecting the verbal description to the visual characteristics of the graph. Here, you need to identify turning points (where the function changes from increasing to decreasing or vice versa) and determine whether the graph shows curved or straight segments.Marcus's elevation changes in this pattern: increases → decreases → increases. Each time the function switches from increasing to decreasing (or decreasing to increasing), the graph has a turning point. Since there are two switches in direction, there are exactly two turning points. Additionally, since the problem states the elevation function is nonlinear, the graph must show curved segments rather than straight lines.Let's examine why the other answers are incorrect. Choice A suggests exactly one turning point, but Marcus's elevation changes direction twice, requiring two turning points. Choice B claims exactly three turning points, which would require the elevation to change direction three times, but the description only shows two direction changes. Choice C states there are no turning points, which contradicts the fact that Marcus's elevation increases, then decreases, then increases again. Choice B also incorrectly suggests straight line segments, which would indicate a linear function.The correct answer is D because it correctly identifies two turning points (matching the two direction changes) and curved segments (reflecting the nonlinear nature).Study tip: When analyzing function behavior, count the direction changes to find turning points, and remember that "nonlinear" always means curved segments, not straight lines.
Question 18
A student records the temperature T (in °F) during a day. From 6 a.m. to 12 p.m., the temperature increases linearly from 40°F to 70°F. From 12 p.m. to 6 p.m., it decreases linearly to 55°F.
Which graph best represents T as a function of time?
Two straight line segments: falling from (6, 40) to (12, 70), then rising from (12, 70) to (18, 55).
A smooth curve that rises quickly from 6 a.m. to 12 p.m. and then slowly levels off, staying almost flat until 6 p.m.
Two straight line segments: rising from (6, 40) to (12, 70), then falling from (12, 70) to (18, 55). (correct answer)
A straight line that decreases from 40°F at 6 a.m. to 55°F at 6 p.m., with no turning point.
Explanation: Tests sketching graphs from qualitative descriptions (increasing/decreasing, linear/nonlinear, intervals) and analyzing graphs qualitatively describing behavior. Sketching: read description for behavior (increasing from 6 a.m. to 12 p.m.: graph goes up, decreasing 12 p.m. to 6 p.m.: goes down), shape (linear: straight lines, nonlinear: curves), key points (starts at 40°F, peaks at 70°F at noon, ends at 55°F), draw accordingly (straight from (6,40) up to (12,70), straight down to (18,55) for linear pieces). For example, temperature starts at 40°F at 6 a.m., increases linearly to 70°F by 12 p.m., then decreases linearly to 55°F by 6 p.m., sketching as up-then-down with straight lines. The correct sketch is two straight line segments: rising from (6, 40) to (12, 70), then falling from (12, 70) to (18, 55). A common error is sketching a curve when the description specifies linear changes, or reversing the increasing and decreasing parts like falling first then rising. Sketching tips: (1) identify intervals and behavior per interval (6-12: increasing linearly, 12-18: decreasing linearly), (2) determine shape per interval (linear: straight), (3) plot key points (start, peak, end), (4) connect with appropriate shape (straight lines), (5) label axes with context (time, temperature). Analyzing tips: (1) scan left to right noting where graph goes up (increasing), down (decreasing), flat (constant), (2) identify shape (straight vs curves), (3) locate features (peaks), (4) state intervals; mistakes include confusing directions or misidentifying linear as curved.
Question 19
A student's distance from home (in miles) changes during a bike ride. The distance increases at a constant rate from 0 miles at 1:00 PM to 6 miles at 2:00 PM. Then the student rides back toward home at a constant rate and is 2 miles from home at 3:00 PM. Which sketch best matches this description (time on the x-axis, distance on the y-axis)?
A straight line increasing from (1 PM, 0) to (2 PM, 2), then increasing to (3 PM, 6).
A straight line decreasing from (1 PM, 0) to (2 PM, 6), then increasing to (3 PM, 2).
A straight line increasing from (1 PM, 0) to (2 PM, 6), then a straight line decreasing to (3 PM, 2). (correct answer)
A curve that increases quickly at first and then levels off from 1 PM to 3 PM.
Explanation: This question tests sketching graphs from qualitative descriptions (increasing/decreasing, linear/nonlinear, intervals) and analyzing graphs qualitatively describing behavior. Sketching: read description for behavior (increasing from 1-2 PM: graph goes up linearly, decreasing 2-3 PM: goes down linearly), shape (linear: straight lines), key points (starts at 0, to 6 at 2 PM, ends at 2 at 3 PM), draw accordingly (straight from (1 PM,0) up to (2 PM,6), straight down to (3 PM,2)). For example, distance starts at 0 miles at 1 PM, increases to 6 miles by 2 PM, then decreases to 2 miles by 3 PM sketches as up-then-down with linear pieces. The correct sketch is a straight line increasing from (1 PM, 0) to (2 PM, 6), then a straight line decreasing to (3 PM, 2). Common errors include sketching decreasing when description says increases, or making it curved when linear is specified, or wrong key points like ending at 6 instead of 2. Sketching steps: (1) identify intervals and behavior (1-2: increasing linear, 2-3: decreasing linear), (2) determine shape per interval (straight lines), (3) plot key points (start, peak, end), (4) connect with straight lines, (5) label axes (time, distance). Mistakes: confusing increasing with decreasing, drawing curves instead of straight, misreading rates or endpoints, wrong intervals.