All questions
Question 1
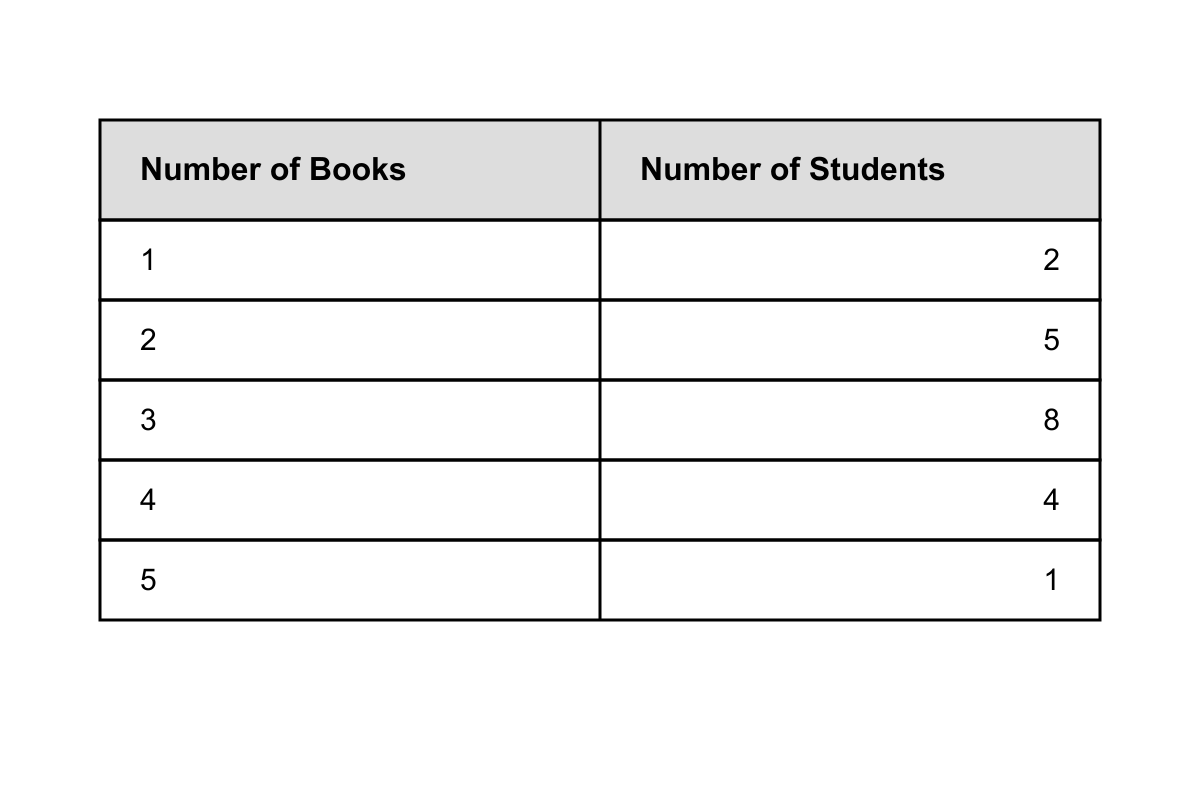
Based on the data shown in the table, what is the median number of books read per student?
- 3 (correct answer)
- 4
- 3.5
- 2.5
Explanation: First, find the total number of students: 2 + 5 + 8 + 4 + 1 = 20 students. The median is the average of the 10th and 11th values. Counting from the lowest: positions 1-2 have 1 book, positions 3-7 have 2 books, positions 8-15 have 3 books, positions 16-19 have 4 books, position 20 has 5 books. The 10th and 11th students both read 3 books, so the median is 3.
Question 2
The dot plot displays the number of books read by students over summer break. What is the range of the data?
- 7 (correct answer)
- 8
- 9
- 10
Explanation: From the dot plot, the minimum number of books is 2 and the maximum number of books is 9. The range is 9 - 2 = 7.
Question 3
The line plot shows the number of goals scored by a soccer team in their last 12 games. What is the difference between the range and the median?
- 1 (correct answer)
- 2
- 3
- 4
Explanation: From the line plot, the data values are: 1, 1, 2, 2, 2, 3, 3, 3, 3, 4, 4, 5. The range is 5 - 1 = 4. For the median of 12 values, we take the average of the 6th and 7th values: (3 + 3)/2 = 3. The difference between range and median is 4 - 3 = 1.
Question 4
In a data set of 9 consecutive even integers, the median is 16. What is the range of this data set?
- 8
- 12
- 16 (correct answer)
- 24
Explanation: When you encounter problems involving consecutive integers and their median, remember that the median of an odd number of values is always the middle value when arranged in order.
Since we have 9 consecutive even integers with a median of 16, we know 16 is the 5th value (middle position). The consecutive even integers are: 8, 10, 12, 14, 16, 18, 20, 22, 24.
The range is the difference between the largest and smallest values: 24−8=16. So the correct answer is C) 16.
Let's examine why the other options are incorrect. Answer A) 8 represents the difference between consecutive terms (like 16−8=8), but this isn't what range measures. Answer B) 12 might come from incorrectly calculating the difference between the median and one of the endpoints (16−4=12 if you mistakenly thought the sequence started at 4), but this doesn't represent the full spread of data. Answer D) 24 is actually the largest value in our data set, not the range—this is a common trap where students confuse a data point with the measure of spread.
Strategy tip: For consecutive integer problems, always write out the actual sequence when possible. This prevents calculation errors and helps you clearly identify the minimum and maximum values needed for range. Remember that range = maximum - minimum, and with consecutive integers, you're looking at the difference between the first and last terms in your sequence. Question 5
A data set has 11 values with these characteristics: the mode is 25, the median is 28, and the range is 40. If the smallest value is 10, what is the largest value?
- 40
- 45
- 50 (correct answer)
- 55
Explanation: This question tests your understanding of statistical measures and how they relate to each other in a data set. When you see problems involving mode, median, and range together, you need to think systematically about what each measure tells you about the data's distribution.
Let's work through this step by step. You know the data set has 11 values, so the median (middle value) is the 6th value when arranged in order, which is 28. The mode is 25, meaning 25 appears most frequently. The range is 40, and since the smallest value is 10, you can find the largest value using the range formula: Range = Largest value - Smallest value.
Therefore: 40=Largest value−10, so the largest value is 40+10=50.
Looking at the wrong answers: Choice A) 40 represents the range itself, not the largest value—this is a common trap where students confuse the range with an actual data point. Choice B) 45 might result from incorrectly calculating 10+40−5, perhaps from some confusion about how range works. Choice D) 55 could come from adding the range to something other than the minimum value, like 28+40−13=55, showing misunderstanding of the range formula.
Remember that range is always the difference between the highest and lowest values in a data set. When you know the range and one extreme value, you can always find the other extreme by adding or subtracting the range accordingly. Question 6
In a data set of 20 values, the smallest value is 15 and the largest value is 47. If 5 new values are added to the data set (12, 18, 35, 42, 50), what is the range of the new data set?
- 35
- 38 (correct answer)
- 40
- 42
Explanation: When you encounter range problems, remember that range measures the spread of data by finding the difference between the highest and lowest values. Adding new data points can potentially change both extremes.
First, identify the current range boundaries. The original dataset has a minimum of 15 and maximum of 47. Now examine each new value: 12, 18, 35, 42, and 50. You need to determine if any of these extend beyond the current boundaries.
Looking at the new values, 12 is smaller than the current minimum of 15, so it becomes the new minimum. The value 50 is larger than the current maximum of 47, so it becomes the new maximum. The other new values (18, 35, 42) fall within the original range and don't affect the extremes.
The new range is 50−12=38.
Choice A (35) represents the original range of 47−15=32, but this fails to account for the new extreme values. Choice C (40) might result from incorrectly using 50 as the new maximum but keeping 15 as the minimum (50−15=35), then making an arithmetic error. Choice D (42) could come from correctly identifying the new maximum of 50 but mistakenly using the original minimum of 15, then calculating 50−8=42 through computational error.
The correct answer is B (38).
Strategy tip: Always check if new data points extend beyond the existing minimum or maximum values. The range can only stay the same or increase when adding data—it can never decrease. Question 7
In a science experiment, 7 measurements were recorded: 4.2, 4.5, 4.8, 5.1, 5.4, 5.7, 6.0. If each measurement is increased by 20%, what is the median of the new data set?
- 5.1
- 6.0
- 6.12 (correct answer)
- 6.84
Explanation: When you encounter problems involving percentage changes to data sets, remember that the median's position stays the same, but its value changes proportionally with the data transformation.
First, let's find the median of the original data set: 4.2, 4.5, 4.8, 5.1, 5.4, 5.7, 6.0. With 7 values, the median is the 4th value when arranged in order, which is 5.1.
Now, when each measurement increases by 20%, we multiply each value by 1.20. The key insight is that you don't need to calculate all seven new values—since every number increases by the same percentage, the median will also increase by exactly 20%. So the new median is 5.1×1.20=6.12.
Looking at the wrong answers: Choice (A) gives 5.1, which is the original median before the 20% increase—this ignores the percentage change entirely. Choice (B) shows 6.0, which was the largest value in the original data set, suggesting confusion about which position represents the median. Choice (D) gives 6.84, which would result from incorrectly taking 20% of the largest original value (6.0) and adding it to the original median: 5.1+(0.20×6.0)=6.3—though even this calculation doesn't quite match 6.84.
The correct answer is (C) 6.12.
Study tip: When a data set undergoes a uniform transformation (like adding a constant or multiplying by a percentage), all measures of central tendency change by that same transformation. This saves you time—transform the median directly rather than recalculating the entire data set. Question 8
A quiz has 10 questions, each worth 1 point. The scores of 15 students are: 6, 7, 7, 8, 8, 8, 8, 9, 9, 9, 9, 9, 10, 10, 10. If the teacher decides to give 2 bonus points to every student, what will be the new mode?
- 10
- 11 (correct answer)
- 12
- Cannot be determined
Explanation: When you encounter statistics problems involving transformations of data, remember that adding or subtracting the same value to every data point shifts the entire distribution without changing its shape or spread.
First, let's identify the mode in the original data set: 6, 7, 7, 8, 8, 8, 8, 9, 9, 9, 9, 9, 10, 10, 10. The mode is the value that appears most frequently. Counting the frequencies: 6 appears once, 7 appears twice, 8 appears four times, 9 appears five times, and 10 appears three times. Since 9 appears most often (5 times), the original mode is 9.
When the teacher adds 2 bonus points to every student's score, each value increases by 2: the new scores become 8, 9, 9, 10, 10, 10, 10, 11, 11, 11, 11, 11, 12, 12, 12. The value that was most frequent before (9) becomes 11, and it still appears most frequently (5 times). Therefore, the new mode is 11, making choice B correct.
Choice A (10) represents the original maximum score, not the new mode. Choice C (12) is the new maximum score after adding bonus points, but it only appears 3 times. Choice D (Cannot be determined) is incorrect because adding a constant to all values preserves the frequency relationships.
Remember: when you add or subtract the same amount from every data point, the mode shifts by that same amount. The relative frequencies don't change, just the actual values.
Question 9
A teacher recorded the number of absences for each student in her class over a semester. The data shows: 0 absences (8 students), 1 absence (6 students), 2 absences (4 students), 3 absences (3 students), 4 absences (2 students), 5 absences (1 student). What is the median number of absences?
- 1 (correct answer)
- 1.5
- 2
- 0
Explanation: When you encounter a question about finding the median, you need to arrange all data values in order and find the middle value (or average of the two middle values if there's an even number of data points).
First, let's determine the total number of students: 8 + 6 + 4 + 3 + 2 + 1 = 24 students. Since we have 24 students (an even number), the median will be the average of the 12th and 13th values when all absence counts are listed in order.
Now, let's list out the data in order: The first 8 students have 0 absences, the next 6 students (positions 9-14) have 1 absence, the next 4 students (positions 15-18) have 2 absences, and so on. This means the 12th student has 1 absence (since positions 9-14 all have 1 absence), and the 13th student also has 1 absence. Therefore, the median is 21+1=1.
Looking at the wrong answers: B) 1.5 might tempt you if you incorrectly identified which positions represent the middle values or made an arithmetic error. C) 2 could result from confusing the median with another measure like the mode of the frequencies, or miscounting positions. D) 0 might seem appealing since it's the most frequent value (the mode), but that's not what median measures.
Remember: for median problems, always count the total data points first, then systematically locate the middle position(s). Don't confuse median with mode (most frequent value) or mean (average). Question 10
A survey of 25 students asked how many hours they spent on homework last week. The results were: 5 hours (3 students), 6 hours (5 students), 7 hours (8 students), 8 hours (6 students), 9 hours (3 students). If the two students who spent the least time are removed from the data, what is the new mode?
- 6 hours
- 7 hours (correct answer)
- 8 hours
- There is no mode
Explanation: When you encounter questions about measures of central tendency, remember that removing data points can change which measure (mean, median, or mode) best describes your dataset.
The mode is the value that appears most frequently in a dataset. Let's first identify the original data distribution: 5 hours (3 students), 6 hours (5 students), 7 hours (8 students), 8 hours (6 students), and 9 hours (3 students). The original mode is 7 hours since it appears 8 times, more than any other value.
Now we need to remove the two students who spent the least time. The least time spent was 5 hours by 3 students, so removing 2 of these students leaves us with: 5 hours (1 student), 6 hours (5 students), 7 hours (8 students), 8 hours (6 students), and 9 hours (3 students).
Looking at our new frequencies, 7 hours still appears most often with 8 students, making it the new mode.
Let's examine why the other choices are incorrect: Choice A (6 hours) appears 5 times, which is less than 7 hours' frequency of 8. Choice C (8 hours) appears 6 times, also less than 7 hours. Choice D suggests there's no mode, but this would only be true if no value appeared more frequently than others or if multiple values tied for the highest frequency.
Remember that when data is removed from a dataset, always recalculate the frequencies completely rather than assuming the mode stays the same. The mode depends entirely on which value appears most often in your current dataset.
Question 11
In a class survey, the number of pets owned by students follows this pattern: 5 students own 0 pets, 8 students own 1 pet, 12 students own 2 pets, 8 students own 3 pets, and 2 students own 4 pets. What is the difference between the mode and the median number of pets?
- 0 (correct answer)
- 0.5
- 1
- 1.5
Explanation: When you encounter a statistics problem asking about mode and median, you need to understand what each measure represents and how to calculate them from frequency data.
First, let's organize the data: 5 students own 0 pets, 8 students own 1 pet, 12 students own 2 pets, 8 students own 3 pets, and 2 students own 4 pets. The total number of students is 5+8+12+8+2=35.
The mode is the value that appears most frequently. Looking at our data, 12 students own 2 pets, which is the highest frequency. Therefore, the mode is 2 pets.
For the median, you need the middle value when all 35 students are arranged in order. The median position is 235+1=18. Counting through the ordered data: positions 1-5 have 0 pets, positions 6-13 have 1 pet, positions 14-25 have 2 pets. Since the 18th student falls in the group with 2 pets, the median is 2 pets.
The difference between mode and median is 2−2=0, making A correct.
Choice B (0.5) might result from incorrectly calculating the median position or misunderstanding how to find the median with grouped data. Choice C (1) could come from miscounting frequencies or confusing which value has the highest frequency. Choice D (1.5) might stem from incorrectly averaging values instead of finding the true median position.
Remember: always organize frequency data systematically and count positions carefully when finding the median in grouped data. Question 12
A basketball team's scores for their last 8 games were: 78, 82, 85, 88, 91, 94, 98, 103. If the coach removes the highest and lowest scores before calculating statistics, what is the range of the remaining 6 scores?
- 13
- 16 (correct answer)
- 19
- 25
Explanation: When you encounter a problem about range after removing data points, you need to carefully identify which values remain and then find the difference between the highest and lowest of those remaining values.
Starting with the original scores: 78, 82, 85, 88, 91, 94, 98, 103. The coach removes the highest score (103) and the lowest score (78), leaving you with: 82, 85, 88, 91, 94, 98.
To find the range of these remaining 6 scores, you subtract the lowest remaining value from the highest remaining value: 98−82=16.
Let's examine why the other answers are incorrect. Choice A (13) might come from finding the difference between consecutive scores or making an arithmetic error in the subtraction. Choice C (19) could result from incorrectly including one of the removed scores in your calculation—for example, if you mistakenly used 85 as your lowest value instead of 82. Choice D (25) is the range of the original complete dataset (103−78=25), which represents the trap of forgetting to remove the highest and lowest scores entirely.
The key strategy here is to work methodically: first identify and remove the specified values, then clearly identify the new highest and lowest values from what remains. Many students rush and either forget to remove scores or accidentally use values from the original dataset. Always double-check that you're working with the correct modified dataset before calculating your final answer. Question 13
The stem-and-leaf plot shows test scores for a math class. What is the median score?
- 84
- 85 (correct answer)
- 86
- 87
Explanation: From the stem-and-leaf plot, the scores are: 72, 75, 78, 81, 83, 84, 85, 86, 88, 89, 91, 93, 95. There are 13 scores total. The median is the 7th value (middle value), which is 85.
Question 14
The frequency table shows the results of rolling a number cube 30 times. Which number is the mode?
- 3 (correct answer)
- 4
- 5
- 6
Explanation: The mode is the value that appears most frequently. From the frequency table, the number 3 appears 8 times, which is more than any other number. Therefore, 3 is the mode.
Question 15
The bar graph shows student preferences for lunch options. Based on the data, what is the mode of the responses?
- Pizza (correct answer)
- Sandwiches
- Salad
- Soup
Explanation: The mode is the category with the highest frequency. From the bar graph, Pizza has the tallest bar with 25 students choosing it, which is more than any other option. Therefore, Pizza is the mode.
Question 16
The histogram shows the distribution of test scores. What is the mode of the test scores?
- 75
- 80
- 85 (correct answer)
- 90
Explanation: The mode is the value that appears most frequently. From the histogram, the bar for score 85 has height 8, which is the tallest bar, indicating that 85 appears more frequently than any other score. Therefore, the mode is 85.
Question 17
The range of a set of positive integers is 24. If the smallest value is increased by 5 and the largest value is decreased by 3, what is the new range?
- 16 (correct answer)
- 18
- 20
- 22
Explanation: When you encounter range problems, remember that range measures the spread of data by finding the difference between the largest and smallest values. Understanding how changes to these extreme values affect the range is crucial for these types of questions.
Let's work through this step by step. Initially, you have a set of positive integers with a range of 24, meaning the difference between the largest and smallest values is 24. If we call the smallest value s and the largest value L, then L−s=24.
Now, the smallest value increases by 5 (becomes s+5) and the largest value decreases by 3 (becomes L−3). The new range is: (L−3)−(s+5)=L−3−s−5=L−s−8=24−8=16.
Looking at the wrong answers: Choice B (18) likely comes from subtracting only 5 instead of 8, perhaps forgetting that both endpoints change. Choice C (20) results from subtracting only the decrease in the maximum value (3) from the original range. Choice D (22) occurs if you subtract only the increase in the minimum value (5) but ignore the decrease in the maximum.
The correct answer is A) 16.
Study tip: When the range changes due to modifications at both endpoints, always track how each change affects the difference. Increases to the minimum value decrease the range, while decreases to the maximum value also decrease the range. The total change is the sum of both individual effects. Question 18
A data set has a range of 36. If every value in the data set is multiplied by 3 and then 5 is subtracted from each result, what is the range of the new data set?
- 103
- 108 (correct answer)
- 113
- 118
Explanation: When you encounter questions about transforming data sets, focus on how different operations affect measures of spread like range. Range measures the spread between the highest and lowest values, so you need to understand how mathematical transformations impact this spread.
Let's work through this step-by-step. The original data set has a range of 36, meaning the difference between the maximum and minimum values is 36. When you multiply every value by 3, you're scaling the entire data set. This scaling affects the range by the same factor - the new range becomes 36×3=108.
Here's the key insight: subtracting 5 from each value shifts every data point by the same amount. Since range only depends on the difference between maximum and minimum values, adding or subtracting the same constant to all values doesn't change the range at all. The range remains 108.
Looking at the wrong answers: Choice A (103) might result from incorrectly thinking you subtract 5 from the range after multiplying by 3: 108−5=103. Choice C (113) could come from adding 5 instead of recognizing that constant shifts don't affect range: 108+5=113. Choice D (118) might result from incorrectly applying both operations to the range: 36×3+5+5=118.
The correct answer is B (108).
Strategy tip: Remember that multiplication/division changes the range by the same factor, while addition/subtraction leaves the range unchanged. Focus on how each transformation affects spread, not individual values. Question 19
Temperatures over 14 days were 62,65,60,63,66,62,64,67,61,62,65,68,62,64; which appears most?
- The mode is 65.
- The mode is 62. (correct answer)
- The mode is 68.
- The mode is 63.
Explanation: This question tests high school mathematics achievement skills: determining range, median, and mode from a data set. The range is the difference between the highest and lowest values, the median is the middle value when data is ordered, and the mode is the most frequently occurring number. In this data set (62, 65, 60, 63, 66, 62, 64, 67, 61, 62, 65, 68, 62, 64), you can find the mode by counting frequencies: 60 appears once, 61 once, 62 appears four times, 63 once, 64 appears twice, 65 appears twice, 66 once, 67 once, and 68 once. Choice B is correct because 62 appears four times, more frequently than any other temperature value. Choice A is incorrect because 65 only appears twice, which is less frequent than 62 - this error occurs when students don't systematically count all occurrences. To help students: Use tally marks or a frequency table to track each value's occurrences systematically. Always recount to verify, especially with larger data sets.
Question 20
For points 7,11,9,16,11,13,10,8,14,11, what is the range?
- The range is 9. (correct answer)
- The range is 23.
- The range is 16.
- The range is 8.
Explanation: This question tests high school mathematics achievement skills: determining range, median, and mode from a data set. The range is the difference between the highest and lowest values, the median is the middle value when data is ordered, and the mode is the most frequently occurring number. In this data set (7, 11, 9, 16, 11, 13, 10, 8, 14, 11), you can find the range by first identifying the highest value (16) and the lowest value (7), then calculating 16 - 7 = 9. Choice A is correct because it accurately reflects the calculation of the range as the difference between the maximum and minimum values. Choice B is incorrect because 23 represents adding the highest and lowest values (16 + 7) rather than subtracting them, a common conceptual error. To help students: Always arrange data from smallest to largest first, clearly identify the maximum and minimum values, then subtract minimum from maximum. Remind students that range measures spread, not sum.