All questions
Question 1
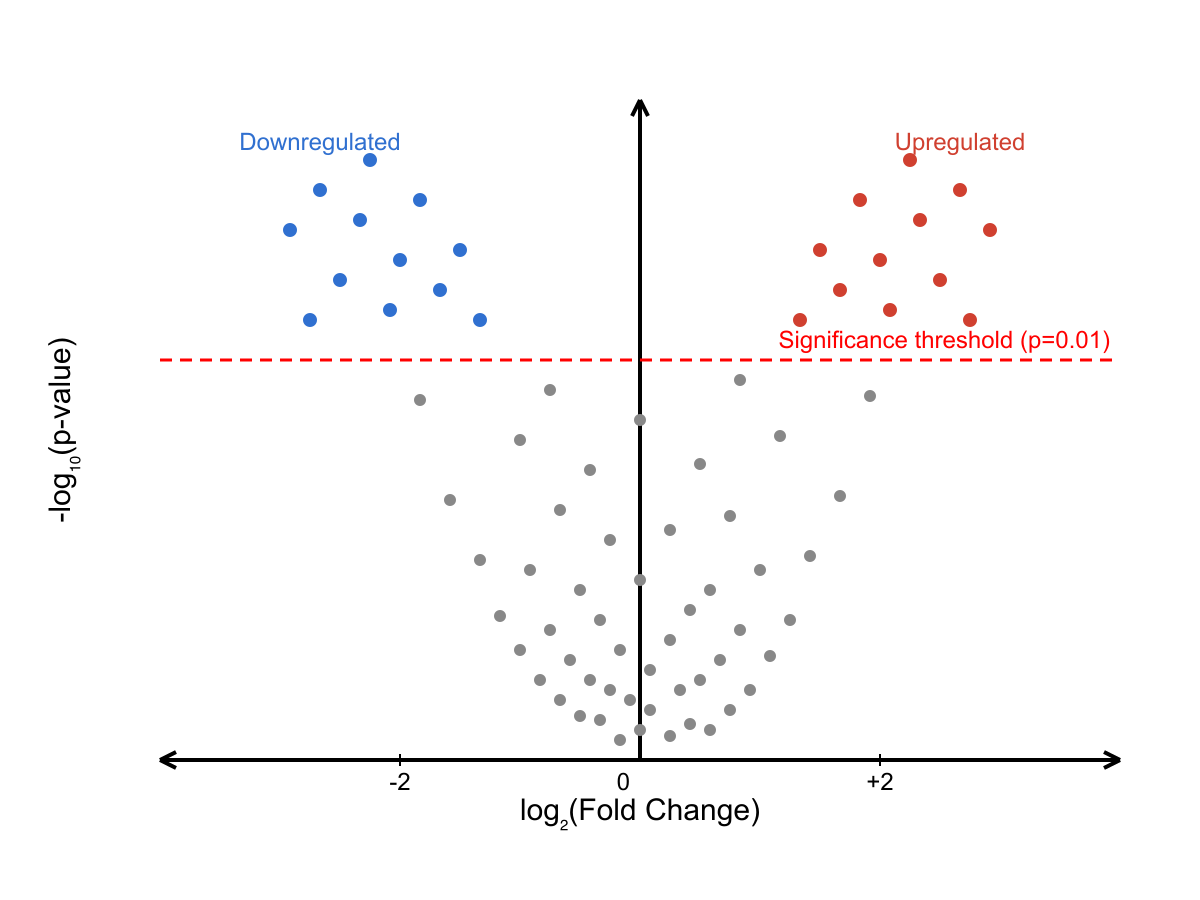
Researchers performed an RNA-seq experiment comparing gene expression between antibiotic-treated and untreated bacteria. The results are displayed in the volcano plot shown, where the x-axis is log₂(fold change) and the y-axis is -log₁₀(p-value). A dashed horizontal line indicates the significance threshold of p = 0.01. Based on the plot, where would a gene be located if it was highly upregulated by the antibiotic and the change was extremely statistically significant?
- In the upper left region.
- In the upper right region. (correct answer)
- In the lower central region, near a log₂(fold change) of 0.
- On the dashed horizontal line with a large positive log₂(fold change).
Explanation: In a standard volcano plot, the x-axis represents fold change and the y-axis represents statistical significance. 'Highly upregulated' corresponds to a large positive log₂(fold change) (the right side). 'Extremely statistically significant' corresponds to a very small p-value, which translates to a large -log₁₀(p-value) (the top). Therefore, the gene would be in the upper right region.
Question 2
A microarray experiment reveals that the expression of gene CycD has a log₂(fold change) of 3.0 in cancer cells compared to normal cells. This indicates that the expression level of CycD mRNA in cancer cells is:
- 3 times higher than in normal cells.
- 6 times higher than in normal cells.
- 8 times higher than in normal cells. (correct answer)
- 9 times higher than in normal cells.
Explanation: The log₂(fold change) is the base-2 logarithm of the expression ratio. To find the actual fold change, one must calculate 2 raised to the power of the log₂ value. In this case, the calculation is 2³ = 8. Therefore, the expression of CycD is 8 times higher in cancer cells.
Question 3
Gene A has a basal expression of 5 transcripts per million (TPM) and is upregulated to 40 TPM upon stimulus. Gene B has a basal expression of 10,000 TPM and is upregulated to 20,000 TPM by the same stimulus. Based on this data, which statement is the most accurate?
- Gene A shows a greater log₂(fold change) than Gene B. (correct answer)
- The biological impact of Gene B's upregulation is greater due to its higher absolute expression.
- Gene A and Gene B are regulated by the same transcription factor.
- The absolute increase in transcript number is greater for Gene A than for Gene B.
Explanation: This question tests the difference between relative (fold change) and absolute changes. The fold change for Gene A is 40/5 = 8 (log₂FC = 3). The fold change for Gene B is 20,000/10,000 = 2 (log₂FC = 1). Thus, Gene A has a greater fold change. While Gene B has a much larger absolute increase (10,000 TPM vs 35 TPM), its relative change is smaller. Biological impact (B) or co-regulation (C) cannot be determined from this data alone.
Question 4
A researcher measures gene expression in treated vs. untreated cells. In treated cells, MYC expression is 300 units and housekeeping gene GAPDH is 1500 units. In untreated cells, MYC is 50 units and GAPDH is 1000 units. Which calculation correctly determines the normalized log₂(fold change) of MYC expression?
- log2(300/50)
- log2((300/1500)/(50/1000)) (correct answer)
- log2((300−50)/(1500−1000))
- log2(300)/log2(50)
Explanation: Proper calculation of fold change requires normalization to a housekeeping gene to control for variations in initial sample amount. The expression of the target gene (MYC) should be divided by the expression of the housekeeping gene (GAPDH) for each condition separately. Then, the ratio of the normalized treated value to the normalized untreated value is calculated. The log₂ of this final ratio gives the normalized log₂(fold change).
Question 5
A new chemotherapy agent is tested on cancer cells. After 24 hours, the anti-apoptotic gene Bcl-2 shows a log₂(fold change) of -1.0, while the cell cycle gene CDK1 shows a log₂(fold change) of -3.0. How does the reduction in CDK1 expression compare to the reduction in Bcl-2 expression?
- The expression of CDK1 is reduced 3 times more than that of Bcl-2.
- The expression of CDK1 is reduced to one-eighth of its original level, while Bcl-2 is reduced to one-half. (correct answer)
- The expression of both genes is reduced by a similar magnitude, since both are negative.
- The expression of CDK1 is reduced by 3-fold, and Bcl-2 is reduced by 1-fold.
Explanation: A log₂(fold change) of -1.0 corresponds to a fold change of 2⁻¹ = 1/2. A log₂(fold change) of -3.0 corresponds to a fold change of 2⁻³ = 1/8. Therefore, Bcl-2 expression is halved, and CDK1 expression is reduced to one-eighth of its original level. Comparing log values linearly (A) is incorrect.
Question 6
A researcher investigates a pathway where a transcription factor (TF) is known to activate expression of its target gene (TG). Following drug treatment, the expression of TF shows a log₂(fold change) of -2.5 (p=0.001) and the expression of TG shows a log₂(fold change) of -2.8 (p=0.003). What is the most consistent interpretation of these data?
- The drug likely leads to decreased levels of the TF, resulting in reduced activation of the TG. (correct answer)
- The TF is a repressor of the TG, and the drug enhances the TF's function.
- The drug likely enhances the binding of the TF to the TG's promoter.
- The expression changes of the TF and TG are likely unrelated to the drug treatment.
Explanation: When analyzing gene expression data involving transcription factor-target gene relationships, focus on the direction and magnitude of expression changes to understand regulatory mechanisms.
A log₂(fold change) of -2.5 means the transcription factor (TF) expression decreased by about 5.7-fold (22.5), while -2.8 indicates the target gene (TG) decreased by about 7-fold (22.8). Both changes are statistically significant (p<0.05) and occur in the same direction - downward. Since we know the TF normally activates the TG, this pattern makes biological sense: less TF available means less activation of its target.
Choice A correctly interprets this relationship. The drug reduces TF levels, which leads to decreased activation and lower TG expression.
Choice B incorrectly suggests the TF is a repressor. If that were true, decreased TF levels would increase TG expression, not decrease it as observed.
Choice C claims the drug enhances TF binding. Enhanced binding would increase TG expression despite lower TF levels, contradicting the observed decrease in TG expression.
Choice D dismisses the relationship as unrelated to drug treatment. However, both genes show significant expression changes with proper statistical support, and the directional relationship is consistent with known TF-TG biology.
Remember: When interpreting transcription factor experiments, always consider whether the observed expression changes align with the known regulatory relationship. Activators and their targets should generally change in the same direction, while repressors and their targets should change in opposite directions. Question 7
After treating liver cells with a drug, a researcher observes the following expression changes: SREBP-1c (a master regulator of lipogenesis) has a log₂(FC) of -3.1. Its target gene FASN (fatty acid synthase) has a log₂(FC) of -2.8. Gene CPT1A (promotes fatty acid oxidation) has a log₂(FC) of +2.1. What is the most likely overall metabolic shift occurring in these cells?
- Cells are increasing both the synthesis and breakdown of fatty acids simultaneously.
- The drug's only effect is to increase the expression of genes involved in fatty acid oxidation.
- The cells are coordinately shutting down fatty acid synthesis and increasing fatty acid breakdown. (correct answer)
- The primary effect of the drug is to decrease the expression of the master regulator SREBP-1c.
Explanation: This question requires integrating multiple data points into a coherent biological story. The strong downregulation of SREBP-1c and its target FASN indicates a shutdown of fatty acid synthesis. The simultaneous strong upregulation of CPT1A indicates an increase in fatty acid oxidation (breakdown). Choice C is the only one that accurately synthesizes all these observations into an overall metabolic shift.
Question 8
The expression of an inflammation-related gene, TNFα, is reported to have a log₂(fold change) of approximately +1.58 following bacterial infection. This value corresponds to an approximate increase in TNFα expression of:
- 1.58-fold
- 2.58-fold
- 4-fold
- 3-fold (correct answer)
Explanation: When you encounter log₂(fold change) values in gene expression studies, you're dealing with a logarithmic transformation that needs to be converted back to understand the actual fold change. The key is remembering that to "undo" a logarithm, you use the corresponding exponential function.
Since this is log₂(fold change) = +1.58, you need to calculate 2^1.58 to find the actual fold change. Using the fact that 2^1.5 = 2√2 ≈ 2.83, and 2^1.58 will be slightly higher, this gives us approximately 3-fold increase in TNFα expression.
Looking at the wrong answers: Choice A (1.58-fold) represents the common mistake of treating the log value as the actual fold change—this ignores the logarithmic transformation entirely. Choice B (2.58-fold) appears to come from adding 1 to the log value (1 + 1.58), which has no mathematical basis in logarithmic conversions. Choice C (4-fold) would correspond to log₂(fold change) = 2, since 2² = 4, so this overestimates the fold change.
The correct answer is D (3-fold) because 21.58≈3.
Study tip: For genetics exams, memorize these key log₂ values: log₂(2) = 1, log₂(4) = 2, and log₂(8) = 3. When you see decimal values between these integers, you can quickly estimate the fold change. Always remember that log₂(fold change) requires calculating 2^(that value) to get your final answer. Question 9
An experiment compares gene expression in a drug-resistant cancer cell line versus the parental (sensitive) cell line. Gene MDR1 shows a log₂(fold change) of +4.0. Gene CASP8, an apoptosis promoter, shows a log₂(fold change) of -5.0. Based on these data, which interpretation is most accurate?
- The change in MDR1 expression is of greater magnitude than the change in CASP8 expression.
- The expression of CASP8 is reduced by 5-fold in the resistant cells.
- The magnitude of change in CASP8 expression is greater than that for MDR1. (correct answer)
- The absolute expression level of MDR1 is higher than that of CASP8 in resistant cells.
Explanation: The magnitude of change is determined by the absolute value of the log₂(fold change). For MDR1, the magnitude is |+4.0| = 4.0. For CASP8, the magnitude is |-5.0| = 5.0. Since 5.0 > 4.0, the magnitude of change for CASP8 is greater. Fold change data provides no information about absolute expression levels (D). A log₂(fold change) of -5.0 corresponds to a 2⁵ = 32-fold reduction, not a 5-fold reduction (B).
Question 10
After treating liver cells with a drug, a researcher observes the following expression changes: SREBP-1c (a master regulator of lipogenesis) has a log₂(FC) of -3.1. Its target gene FASN (fatty acid synthase) has a log₂(FC) of -2.8. Gene CPT1A (promotes fatty acid oxidation) has a log₂(FC) of +2.1. What is the most likely overall metabolic shift occurring in these cells?
- Cells are increasing both the synthesis and breakdown of fatty acids simultaneously.
- The drug's only effect is to increase the expression of genes involved in fatty acid oxidation.
- The cells are coordinately shutting down fatty acid synthesis and increasing fatty acid breakdown. (correct answer)
- The primary effect of the drug is to decrease the expression of the master regulator SREBP-1c.
Explanation: This question requires integrating multiple data points into a coherent biological story. The strong downregulation of SREBP-1c and its target FASN indicates a shutdown of fatty acid synthesis. The simultaneous strong upregulation of CPT1A indicates an increase in fatty acid oxidation (breakdown). Choice C is the only one that accurately synthesizes all these observations into an overall metabolic shift.
Question 11
In an experiment, the expression of Gene X increases from a baseline of 10 mRNA transcripts per cell to 30 transcripts per cell after treatment. The expression of Gene Y increases from 1,000 to 3,000 transcripts per cell following the same treatment. Which statement correctly compares the change in expression for these two genes?
- The fold change for Gene Y is greater than the fold change for Gene X.
- The absolute change in transcript number for Gene X is greater than for Gene Y.
- The log₂(fold change) is the same for both Gene X and Gene Y. (correct answer)
- Gene Y is more important because its final expression level is higher.
Explanation: Fold change is a relative measure. For Gene X, the fold change is 30/10 = 3. For Gene Y, the fold change is 3000/1000 = 3. Since both genes have a fold change of 3, their log₂(fold change) will also be identical (log₂(3) ≈ 1.58).
Question 12
A new chemotherapy agent is tested on cancer cells. After 24 hours, the anti-apoptotic gene Bcl-2 shows a log₂(fold change) of -1.0, while the cell cycle gene CDK1 shows a log₂(fold change) of -3.0. How does the reduction in CDK1 expression compare to the reduction in Bcl-2 expression?
- The expression of CDK1 is reduced 3 times more than that of Bcl-2.
- The expression of CDK1 is reduced to one-eighth of its original level, while Bcl-2 is reduced to one-half. (correct answer)
- The expression of both genes is reduced by a similar magnitude, since both are negative.
- The expression of CDK1 is reduced by 3-fold, and Bcl-2 is reduced by 1-fold.
Explanation: A log₂(fold change) of -1.0 corresponds to a fold change of 2⁻¹ = 1/2. A log₂(fold change) of -3.0 corresponds to a fold change of 2⁻³ = 1/8. Therefore, Bcl-2 expression is halved, and CDK1 expression is reduced to one-eighth of its original level. Comparing log values linearly (A) is incorrect.
Question 13
Gene A has a basal expression of 5 transcripts per million (TPM) and is upregulated to 40 TPM upon stimulus. Gene B has a basal expression of 10,000 TPM and is upregulated to 20,000 TPM by the same stimulus. Based on this data, which statement is the most accurate?
- Gene A shows a greater log₂(fold change) than Gene B. (correct answer)
- The biological impact of Gene B's upregulation is greater due to its higher absolute expression.
- Gene A and Gene B are regulated by the same transcription factor.
- The absolute increase in transcript number is greater for Gene A than for Gene B.
Explanation: This question tests the difference between relative (fold change) and absolute changes. The fold change for Gene A is 40/5 = 8 (log₂FC = 3). The fold change for Gene B is 20,000/10,000 = 2 (log₂FC = 1). Thus, Gene A has a greater fold change. While Gene B has a much larger absolute increase (10,000 TPM vs 35 TPM), its relative change is smaller. Biological impact (B) or co-regulation (C) cannot be determined from this data alone.
Question 14
A researcher investigates a pathway where a transcription factor (TF) is known to activate expression of its target gene (TG). Following drug treatment, the expression of TF shows a log₂(fold change) of -2.5 (p=0.001) and the expression of TG shows a log₂(fold change) of -2.8 (p=0.003). What is the most consistent interpretation of these data?
- The drug likely leads to decreased levels of the TF, resulting in reduced activation of the TG. (correct answer)
- The TF is a repressor of the TG, and the drug enhances the TF's function.
- The drug likely enhances the binding of the TF to the TG's promoter.
- The expression changes of the TF and TG are likely unrelated to the drug treatment.
Explanation: When analyzing gene expression data involving transcription factor-target gene relationships, focus on the direction and magnitude of expression changes to understand regulatory mechanisms.
A log₂(fold change) of -2.5 means the transcription factor (TF) expression decreased by about 5.7-fold (22.5), while -2.8 indicates the target gene (TG) decreased by about 7-fold (22.8). Both changes are statistically significant (p<0.05) and occur in the same direction - downward. Since we know the TF normally activates the TG, this pattern makes biological sense: less TF available means less activation of its target.
Choice A correctly interprets this relationship. The drug reduces TF levels, which leads to decreased activation and lower TG expression.
Choice B incorrectly suggests the TF is a repressor. If that were true, decreased TF levels would increase TG expression, not decrease it as observed.
Choice C claims the drug enhances TF binding. Enhanced binding would increase TG expression despite lower TF levels, contradicting the observed decrease in TG expression.
Choice D dismisses the relationship as unrelated to drug treatment. However, both genes show significant expression changes with proper statistical support, and the directional relationship is consistent with known TF-TG biology.
Remember: When interpreting transcription factor experiments, always consider whether the observed expression changes align with the known regulatory relationship. Activators and their targets should generally change in the same direction, while repressors and their targets should change in opposite directions. Question 15
In a study on cellular senescence, the expression of gene LMNB1, which encodes a nuclear lamina protein, was found to have a log₂(fold change) of -2.0 in senescent cells relative to proliferating cells. Which statement accurately describes the expression of LMNB1?
- Its expression is halved in senescent cells compared to proliferating cells.
- Its expression is reduced to one-quarter of the level in proliferating cells. (correct answer)
- Its expression is completely silenced in senescent cells.
- Its expression is two times lower in senescent cells.
Explanation: A log₂(fold change) of -2.0 corresponds to an absolute fold change of 2⁻² = 1/(2²) = 1/4. This means the expression of LMNB1 in senescent cells is one-quarter of the expression level found in proliferating cells.
Question 16
A scientist obtains a tumor sample and measures the mRNA level for gene VEGF, finding it to be 150 units. The scientist concludes that VEGF is upregulated in this tumor, promoting angiogenesis. Why is this conclusion not supported by the data provided?
- The mRNA level might not correlate with the protein level for VEGF.
- An mRNA level of 150 units is generally considered too low to be biologically active.
- Angiogenesis is controlled by a network of genes, not just VEGF.
- There is no comparison to VEGF expression in a non-tumor control tissue. (correct answer)
Explanation: The term 'upregulated' is inherently comparative. It means the expression is higher relative to something else. Without a control sample, such as adjacent normal tissue from the same patient, it is impossible to determine if the measured value of 150 units represents an increase, a decrease, or no change. The conclusion is therefore unfounded based on the data presented.
Question 17
In comparing a mutant to a wild-type strain of yeast, the expression ratio for gene ade2 was calculated as (mutant expression / wild-type expression) = 0.125. What is the corresponding log₂(fold change) for gene ade2?
- -3.0 (correct answer)
- -8.0
- 3.0
- 0.125
Explanation: When analyzing gene expression data, you'll often encounter expression ratios that need to be converted to log₂(fold change) values. This conversion is essential because log scales make it easier to compare upregulation and downregulation symmetrically and to perform statistical analyses.
To find the log₂(fold change), you simply take the logarithm base 2 of the expression ratio. Here, the ratio is 0.125, so you need to calculate log2(0.125). Since 0.125=81=231=2−3, then log2(0.125)=log2(2−3)=−3. This negative value indicates downregulation of ade2 in the mutant compared to wild-type.
Looking at the incorrect answers: Choice B (-8.0) likely comes from incorrectly calculating log2(0.125) or confusing it with the reciprocal calculation. Choice C (3.0) represents a common error of forgetting the negative sign—this would be correct if the gene were upregulated 8-fold instead of downregulated. Choice D (0.125) simply restates the original ratio without any transformation, missing the point of the question entirely.
Study tip: Remember that expression ratios less than 1.0 always give negative log₂ values (downregulation), while ratios greater than 1.0 give positive log₂ values (upregulation). Practice converting common fractions like 1/2 (-1), 1/4 (-2), and 1/8 (-3) to build your intuition for these calculations. Question 18
In comparing a mutant to a wild-type strain of yeast, the expression ratio for gene ade2 was calculated as (mutant expression / wild-type expression) = 0.125. What is the corresponding log₂(fold change) for gene ade2?
- -3.0 (correct answer)
- -8.0
- 3.0
- 0.125
Explanation: When analyzing gene expression data, you'll often encounter expression ratios that need to be converted to log₂(fold change) values. This conversion is essential because log scales make it easier to compare upregulation and downregulation symmetrically and to perform statistical analyses.
To find the log₂(fold change), you simply take the logarithm base 2 of the expression ratio. Here, the ratio is 0.125, so you need to calculate log2(0.125). Since 0.125=81=231=2−3, then log2(0.125)=log2(2−3)=−3. This negative value indicates downregulation of ade2 in the mutant compared to wild-type.
Looking at the incorrect answers: Choice B (-8.0) likely comes from incorrectly calculating log2(0.125) or confusing it with the reciprocal calculation. Choice C (3.0) represents a common error of forgetting the negative sign—this would be correct if the gene were upregulated 8-fold instead of downregulated. Choice D (0.125) simply restates the original ratio without any transformation, missing the point of the question entirely.
Study tip: Remember that expression ratios less than 1.0 always give negative log₂ values (downregulation), while ratios greater than 1.0 give positive log₂ values (upregulation). Practice converting common fractions like 1/2 (-1), 1/4 (-2), and 1/8 (-3) to build your intuition for these calculations. Question 19
A researcher measures gene expression in treated vs. untreated cells. In treated cells, MYC expression is 300 units and housekeeping gene GAPDH is 1500 units. In untreated cells, MYC is 50 units and GAPDH is 1000 units. Which calculation correctly determines the normalized log₂(fold change) of MYC expression?
- log2(300/50)
- log2((300/1500)/(50/1000)) (correct answer)
- log2((300−50)/(1500−1000))
- log2(300)/log2(50)
Explanation: Proper calculation of fold change requires normalization to a housekeeping gene to control for variations in initial sample amount. The expression of the target gene (MYC) should be divided by the expression of the housekeeping gene (GAPDH) for each condition separately. Then, the ratio of the normalized treated value to the normalized untreated value is calculated. The log₂ of this final ratio gives the normalized log₂(fold change).
Question 20
An experiment compares gene expression in a drug-resistant cancer cell line versus the parental (sensitive) cell line. Gene MDR1 shows a log₂(fold change) of +4.0. Gene CASP8, an apoptosis promoter, shows a log₂(fold change) of -5.0. Based on these data, which interpretation is most accurate?
- The change in MDR1 expression is of greater magnitude than the change in CASP8 expression.
- The expression of CASP8 is reduced by 5-fold in the resistant cells.
- The magnitude of change in CASP8 expression is greater than that for MDR1. (correct answer)
- The absolute expression level of MDR1 is higher than that of CASP8 in resistant cells.
Explanation: The magnitude of change is determined by the absolute value of the log₂(fold change). For MDR1, the magnitude is |+4.0| = 4.0. For CASP8, the magnitude is |-5.0| = 5.0. Since 5.0 > 4.0, the magnitude of change for CASP8 is greater. Fold change data provides no information about absolute expression levels (D). A log₂(fold change) of -5.0 corresponds to a 2⁵ = 32-fold reduction, not a 5-fold reduction (B).