All questions
Question 1
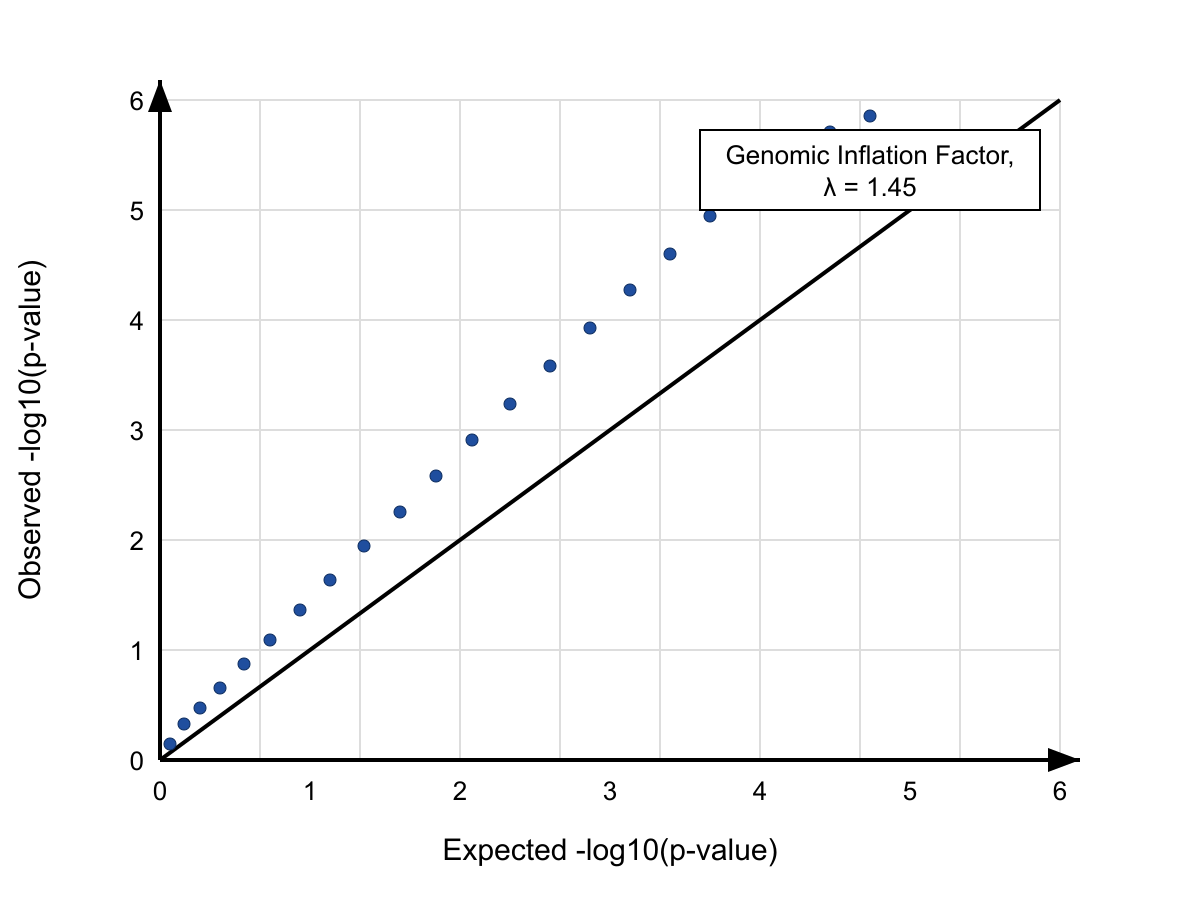
Analyze the Quantile-Quantile (QQ) plot from a GWAS shown. The genomic inflation factor is noted to be λ = 1.45. What is the most appropriate conclusion for the research team to draw?
- The study is well-calibrated and the observed inflation is due to the highly polygenic nature of the trait.
- The results are invalid due to severe, uncorrected systematic bias, likely population stratification. (correct answer)
- Genotyping quality is poor for the most significant SNPs, leading to an artificially strong signal.
- The sample size is too small, resulting in a lack of power and a noisy distribution of p-values.
Explanation: The QQ plot shows a strong, early, and consistent deviation of the observed p-values from the null expectation (the y=x line). This pattern, coupled with a high genomic inflation factor (λ = 1.45), is the classic signature of systemic bias. A well-controlled study should have λ close to 1.0 (e.g., 1.0-1.05). A value of 1.45 indicates widespread inflation of test statistics across the entire genome, most commonly caused by uncorrected population stratification or extensive cryptic relatedness. While high polygenicity (A) can cause a tail-end deviation, it does not explain this level of early and uniform inflation. Poor genotyping of specific SNPs (C) would affect individual points, not the entire distribution. A small sample size (D) would lead to low power, meaning the observed p-values would be less significant and less likely to show such strong inflation.
Question 2
A GWAS on a cohort of 10,000 individuals identifies three novel loci associated with asthma at p < 5x10^-8. According to best practices in the field, what is the most crucial immediate next step for these findings?
- Initiating development of a drug that targets the proteins encoded by the genes in these loci.
- Conducting a replication study by testing the three lead SNPs in a large, independent cohort. (correct answer)
- Performing deep sequencing of the three loci in the original 10,000 individuals to find the causal variant.
- Calculating a polygenic risk score for asthma using these three SNPs and testing its clinical utility.
Explanation: The gold standard for validating a GWAS finding is replication in an independent sample. Before investing significant resources in follow-up studies like sequencing (C) or drug development (A), it is essential to confirm that the initial association is not a false positive specific to the discovery cohort (due to chance or subtle biases). A successful replication provides strong evidence that the association is robust. Calculating a PRS (D) is a potential application, but it is premature before the loci are independently validated.
Question 3
In a GWAS with 5,000 cases and 5,000 controls, a common variant (MAF=0.3) has a true odds ratio of 1.5 for a disease. However, the result is not genome-wide significant (p=1x10^-6). What is the most likely reason for this outcome?
- The effect size is too small to be detected in any humanly achievable sample size.
- The presence of population stratification completely masked an otherwise strong genetic signal.
- The variant is in linkage equilibrium with the true causal variant, obscuring the association signal.
- The study had insufficient statistical power to detect this moderate effect size at the stringent p < 5x10^-8 threshold. (correct answer)
Explanation: When you encounter GWAS questions, focus on the relationship between statistical power, effect size, sample size, and significance thresholds. This question tests whether you understand when studies fail to reach genome-wide significance despite having a real genetic effect.
The study has a moderate effect size (OR = 1.5) and a reasonably large sample (10,000 total participants), but fails to reach the stringent genome-wide significance threshold of p < 5×10⁻⁸. With only 10,000 participants, this study likely lacks sufficient statistical power to detect a moderate effect at such a strict significance level. GWAS require enormous sample sizes (often 100,000+ participants) to reliably detect common variants with modest effects while controlling for multiple testing across millions of SNPs.
Option A is incorrect because an odds ratio of 1.5 is definitely detectable with sufficiently large samples - many GWAS have successfully identified variants with similar or smaller effect sizes. Option B overstates population stratification's impact; while stratification can cause problems, it typically wouldn't completely mask a strong signal, and modern GWAS use principal components and other methods to control for this. Option C contains a logical error - variants in linkage equilibrium are independently inherited, so this wouldn't obscure an association signal. You're thinking of linkage disequilibrium, where the tested variant tags the causal variant.
Remember that GWAS statistical power depends heavily on the combination of effect size, allele frequency, sample size, and significance threshold. When a study fails to reach genome-wide significance despite reasonable effect sizes, insufficient power is often the culprit.
Question 4
The 'missing heritability' problem describes the observation that genome-wide significant SNPs identified by GWAS explain only a fraction of the heritability estimated from family studies. Which of the following is NOT considered a likely contributor to this gap?
- The cumulative effect of many common variants with effect sizes too small to reach genome-wide significance.
- The contribution of rare variants that are not well-tagged by standard genotyping arrays.
- Systematic overestimation of heritability from twin and family studies due to shared environmental factors.
- The existence of a few undiscovered variants with very large, Mendelian-like effects on the trait. (correct answer)
Explanation: The 'missing heritability' puzzle has several proposed solutions. Plausible contributors include many common variants of tiny effect that fall below the stringent significance threshold (A), rare variants not captured by GWAS arrays (B), and potential overestimation of heritability from classical methods (C). However, the existence of major undiscovered Mendelian-like variants (D) is considered unlikely for most common, complex traits. GWAS is well-powered to detect common variants with large effects; if such variants existed, they would have been among the first and easiest to find.
Question 5
A large genome-wide association study (GWAS) for Crohn's disease identifies a SNP with a p-value of 1x10^-15. This SNP is located in a 100kb region of high linkage disequilibrium (LD) that contains three genes. Subsequent fine-mapping and functional studies fail to identify a causal role for this specific SNP. Which of the following is the most likely explanation for the initial GWAS result?
- The initial association was a Type I error due to insufficient multiple testing correction.
- The identified SNP is a 'tag SNP' that is strongly correlated with a true, ungenotyped causal variant elsewhere in the LD block. (correct answer)
- The three genes in the region must act together epistatically to cause the disease, making the effect of a single SNP undetectable.
- The study was confounded by severe population stratification, creating a spurious association signal in this genomic region.
Explanation: The most fundamental concept in interpreting GWAS hits is linkage disequilibrium. A highly significant SNP (the 'lead SNP' or 'tag SNP') is often not the biologically functional variant itself. Instead, it is in strong non-random association (LD) with the true causal variant, which might not have been included on the genotyping array. The entire LD block shows a signal because all variants within it are correlated. Distractor A is unlikely given the extremely low p-value, which far surpasses the standard genome-wide significance threshold (e.g., 5x10^-8). Distractor C proposes epistasis, which is possible but not the most direct or common explanation for a single strong locus. Distractor D is a possible issue in any GWAS, but the scenario describes a very strong, localized signal, which is more characteristic of a true locus in high LD than a genome-wide artifact.
Question 6
A GWAS for educational attainment identifies 1,271 independent genome-wide significant loci. A critic argues the study is flawed because 'no single gene can determine educational attainment.' How does the design and typical result of a GWAS address this criticism?
- The criticism is valid; GWAS is only suitable for simple Mendelian traits, not complex behavioral ones.
- GWAS corrects for this by focusing only on the single SNP with the lowest p-value as the sole determinant of the trait.
- The study identifies causal genes, and the large number found proves the trait is determined by many individual genes.
- GWAS assumes a polygenic model, where each significant locus contributes a very small, additive effect to the overall phenotype. (correct answer)
Explanation: When you encounter GWAS (Genome-Wide Association Studies) questions, remember that these studies are specifically designed to identify genetic variants associated with complex traits that are influenced by many genes, each with small effects.
The critic's argument reflects a fundamental misunderstanding of how GWAS works. GWAS operates under a polygenic model, which assumes that complex traits like educational attainment result from the combined effects of many genetic variants, each contributing a tiny amount to the overall phenotype. The discovery of 1,271 independent loci actually supports this model perfectly—it shows that educational attainment is influenced by hundreds of genetic variants scattered across the genome, each with a very small individual effect size (typically explaining less than 1% of trait variance).
Option A is wrong because GWAS was specifically developed for complex traits, not simple Mendelian ones. Simple traits typically involve single genes with large effects, which don't require genome-wide scanning. Option B misrepresents GWAS methodology—these studies examine all identified significant variants together, not just the most statistically significant one. Option C incorrectly claims that GWAS identifies causal genes when it actually identifies associated genetic variants; establishing causation requires additional functional studies.
The large number of significant loci found in this study demonstrates exactly what GWAS is designed to detect: polygenic architecture where many variants of small effect combine to influence a complex trait.
Study tip: For GWAS questions, remember the key principle: many variants, small effects, complex traits. This distinguishes GWAS from single-gene disease studies and explains why finding hundreds or thousands of associated loci is actually expected, not problematic.
Question 7
A GWAS finds a strong association between a SNP in the CYP1A2 gene region and daily coffee consumption. CYP1A2 is known to be the primary enzyme for caffeine metabolism. The same SNP is also strongly associated with the number of cigarettes smoked per day. What is the most significant challenge in interpreting the coffee consumption association?
- The association may be confounded by smoking behavior, which is correlated with both the SNP and coffee drinking. (correct answer)
- The effect size of the SNP is likely too small to be of any biological importance for caffeine metabolism.
- The true causal variant is likely a rare mutation that was not genotyped on the SNP array.
- The result is probably a false positive because behavioral traits are not strongly influenced by genetics.
Explanation: This scenario describes potential confounding. Smokers tend to drink more coffee, and smoking induces the CYP1A2 enzyme, leading to faster caffeine metabolism. If the SNP is associated with smoking, it will appear to be associated with coffee consumption through this behavioral link, even if it has no direct biological effect on coffee preference. This confounding effect must be statistically adjusted for (e.g., by including smoking status as a covariate) before one can claim a direct genetic association with coffee consumption. B is a statement about effect size, not interpretation. C is a general point about LD, but confounding is the more immediate issue here. D is an incorrect generalization; many behavioral traits have a genetic component.
Question 8
A Quantile-Quantile (QQ) plot generated from a GWAS of hypertension shows that the observed p-values begin to deviate from the expected diagonal line almost immediately and continue to deviate uniformly across the entire distribution. The genomic inflation factor (λ) is calculated to be 1.3. What is the most probable cause of this pattern?
- The trait has a highly polygenic architecture with thousands of true associations.
- The study is well-controlled, and the deviation represents a set of strong, true-positive signals.
- Systematic bias from unaccounted-for population stratification is inflating test statistics. (correct answer)
- A single, rare variant of large effect is driving the association signal for the disease.
Explanation: An early, uniform deviation of observed p-values from the expected null distribution on a QQ plot, reflected by a genomic inflation factor (λ) substantially greater than 1, is the classic sign of systemic bias. The most common cause is uncorrected population stratification, where allele frequency differences between subpopulations in cases and controls create spurious associations across the genome. While polygenicity (A) can cause deviation, it typically manifests as a tail of inflation at the most significant end, not a uniform shift from the beginning. A well-controlled study (B) would show points hugging the diagonal until a late tail departure. A single rare variant (D) would not cause a genome-wide inflation of p-values.
Question 9
A researcher is examining a Manhattan plot from a GWAS. The y-axis of the plot is labeled '-log10(p-value)'. A SNP with a p-value of 1x10^-5 would be plotted at what value on this y-axis?
- 5 (correct answer)
- -5
- 0.00001
- 8
Explanation: The y-axis of a Manhattan plot displays the negative base-10 logarithm of the p-value for each SNP's association test. This transformation converts small p-values (indicating strong evidence of association) into large, positive numbers that are easier to visualize. For a p-value of 1x10^-5, the calculation is -log10(10^-5) = -(-5) = 5. Distractor B makes a sign error. Distractor C is the p-value itself, not its transformed value. Distractor D corresponds to a p-value of 1x10^-8, which is the typical threshold for genome-wide significance, a common point of confusion.
Question 10
A research team conducts a GWAS for a rare autoimmune disease. They recruit cases from a specialized clinic in Northern Europe and controls from a general population database in Southern Europe. The study identifies numerous loci with highly significant associations. Which action is most critical before interpreting these loci as being disease-related?
- Sequencing the associated loci to identify the precise causal mutations in the case subjects.
- Replicating the associations in an independent cohort with carefully matched ancestry for cases and controls. (correct answer)
- Performing functional studies on the genes nearest to the most significant SNPs to understand their mechanism.
- Increasing the p-value threshold to 1x10^-5 to account for the rarity of the disease being studied.
Explanation: The study design has a major flaw: cases and controls are drawn from genetically distinct populations (Northern vs. Southern Europe). This creates massive potential for confounding by population stratification. Any genetic variants that differ in frequency between these two populations will appear to be associated with the disease, regardless of any true biological link. Therefore, the most critical step is to attempt to replicate the findings in a new, independent study where cases and controls are carefully matched for genetic ancestry. This will determine if the signals are real or simply artifacts of the poor initial design. Functional studies (A, C) are premature until the associations are validated. Relaxing the p-value threshold (D) would only increase the number of false positives.
Question 11
What is the primary advantage of a genome-wide association study (GWAS) compared to a candidate gene study for investigating the genetics of a complex disease?
- GWAS requires a much smaller sample size to achieve statistical significance for an association.
- GWAS is a hypothesis-free approach that can identify novel genes and biological pathways. (correct answer)
- GWAS directly identifies the causal functional variant rather than just a correlated marker.
- GWAS is less susceptible to confounding by factors like population stratification.
Explanation: The key strength of GWAS is its 'hypothesis-free' nature. It surveys the entire genome without a priori assumptions about which genes might be involved. This allows for the discovery of completely novel associations and biological pathways that would be missed by a candidate gene study, which is limited to testing genes already suspected of involvement. GWAS requires a much larger, not smaller, sample size (A) due to the massive multiple testing burden. It does not directly identify causal variants (C), but rather regions of LD that are associated. GWAS is highly susceptible to population stratification (D), which must be carefully controlled for.
Question 12
A GWAS on a cohort of 10,000 individuals identifies three novel loci associated with asthma at p < 5x10^-8. According to best practices in the field, what is the most crucial immediate next step for these findings?
- Initiating development of a drug that targets the proteins encoded by the genes in these loci.
- Conducting a replication study by testing the three lead SNPs in a large, independent cohort. (correct answer)
- Performing deep sequencing of the three loci in the original 10,000 individuals to find the causal variant.
- Calculating a polygenic risk score for asthma using these three SNPs and testing its clinical utility.
Explanation: The gold standard for validating a GWAS finding is replication in an independent sample. Before investing significant resources in follow-up studies like sequencing (C) or drug development (A), it is essential to confirm that the initial association is not a false positive specific to the discovery cohort (due to chance or subtle biases). A successful replication provides strong evidence that the association is robust. Calculating a PRS (D) is a potential application, but it is premature before the loci are independently validated.
Question 13
Following a GWAS that identifies a 250kb region of association for a disease, researchers initiate a 'fine-mapping' study. What is the primary objective of this follow-up study?
- To test for gene-environment interactions involving the identified region and lifestyle factors.
- To replicate the initial association signal in a larger, more diverse population cohort.
- To increase the density of genotyped or imputed variants in the region to narrow down the set of potential causal SNPs. (correct answer)
- To estimate the total proportion of disease heritability that is explained by this single genomic region.
Explanation: Fine-mapping is the process that follows the discovery of an associated locus. The goal is to move from a large region of correlated SNPs (an LD block) to a much smaller, credible set of variants that are most likely to be the true causal variant(s). This is achieved by using sequencing or dense imputation to get information on all variants in the region and then applying statistical methods to prioritize them based on their association strength and LD patterns. Replication (B) precedes fine-mapping. Testing for interactions (A) and estimating regional heritability (D) are other types of follow-up analyses but do not define fine-mapping.
Question 14
Why do researchers primarily perform meta-analyses of multiple GWAS for the same trait?
- To increase the overall sample size, which enhances the statistical power to detect variants with small effect sizes. (correct answer)
- To identify population-specific genetic effects by comparing results from different ancestries.
- To correct for batch effects and other technical artifacts that may have affected the individual studies.
- To combine different phenotyping methods for the trait in order to create a more robust disease definition.
Explanation: When you encounter questions about meta-analyses in genetics, focus on the fundamental principle: combining data to overcome the limitations of individual studies. GWAS (genome-wide association studies) face a classic challenge in genetics research—most trait-associated variants have very small effect sizes that require enormous sample sizes to detect reliably.
Answer A is correct because meta-analysis directly addresses this power problem. By pooling data from multiple GWAS of the same trait, researchers dramatically increase their total sample size, which provides the statistical power needed to identify variants that might be missed in smaller individual studies. Think of it as turning up the volume on a weak genetic signal until it becomes detectable above the noise.
Answer B is incorrect because comparing population-specific effects isn't the primary purpose of meta-analysis—that would be the goal of population stratification or ancestry-specific analyses. Answer C misunderstands the methodology; meta-analyses typically combine summary statistics rather than raw data, so they don't directly correct technical artifacts from individual studies. Answer D confuses meta-analysis with phenotype harmonization—while consistent phenotyping is important for meta-analysis, the goal isn't to create new disease definitions but to leverage existing data.
Remember this pattern: when you see questions about combining multiple genetic studies, the answer usually relates to statistical power and sample size. The genetics field constantly battles small effect sizes, making "more data = more power" a central theme in study design questions.
Question 15
In a GWAS with 5,000 cases and 5,000 controls, a common variant (MAF=0.3) has a true odds ratio of 1.5 for a disease. However, the result is not genome-wide significant (p=1x10^-6). What is the most likely reason for this outcome?
- The effect size is too small to be detected in any humanly achievable sample size.
- The presence of population stratification completely masked an otherwise strong genetic signal.
- The variant is in linkage equilibrium with the true causal variant, obscuring the association signal.
- The study had insufficient statistical power to detect this moderate effect size at the stringent p < 5x10^-8 threshold. (correct answer)
Explanation: When you encounter GWAS questions, focus on the relationship between statistical power, effect size, sample size, and significance thresholds. This question tests whether you understand when studies fail to reach genome-wide significance despite having a real genetic effect.
The study has a moderate effect size (OR = 1.5) and a reasonably large sample (10,000 total participants), but fails to reach the stringent genome-wide significance threshold of p < 5×10⁻⁸. With only 10,000 participants, this study likely lacks sufficient statistical power to detect a moderate effect at such a strict significance level. GWAS require enormous sample sizes (often 100,000+ participants) to reliably detect common variants with modest effects while controlling for multiple testing across millions of SNPs.
Option A is incorrect because an odds ratio of 1.5 is definitely detectable with sufficiently large samples - many GWAS have successfully identified variants with similar or smaller effect sizes. Option B overstates population stratification's impact; while stratification can cause problems, it typically wouldn't completely mask a strong signal, and modern GWAS use principal components and other methods to control for this. Option C contains a logical error - variants in linkage equilibrium are independently inherited, so this wouldn't obscure an association signal. You're thinking of linkage disequilibrium, where the tested variant tags the causal variant.
Remember that GWAS statistical power depends heavily on the combination of effect size, allele frequency, sample size, and significance threshold. When a study fails to reach genome-wide significance despite reasonable effect sizes, insufficient power is often the culprit.
Question 16
A GWAS for educational attainment identifies 1,271 independent genome-wide significant loci. A critic argues the study is flawed because 'no single gene can determine educational attainment.' How does the design and typical result of a GWAS address this criticism?
- The criticism is valid; GWAS is only suitable for simple Mendelian traits, not complex behavioral ones.
- GWAS corrects for this by focusing only on the single SNP with the lowest p-value as the sole determinant of the trait.
- The study identifies causal genes, and the large number found proves the trait is determined by many individual genes.
- GWAS assumes a polygenic model, where each significant locus contributes a very small, additive effect to the overall phenotype. (correct answer)
Explanation: When you encounter GWAS (Genome-Wide Association Studies) questions, remember that these studies are specifically designed to identify genetic variants associated with complex traits that are influenced by many genes, each with small effects.
The critic's argument reflects a fundamental misunderstanding of how GWAS works. GWAS operates under a polygenic model, which assumes that complex traits like educational attainment result from the combined effects of many genetic variants, each contributing a tiny amount to the overall phenotype. The discovery of 1,271 independent loci actually supports this model perfectly—it shows that educational attainment is influenced by hundreds of genetic variants scattered across the genome, each with a very small individual effect size (typically explaining less than 1% of trait variance).
Option A is wrong because GWAS was specifically developed for complex traits, not simple Mendelian ones. Simple traits typically involve single genes with large effects, which don't require genome-wide scanning. Option B misrepresents GWAS methodology—these studies examine all identified significant variants together, not just the most statistically significant one. Option C incorrectly claims that GWAS identifies causal genes when it actually identifies associated genetic variants; establishing causation requires additional functional studies.
The large number of significant loci found in this study demonstrates exactly what GWAS is designed to detect: polygenic architecture where many variants of small effect combine to influence a complex trait.
Study tip: For GWAS questions, remember the key principle: many variants, small effects, complex traits. This distinguishes GWAS from single-gene disease studies and explains why finding hundreds or thousands of associated loci is actually expected, not problematic.
Question 17
A large genome-wide association study (GWAS) for Crohn's disease identifies a SNP with a p-value of 1x10^-15. This SNP is located in a 100kb region of high linkage disequilibrium (LD) that contains three genes. Subsequent fine-mapping and functional studies fail to identify a causal role for this specific SNP. Which of the following is the most likely explanation for the initial GWAS result?
- The initial association was a Type I error due to insufficient multiple testing correction.
- The identified SNP is a 'tag SNP' that is strongly correlated with a true, ungenotyped causal variant elsewhere in the LD block. (correct answer)
- The three genes in the region must act together epistatically to cause the disease, making the effect of a single SNP undetectable.
- The study was confounded by severe population stratification, creating a spurious association signal in this genomic region.
Explanation: The most fundamental concept in interpreting GWAS hits is linkage disequilibrium. A highly significant SNP (the 'lead SNP' or 'tag SNP') is often not the biologically functional variant itself. Instead, it is in strong non-random association (LD) with the true causal variant, which might not have been included on the genotyping array. The entire LD block shows a signal because all variants within it are correlated. Distractor A is unlikely given the extremely low p-value, which far surpasses the standard genome-wide significance threshold (e.g., 5x10^-8). Distractor C proposes epistasis, which is possible but not the most direct or common explanation for a single strong locus. Distractor D is a possible issue in any GWAS, but the scenario describes a very strong, localized signal, which is more characteristic of a true locus in high LD than a genome-wide artifact.
Question 18
A Quantile-Quantile (QQ) plot generated from a GWAS of hypertension shows that the observed p-values begin to deviate from the expected diagonal line almost immediately and continue to deviate uniformly across the entire distribution. The genomic inflation factor (λ) is calculated to be 1.3. What is the most probable cause of this pattern?
- The trait has a highly polygenic architecture with thousands of true associations.
- The study is well-controlled, and the deviation represents a set of strong, true-positive signals.
- Systematic bias from unaccounted-for population stratification is inflating test statistics. (correct answer)
- A single, rare variant of large effect is driving the association signal for the disease.
Explanation: An early, uniform deviation of observed p-values from the expected null distribution on a QQ plot, reflected by a genomic inflation factor (λ) substantially greater than 1, is the classic sign of systemic bias. The most common cause is uncorrected population stratification, where allele frequency differences between subpopulations in cases and controls create spurious associations across the genome. While polygenicity (A) can cause deviation, it typically manifests as a tail of inflation at the most significant end, not a uniform shift from the beginning. A well-controlled study (B) would show points hugging the diagonal until a late tail departure. A single rare variant (D) would not cause a genome-wide inflation of p-values.
Question 19
The threshold for declaring genome-wide significance in a GWAS is typically set at p < 5x10^-8. What is the primary justification for using such a stringent threshold?
- To ensure that any identified associations have a large biological effect size and clinical relevance.
- To account for the high probability of finding chance associations when performing millions of statistical tests. (correct answer)
- To correct for confounding variables such as population stratification and cryptic relatedness.
- To increase the statistical power of the study to detect associations with rare genetic variants.
Explanation: The stringent p-value threshold is a direct consequence of the multiple testing problem. A typical GWAS tests ~1 million independent common variants. A Bonferroni correction for this would be 0.05 / 1,000,000 = 5x10^-8. This threshold is designed to keep the family-wise error rate (the probability of making at least one Type I error) at an acceptable level (e.g., 5%). It does not relate to effect size (A), as a very significant p-value can be associated with a tiny effect size. Confounding variables (C) are addressed through study design and statistical adjustments (like including principal components as covariates), not by the significance threshold itself. A more stringent threshold actually decreases statistical power (D), making it harder to detect true associations.
Question 20
The 'missing heritability' problem describes the observation that genome-wide significant SNPs identified by GWAS explain only a fraction of the heritability estimated from family studies. Which of the following is NOT considered a likely contributor to this gap?
- The cumulative effect of many common variants with effect sizes too small to reach genome-wide significance.
- The contribution of rare variants that are not well-tagged by standard genotyping arrays.
- Systematic overestimation of heritability from twin and family studies due to shared environmental factors.
- The existence of a few undiscovered variants with very large, Mendelian-like effects on the trait. (correct answer)
Explanation: The 'missing heritability' puzzle has several proposed solutions. Plausible contributors include many common variants of tiny effect that fall below the stringent significance threshold (A), rare variants not captured by GWAS arrays (B), and potential overestimation of heritability from classical methods (C). However, the existence of major undiscovered Mendelian-like variants (D) is considered unlikely for most common, complex traits. GWAS is well-powered to detect common variants with large effects; if such variants existed, they would have been among the first and easiest to find.