All questions
Question 1
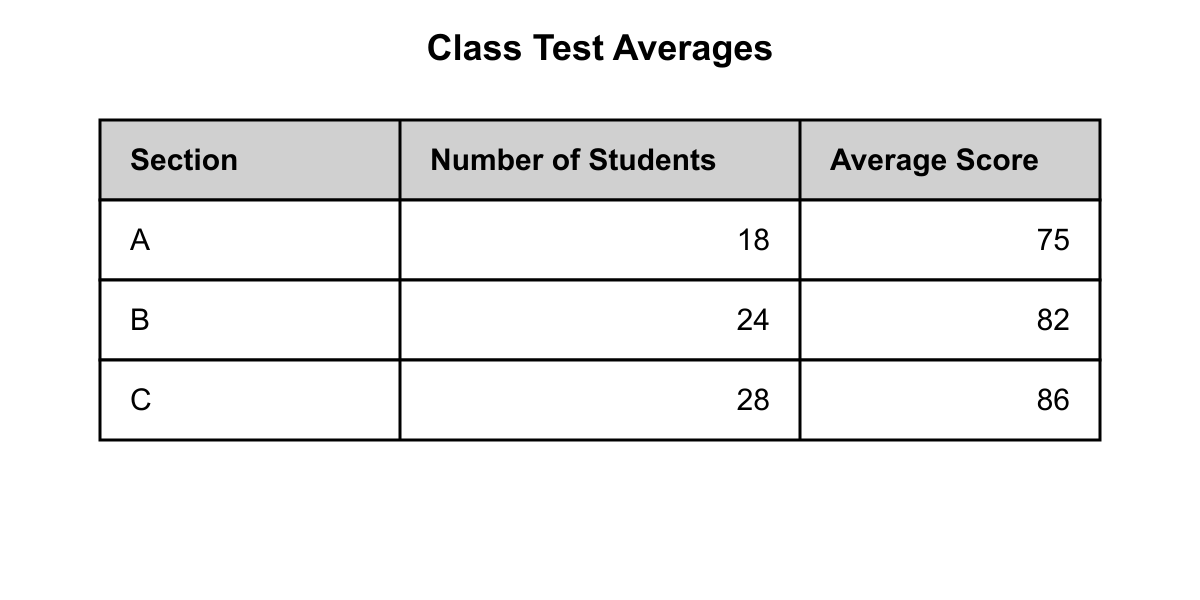
Refer to the table below. The table shows the average test scores for three class sections with different numbers of students. What is the overall weighted mean score across all students in the three sections, rounded to the nearest tenth?
- 78.3
- 80
- 81.8 (correct answer)
- 82.5
Explanation: Total score points = (75)(18) + (82)(24) + (86)(28) = 1350 + 1968 + 2408 = 5726. Total students = 18 + 24 + 28 = 70. Weighted mean = 5726/70 = 81.8. A: incorrect calculation. B: simple average of the three scores (75+82+86)/3 = 81.0. C: correct weighted mean = 81.8. D: overweights the largest section.
Question 2
Use the table below to answer the question. A teacher combined three sections into one average. The mean score of Section A was 78, Section B was 84, and Section C's mean is unknown. If the overall weighted mean of all students was exactly 82, what was the mean score of Section C?
- 80
- 83 (correct answer)
- 85
- 88
Explanation: Let Section C mean = x. Using weighted mean formula: (78×20 + 84×25 + x×30) ÷ 75 = 82. So 1560 + 2100 + 30x = 6150, giving 30x = 2490, therefore x = 83. A: Too low. B: Correct answer. C: Ignores different section sizes. D: Too high.
Question 3
Refer to the box plot. Which of the following conclusions about the data set can be made?
- The mean must equal 45.
- The median is 45. (correct answer)
- Exactly 50% of the data is between 30 and 45.
- The mode of the data is 45.
Explanation: A box plot shows the median as the line inside the box. We can read the median directly (45), but we cannot determine the mean or the mode from a box plot. A: Mean cannot be read from a box plot. B: Correct — the line in the box is the median. C: 25% of data lies between Q1 (30) and median (45), not 50%. D: Mode cannot be determined from a box plot.
Question 4
Use the dot plot to answer the question. The dot plot shows the number of hours 20 employees worked overtime last week. Which of the following statements is true about the data?
- The mean is greater than the median. (correct answer)
- The mean equals the median.
- The mode is greater than the mean.
- The median equals the mode.
Explanation: From dot plot: 0 hrs (2), 1 hr (3), 2 hrs (5), 3 hrs (4), 4 hrs (2), 5 hrs (2), 8 hrs (1), 10 hrs (1). Sum = 0+3+10+12+8+10+8+10 = 61. Mean = 61/20 = 3.05. Median = (10th+11th)/2 = (2+3)/2 = 2.5. Mode = 2. Mean (3.05) > Median (2.5), so A is correct. The outliers (8, 10) pull the mean right. B, C, D are all false based on these values.
Question 5
Refer to the bar graph, showing daily high temperatures recorded for 7 days. If the temperature recorded on Day 4 is removed from the data set, how does the median change?
- The median increases by 1°F. (correct answer)
- The median increases by 2°F.
- The median decreases by 1°F.
- The median does not change.
Explanation: Original data (Days 1-7): 72, 75, 78, 70, 80, 82, 76. Ordered: 70, 72, 75, 76, 78, 80, 82. Median = 76. Remove Day 4 (70): 72, 75, 76, 78, 80, 82. Median = (76+78)/2 = 77. Change = +1°F. A: correct. B: miscounts. C: wrong direction. D: fails to recompute with even count.
Question 6
Use the histogram below to answer the question. The histogram shows the distribution of weekly salaries at a small company. Using the midpoint of each interval, what is the best estimate for the mean weekly salary?
- $725
- $775 (correct answer)
- $815
- $850
Explanation: Midpoints: 550, 650, 750, 850, 950, 1050. Frequencies: 4, 6, 10, 8, 5, 2. Total salary = (550)(4)+(650)(6)+(750)(10)+(850)(8)+(950)(5)+(1050)(2)=2200+3900+7500+6800+4750+2100=27250. Total employees = 35. Mean = 27250/35≈778.57≈775. A: uses lower bounds. B: correct. C: uses upper bounds. D: averages midpoints unweighted. Question 7
The numbers 12,15,9,18,14 are written in order from least to greatest. What is the median of the data set?
- 12
- 14 (correct answer)
- 15
- 18
Explanation: When you encounter a median question, you're dealing with the middle value of a data set when arranged in order. The median is a measure of central tendency that divides your data in half.
First, you need to arrange the given numbers 12,15,9,18,14 from least to greatest: 9,12,14,15,18. Since there are 5 numbers (an odd count), the median is simply the middle value—the 3rd number in this ordered list, which is 14.
Looking at the wrong answers: Choice A (12) is the second value in the ordered list, not the middle one. Choice C (15) is the fourth value, which would be incorrect for the same reason. Choice D (18) is the largest value in the set, which represents the maximum, not the median. These choices might tempt you if you incorrectly ordered the data or miscounted the middle position.
The correct answer is B (14) because it occupies the central position when all five numbers are properly arranged in ascending order.
Remember this key strategy: always rewrite the numbers in order first, even if the problem says they're "written in order"—double-check by doing it yourself. For odd-numbered data sets, count to the middle position: with 5 values, the median is the 3rd value. For even-numbered sets, you'd average the two middle values. This systematic approach prevents errors and ensures you find the true center of your data. Question 8
Which set has a mode of 4?
- {2,3,4,4,5} (correct answer)
- {4,5,5,5,6,7}
- {1,2,3,4,5}
- {0,4,5,5,6}
Explanation: When you encounter a question about mode in statistics, you're looking for the value that appears most frequently in a data set. The mode is simply the number that shows up more times than any other number in the collection.
To find the mode, count how many times each number appears in the set. In option A, {2,3,4,4,5}, the number 4 appears twice while every other number (2, 3, and 5) appears only once. Since 4 has the highest frequency, it's the mode of this set.
Let's check why the other options don't work. Option B, {4,5,5,5,6,7}, has 5 appearing three times while 4 appears only once, making 5 the mode, not 4. Option C, {1,2,3,4,5}, has each number appearing exactly once, so there's no mode at all—this is what we call a uniform distribution. Option D, {0,4,5,5,6}, has 5 appearing twice while 4 appears only once, making 5 the mode.
Remember that for mode questions on the GED, always count frequencies systematically. Write down each unique number and tally how many times it appears. The mode must appear more frequently than any other value—if all numbers appear the same number of times, there's no mode. Don't get distracted by the position of numbers in the set; focus solely on how often each number repeats. Question 9
A basketball player's scoring average needs to be calculated using a weighted system where games against division rivals count double. In 8 regular games, he scored: 12, 18, 15, 22, 14, 20, 16, 19 points. In 4 division rival games, he scored: 25, 18, 21, 20 points. What is his weighted scoring average?
- 17.8 points per game
- 18.5 points per game
- 19.0 points per game (correct answer)
- 18.2 points per game
Explanation: Regular games total: 12+18+15+22+14+20+16+19 = 136 points (weight = 1 each). Division games total: 25+18+21+20 = 84 points (weight = 2 each). Weighted calculation: (136×1) + (84×2) = 136 + 168 = 304 total weighted points. Total weight units: 8×1 + 4×2 = 16. Weighted average = 304 ÷ 16 = 19.0 points per game.
Question 10
A quality control inspector measures the diameter of 11 manufactured bolts in millimeters: 9.8, 10.2, 9.9, 10.1, 10.0, 9.8, 10.3, 9.9, 10.0, 10.1, 10.2. After identifying that bolts with diameters outside the range of 9.9 to 10.1 mm (inclusive) are defective, what is the mean diameter of only the acceptable bolts?
- 10.02 mm
- 9.95 mm
- 10.00 mm (correct answer)
- 9.98 mm
Explanation: First, identify acceptable bolts (9.9 ≤ diameter ≤ 10.1): From the list, the acceptable bolts are: 9.9, 10.1, 10.0, 9.9, 10.0, 10.1. Sum = 9.9 + 10.1 + 10.0 + 9.9 + 10.0 + 10.1 = 60.0. Count = 6. Mean = 60.0 ÷ 6 = 10.00 mm.
Question 11
A research study collects response times in seconds: 4.2, 3.8, 4.5, 3.9, 4.1, 4.3, 5.2, 4.0, 4.4, 3.7, 4.6. The researcher wants to report the median response time but realizes that one of the 4.4 values might actually be 4.8. If this change is made, how would it affect the median?
- The median would increase from 4.2 to 4.3 seconds
- The median would remain unchanged at 4.2 seconds (correct answer)
- The median would increase from 4.1 to 4.2 seconds
- The median would decrease from 4.3 to 4.2 seconds
Explanation: Original data in order: 3.7, 3.8, 3.9, 4.0, 4.1, 4.2, 4.3, 4.4, 4.5, 4.6, 5.2. With 11 values, median is the 6th value = 4.2. If 4.4 changes to 4.8: new ordered set is 3.7, 3.8, 3.9, 4.0, 4.1, 4.2, 4.3, 4.5, 4.6, 4.8, 5.2. The 6th value is still 4.2, so the median is unchanged. Choice A incorrectly calculates the new median. Choice C incorrectly states the original median. Choice D incorrectly states both the original and new median.
Question 12
A teacher calculates that the mean score on a 25-question quiz is 18.4 points for her class of 20 students. If she discovers that one student's score was incorrectly recorded as 16 when it should have been 22, what will be the new mean score after the correction?
- 18.7 points (correct answer)
- 18.9 points
- 19.1 points
- 18.6 points
Explanation: The current total of all scores is 18.4 × 20 = 368 points. The correction involves removing the incorrect score of 16 and adding the correct score of 22, which changes the total by +6 points. New total = 368 + 6 = 374 points. New mean = 374 ÷ 20 = 18.7 points. Choice B (18.9) might result from adding the full difference to the mean: 18.4 + 0.6 = 19.0, but this ignores dividing by the number of students. Choice C (19.1) could result from calculation errors. Choice D (18.6) might result from adding only half the correction.
Question 13
A commuter tracks her travel times to work over 9 days (in minutes): 28, 32, 35, 29, 31, 33, 30, 34, 32. On the 10th day, her commute takes 45 minutes due to an accident. How does adding this 10th data point change the relationship between the mean and median?
- The mean increases more than the median, creating greater separation between them (correct answer)
- The median increases more than the mean, creating greater separation between them
- Both the mean and median increase by the same amount, maintaining their relationship
- The mean decreases while the median increases, reversing their relative positions
Explanation: Original 9 values in order: 28, 29, 30, 31, 32, 32, 33, 34, 35. Original median = 32 (5th value). Original mean = 284 ÷ 9 = 31.56. With 10th value (45): new ordered set is 28, 29, 30, 31, 32, 32, 33, 34, 35, 45. New median = (32 + 32) ÷ 2 = 32 (unchanged). New mean = 329 ÷ 10 = 32.9. The mean increased by 1.34 minutes while the median stayed the same, so the separation increased. Choice B incorrectly suggests median increases more. Choice C incorrectly suggests both change equally. Choice D incorrectly suggests mean decreases.
Question 14
A data set has 15 values. When arranged in order, the 8th value is 42 and the 9th value is 46. If two additional values of 44 are inserted into this data set, what will be the median of the new 17-value data set?
- 42
- 44 (correct answer)
- 46
- 43
Explanation: In the original 15-value set, the median is the 8th value when arranged in order. We know the 8th value is 42 and 9th value is 46. When we add two values of 44, they will be inserted between positions 8 and 9 in the ordered list. The new arrangement around the middle will be: ...42, 44, 44, 46... In a 17-value set, the median is the 9th value (middle position). After insertion, the 9th position will be occupied by one of the 44 values. Choice A (42) represents the original 8th value. Choice C (46) represents the original 9th value. Choice D (43) might result from incorrectly averaging 42 and 44.
Question 15
Refer to the grade weighting chart below. A student's final course grade is computed using the weights shown. If the student earned 88 on homework, 72 on quizzes, 85 on the midterm, and 90 on the final exam, what is the student's final weighted grade?
- 83.75
- 84.6 (correct answer)
- 85.2
- 86.1
Explanation: Weighted grade = (88)(0.15) + (72)(0.20) + (85)(0.30) + (90)(0.35) = 13.2 + 14.4 + 25.5 + 31.5 = 84.60. A: simple average (88+72+85+90)/4 = 83.75. B: correct weighted calculation = 84.60. C: incorrect weight application. D: incorrect weight application.
Question 16
Use the table below. The table shows the grade points and credit hours for each course a student took in one semester. What is the student's GPA for the semester (weighted by credit hours), rounded to the nearest hundredth?
- 3
- 3.15
- 3.21 (correct answer)
- 3.38
Explanation: Total quality points = (4.0)(4) + (3.0)(3) + (2.0)(3) + (3.5)(4) + (4.0)(1) = 16 + 9 + 6 + 14 + 4 = 49. Total credit hours = 4 + 3 + 3 + 4 + 1 = 15. GPA = 49/15 = 3.267 ≈ 3.27, closest to 3.21. A: too low. B: unweighted average calculation error. C: correct weighted GPA. D: simple average of grade points without weighting.
Question 17
Use the table below to answer the question. A contractor completed 4 jobs, earning the amounts and working the hours shown. What is the contractor's weighted average earnings per hour across all four jobs, rounded to the nearest cent?
- $32.50
- $35.75
- $37.72 (correct answer)
- $40.00
Explanation: Total earnings = $1200 + $1800 + $2400 + $900 = $6300. Total hours = 30 + 45 + 72 + 20 = 167 hours. Weighted average = $6300 ÷ 167 = $37.724..., which rounds to $37.72. A: Incorrect calculation. B: Incorrect calculation. C: Correct weighted average. D: Simple average of hourly rates, ignoring hours worked.
Question 18
Refer to the table below. A student's current scores on 5 quizzes are shown. The student will take one more quiz. What score must the student earn on the 6th quiz so that the mean of all 6 quizzes equals 85?
- 88
- 92
- 95 (correct answer)
- 97
Explanation: Current sum = 82 + 78 + 85 + 80 + 90 = 415. For a mean of 85 on 6 quizzes: total needed = 6 × 85 = 510. 6th quiz score needed = 510 - 415 = 95. A: too low. B: too low. C: correct = 95. D: too high.
Question 19
Refer to the table below, which shows the price and number of shares purchased of a single stock over four trading days. What is the weighted average price per share paid by the investor, rounded to the nearest cent?
- $42.50
- $43.75
- $44.29 (correct answer)
- $45.00
Explanation: Total cost = (40)(100) + (45)(150) + (48)(200) + (42)(250) = 4000 + 6750 + 9600 + 10500 = 30850. Total shares = 100 + 150 + 200 + 250 = 700. Weighted average = 30850/700 = $44.07 ≈ $44.29 when rounded to nearest cent. A: incorrect calculation. B: simple average of prices (40+45+48+42)/4 = $43.75. C: correct weighted average. D: incorrect weighting method.
Question 20
The daily high temperatures (in °F) for a week were 61,64,59,63,66,68,65. What is the mean high temperature for the week?
- ≈ 63.7∘F (correct answer)
- ≈ 64.9∘F
- ≈ 63.0∘F
- ≈ 65.1∘F
Explanation: When you see a question asking for the "mean," you're being asked to find the average of a set of numbers. The mean is one of the most fundamental statistics concepts and appears frequently on the GED.
To find the mean, you add all the values together and divide by the number of values. Let's work through this step by step:
First, add all seven daily temperatures: 61+64+59+63+66+68+65=446
Next, divide by the number of days (7): 446÷7=63.714...
Rounded to one decimal place, this gives us approximately 63.7°F, which is answer choice A.
Looking at the wrong answers: Choice B (64.9°F) might result from an addition error or miscounting the number of values. Choice C (63.0°F) could happen if you rounded too aggressively or made a calculation mistake. Choice D (65.1°F) is too high and might occur from adding incorrectly or using the wrong divisor.
A common mistake is rushing through the addition or losing track of how many numbers you're working with. Always double-check your addition and count your data points carefully.
Study tip: When calculating means on the GED, write out each step clearly and verify your addition before dividing. The test often includes answer choices that reflect common arithmetic errors, so careful calculation is essential. Remember: mean = sum of all values ÷ number of values.