Elementary School Math Quiz: Create And Analyze Fractional Line Plots
14 questions · exam conditions
0:00
Create And Analyze Fractional Line PlotsQuestion 1 of 14

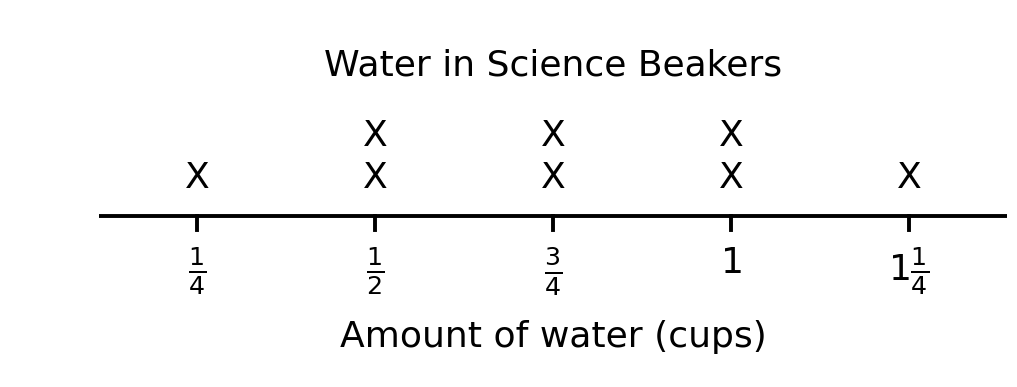
The line plot shows the amount of water in each of the 8 beakers on a lab table.

If the water were poured out and redistributed so that every beaker held the same amount, how many cups would be in each beaker?
Question graphic
34\frac{3}{4}
11
1141\frac{1}{4}
66
← Back to quizzes

Elementary School Math Quiz

Elementary School Math Quiz: Create And Analyze Fractional Line Plots

Practice Create And Analyze Fractional Line Plots in Elementary School Math with focused quiz questions that help you check what you know, review explanations, and build confidence with test-style prompts.

What this quiz covers

This quiz focuses on Create And Analyze Fractional Line Plots, giving you a quick way to practice the rules, question types, and explanations that matter most for Elementary School Math.

How to use this quiz

Try each quiz question before looking at the correct answer. Use the explanations to review missed ideas, then come back to similar questions until the pattern feels familiar.

All questions

Question 1

The line plot shows the amount of water in each of the 8 beakers on a lab table.

If the water were poured out and redistributed so that every beaker held the same amount, how many cups would be in each beaker?

  1. 34\frac{3}{4} (correct answer)
  2. 11
  3. 1141\frac{1}{4}
  4. 66
Explanation: First find the total: (1×14)+(2×12)+(2×34)+(2×1)+(1×114)=6(1 \times \frac{1}{4}) + (2 \times \frac{1}{2}) + (2 \times \frac{3}{4}) + (2 \times 1) + (1 \times 1\frac{1}{4}) = 6 cups. Then divide by the 8 beakers: 6÷8=346 \div 8 = \frac{3}{4} cup each. Choice B divides by 6 instead of 8. Choice C is the greatest amount shown, not the equal share. Choice D is the total before dividing.

Question 2

The line plot shows how far each member of a walking group went on Saturday.

How many members walked at least 1 mile?

  1. 33
  2. 44 (correct answer)
  3. 4344\frac{3}{4}
  4. 66
Explanation: "At least 1 mile" includes 1 mile itself, so count the X's above 1, 1141\frac{1}{4}, and 1121\frac{1}{2}: 2+1+1=42 + 1 + 1 = 4 members. Choice A leaves out the members who walked exactly 1 mile. Choice C adds those members' distances instead of counting them. Choice D counts the members who walked less than 1 mile.

Question 3

The line plot shows the amount of flour a bakery used in each of 6 batches of muffins.

If the bakery had used the same amount of flour in every batch, how many cups would each batch have used?

  1. 1121\frac{1}{2} (correct answer)
  2. 22
  3. 2122\frac{1}{2}
  4. 99
Explanation: First find the total flour used: (1×12)+(2×1)+(2×2)+(1×212)=12+2+4+212=9(1 \times \frac{1}{2}) + (2 \times 1) + (2 \times 2) + (1 \times 2\frac{1}{2}) = \frac{1}{2} + 2 + 4 + 2\frac{1}{2} = 9 cups. Then divide by the 6 batches: 9÷6=1129 \div 6 = 1\frac{1}{2} cups per batch. Choice B is the most common amount, not the equal share. Choice C is the greatest amount shown. Choice D is the total before dividing.

Question 4

A teacher recorded student jump distances on the line plot shown. What is the difference between the longest jump and the most common jump distance?

  1. 78\frac{7}{8} foot difference, with 2142\frac{1}{4} feet being most common
  2. 34\frac{3}{4} foot difference, with 2182\frac{1}{8} feet being most common
  3. 58\frac{5}{8} foot difference, with 2182\frac{1}{8} feet being most common (correct answer)
  4. 34\frac{3}{4} foot difference, with 2142\frac{1}{4} feet being most common
Explanation: From the line plot, the most frequent (mode) jump distance is 2182\frac{1}{8} feet with 4 occurrences. The longest jump is 2342\frac{3}{4} feet. The difference is 234218=268218=582\frac{3}{4} - 2\frac{1}{8} = 2\frac{6}{8} - 2\frac{1}{8} = \frac{5}{8} foot. Choice A identifies wrong mode. Choice B has wrong difference calculation. Choice D identifies wrong mode and has wrong difference.

Question 5

Students measured the thickness of books and created the line plot shown. If you arranged the books from thinnest to thickest, what would be the thickness of the book in the middle position (median)?

  1. 1181\frac{1}{8} inches, which is the 6th book out of 11 total books (correct answer)
  2. 1141\frac{1}{4} inches, which is the 6th book out of 11 total books
  3. 1181\frac{1}{8} inches, which is the 5th book out of 9 total books
  4. 1381\frac{3}{8} inches, which is the 6th book out of 11 total books
Explanation: From the line plot: 1 book at 34\frac{3}{4} inch, 2 books at 78\frac{7}{8} inch, 3 books at 1181\frac{1}{8} inches, 2 books at 1141\frac{1}{4} inches, 2 books at 1121\frac{1}{2} inches, 1 book at 1581\frac{5}{8} inches. Total books: 1+2+3+2+2+1=11. For 11 books, the median is the 6th book when arranged in order. Counting from thinnest: positions 1 is 34\frac{3}{4}, positions 2-3 are 78\frac{7}{8}, positions 4-6 are 1181\frac{1}{8}. So the 6th book has thickness 1181\frac{1}{8} inches. Choice B has wrong median value. Choice C has wrong book count. Choice D has wrong median value.

Question 6

The line plot shows the lengths of earthworms found in a garden. What is the range of the earthworm lengths, and how many earthworms were measured in total?

  1. Range of 78\frac{7}{8} inch with exactly 13 earthworms measured total (correct answer)
  2. Range of 11 inch with exactly 14 earthworms measured total
  3. Range of 34\frac{3}{4} inch with exactly 13 earthworms measured total
  4. Range of 78\frac{7}{8} inch with exactly 14 earthworms measured total
Explanation: From the line plot: 1 earthworm at 38\frac{3}{8} inch, 3 earthworms at 12\frac{1}{2} inch, 2 earthworms at 58\frac{5}{8} inch, 4 earthworms at 34\frac{3}{4} inch, 2 earthworms at 11 inch, 1 earthworm at 1141\frac{1}{4} inches. Total earthworms: 1+3+2+4+2+1=13. Range = maximum - minimum = 11438=5438=10838=781\frac{1}{4} - \frac{3}{8} = \frac{5}{4} - \frac{3}{8} = \frac{10}{8} - \frac{3}{8} = \frac{7}{8} inch. Choice B has wrong range and wrong count. Choice C has wrong range. Choice D has wrong count.

Question 7

The line plot shows the snowfall recorded on each of the 10 days it snowed in Jonesville last winter.

What was the total snowfall, in inches, on the days when less than 38\frac{3}{8} inch fell?

  1. 38\frac{3}{8}
  2. 34\frac{3}{4} (correct answer)
  3. 1781\frac{7}{8}
  4. 44
Explanation: Less than 38\frac{3}{8} inch means the days at 18\frac{1}{8} inch and 14\frac{1}{4} inch: (2×18)+(2×14)=28+48=68=34(2 \times \frac{1}{8}) + (2 \times \frac{1}{4}) = \frac{2}{8} + \frac{4}{8} = \frac{6}{8} = \frac{3}{4} inch. Choice A adds 18\frac{1}{8} and 14\frac{1}{4} only once each. Choice C also includes the three days at 38\frac{3}{8} inch, which are not less than 38\frac{3}{8}. Choice D is the number of those days, not the snowfall.

Question 8

The line plot shows the weight of each kitten at an animal shelter.

What is the combined weight, in pounds, of the two heaviest kittens?

  1. 5125\frac{1}{2}
  2. 5345\frac{3}{4} (correct answer)
  3. 66
  4. 8128\frac{1}{2}
Explanation: The two heaviest kittens weigh 3 pounds and 2342\frac{3}{4} pounds: 3+234=5343 + 2\frac{3}{4} = 5\frac{3}{4} pounds. Choice A adds two 2342\frac{3}{4}-pound kittens (234+234=5122\frac{3}{4} + 2\frac{3}{4} = 5\frac{1}{2}), overlooking that the 3-pound kitten is the heaviest and belongs in the pair. Choice C adds 3 twice, but only one kitten weighs 3 pounds. Choice D combines the three heaviest kittens instead of the two heaviest: 3+234+234=8123 + 2\frac{3}{4} + 2\frac{3}{4} = 8\frac{1}{2}.

Question 9

The line plot shows the weight of trail mix in each bag a hiking club packed.

What is the total weight, in pounds, of all the trail mix the club packed?

  1. 1141\frac{1}{4}
  2. 2182\frac{1}{8}
  3. 2142\frac{1}{4} (correct answer)
  4. 88
Explanation: Multiply each weight by its number of X's and add: (3×18)+(2×14)+(1×38)+(2×12)=38+48+38+88=188=214(3 \times \frac{1}{8}) + (2 \times \frac{1}{4}) + (1 \times \frac{3}{8}) + (2 \times \frac{1}{2}) = \frac{3}{8} + \frac{4}{8} + \frac{3}{8} + \frac{8}{8} = \frac{18}{8} = 2\frac{1}{4} pounds. Choice A adds each labeled weight only once. Choice B misses one bag at 18\frac{1}{8} pound. Choice D is the number of bags.

Question 10

A student measured the lengths of 10 pencils (in inches) to the nearest 14\tfrac{1}{4} inch. The data can be represented and analyzed using line plots.

Line plot (inches):

Number line (inches): 55 5145\tfrac{1}{4} 5125\tfrac{1}{2} 5345\tfrac{3}{4} 66

Marks:

  • 55: XX
  • 5145\tfrac{1}{4}: XXX
  • 5125\tfrac{1}{2}: XX
  • 5345\tfrac{3}{4}: X
  • 66: XX

Which claim about the measurements is incorrect?

  1. Exactly 2 pencils are 55 inches long.
  2. Exactly 2 pencils are 66 inches long.
  3. Exactly 5 pencils are longer than 5125\tfrac{1}{2} inches. (correct answer)
  4. Exactly 3 pencils are 5145\tfrac{1}{4} inches long.
Explanation: Line plots show measurement data by placing marks above a number line to represent the frequency of pencil lengths. Fractions are represented on the number line as quarters, such as 5 1/4 or 5 3/4, for lengths to the nearest quarter inch. To read the plot, count the X marks at each point; for lengths longer than 5 1/2, the total is three (one at 5 3/4 and two at 6). This pencil data connects to identifying incorrect claims, such as stating exactly five pencils longer than 5 1/2 when the plot shows only three. A common misconception is including the boundary value in 'longer than' counts, but 'longer than' excludes equals. Line plots help analyze data by allowing precise subgroup tallies and error detection. They support verifying statements through visual and numerical checks.

Question 11

The line plot shows the lengths of the jump ropes in a gym storage bin.

What is the difference, in feet, between the longest jump rope and the shortest jump rope?

  1. 1121\frac{1}{2}
  2. 22
  3. 2122\frac{1}{2} (correct answer)
  4. 121212\frac{1}{2}
Explanation: The longest rope is 7127\frac{1}{2} feet and the shortest is 5 feet: 7125=2127\frac{1}{2} - 5 = 2\frac{1}{2} feet. Choice A subtracts the most common length, 6 feet, from the longest instead of from the shortest: 7126=1127\frac{1}{2} - 6 = 1\frac{1}{2}. Choice B uses 7 as the longest length instead of 7127\frac{1}{2}: 75=27 - 5 = 2. Choice D adds the two lengths instead of subtracting: 712+5=12127\frac{1}{2} + 5 = 12\frac{1}{2}.

Question 12

The line plot shows the weights of the rock samples a science class collected.

How much heavier, in pounds, is the heaviest sample than the lightest sample?

  1. 38\frac{3}{8}
  2. 12\frac{1}{2}
  3. 58\frac{5}{8} (correct answer)
  4. 78\frac{7}{8}
Explanation: The heaviest sample is 34\frac{3}{4} pound and the lightest is 18\frac{1}{8} pound. Rewrite 34\frac{3}{4} as 68\frac{6}{8}, then subtract: 6818=58\frac{6}{8} - \frac{1}{8} = \frac{5}{8} pound. Choice A subtracts from 12\frac{1}{2}, the most common weight, rather than from the heaviest. Choice B comes from subtracting the numerators and denominators separately. Choice D adds the two weights instead of subtracting.

Question 13

The line plot shows the lengths of the green bean pods Malik picked from his garden.

What is the combined length, in inches, of all the pods Malik picked?

  1. 77
  2. 9349\frac{3}{4}
  3. 121212\frac{1}{2}
  4. 163416\frac{3}{4} (correct answer)
Explanation: Multiply each length by the number of X's above it, then add: (2×2)+(1×214)+(3×212)+(1×3)=4+214+712+3=1634(2 \times 2) + (1 \times 2\frac{1}{4}) + (3 \times 2\frac{1}{2}) + (1 \times 3) = 4 + 2\frac{1}{4} + 7\frac{1}{2} + 3 = 16\frac{3}{4} inches. Choice A is the number of pods, not their length. Choice B adds each labeled length only once instead of once per X. Choice C adds all five labels, including 2342\frac{3}{4}, which has no pods.

Question 14

The line plot shows the number of hours each student in a book club read last week.

What is the total number of hours read by the students who read more than 2 hours?

  1. 33
  2. 55
  3. 5125\frac{1}{2}
  4. 88 (correct answer)
Explanation: Two students read 2122\frac{1}{2} hours and one student read 3 hours: (2×212)+3=5+3=8(2 \times 2\frac{1}{2}) + 3 = 5 + 3 = 8 hours. Choice A is the number of those students, not their hours. Choice B leaves out the student who read 3 hours. Choice C adds 2122\frac{1}{2} and 3 only once each instead of once per X.