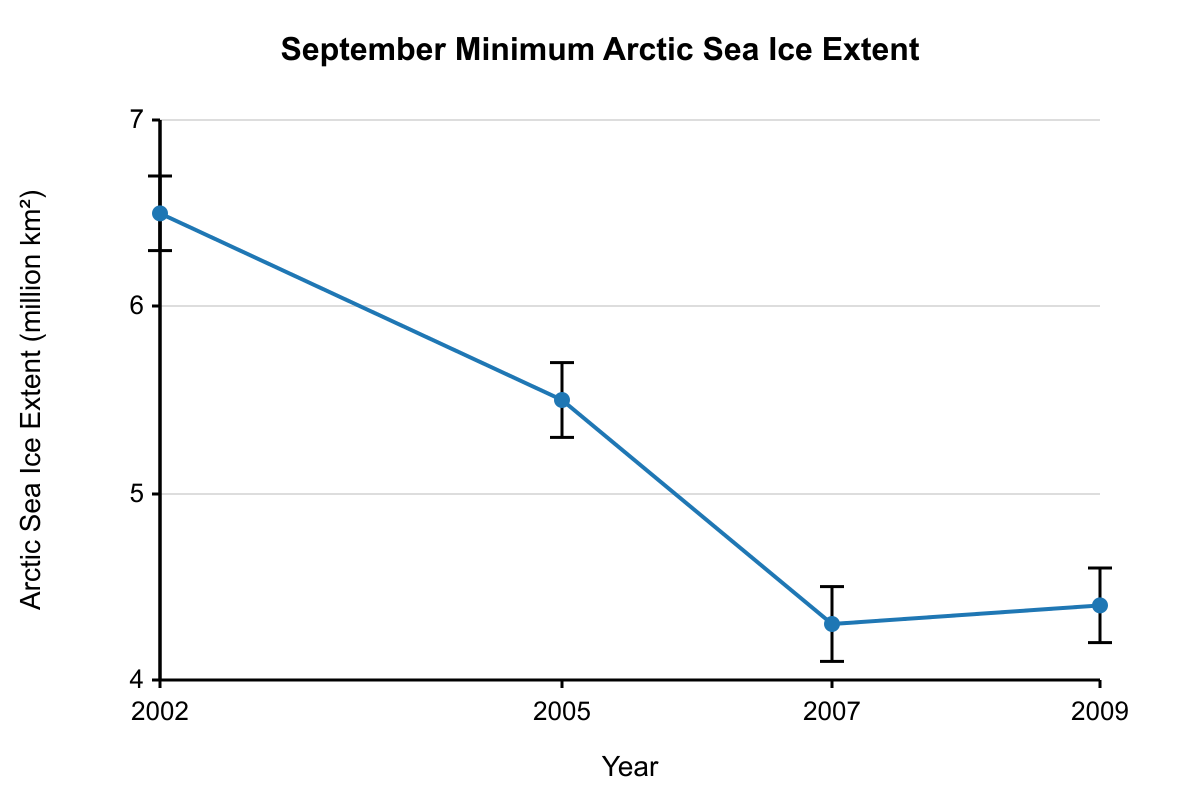
The graph shows the September minimum Arctic sea ice extent for several years, with error bars representing the measurement uncertainty. Based on these data and their associated uncertainties, which of the following comparisons describes a change that is NOT statistically significant?
AThe decrease in sea ice extent from 2002 to 2007.
BThe decrease in sea ice extent from 2005 to 2007.
CThe increase in sea ice extent from 2007 to 2009.
DThe decrease in sea ice extent from 2002 to 2009.
Practice Scientific Uncertainty in Earth Science with focused quiz questions that help you check what you know, review explanations, and build confidence with test-style prompts.
What this quiz covers
This quiz focuses on Scientific Uncertainty, giving you a quick way to practice the rules, question types, and explanations that matter most for Earth Science.
How to use this quiz
Try each quiz question before looking at the correct answer. Use the explanations to review missed ideas, then come back to similar questions until the pattern feels familiar.
All questions
Question 1
The graph shows the September minimum Arctic sea ice extent for several years, with error bars representing the measurement uncertainty. Based on these data and their associated uncertainties, which of the following comparisons describes a change that is NOT statistically significant?
The decrease in sea ice extent from 2002 to 2007.
The decrease in sea ice extent from 2005 to 2007.
The increase in sea ice extent from 2007 to 2009. (correct answer)
The decrease in sea ice extent from 2002 to 2009.
Explanation: Statistical significance can be visually assessed by examining the error bars. If the error bars for two data points overlap, it is possible that the difference between their measured values is due to random measurement error rather than a real change. The error bar for 2007 (4.1 to 4.5 million km²) and the error bar for 2009 (4.2 to 4.6 million km²) overlap. Therefore, the apparent increase from 4.3 to 4.4 is not statistically significant. The error bars for all other pairs of years listed do not overlap, indicating statistically significant changes.
Question 2
The map shows an ensemble forecast for a hurricane's track. The shaded "cone of uncertainty" represents the likely area the center of the storm will pass through. A coastal city is located on the edge of the cone at the 72-hour forecast mark. Which is the most accurate interpretation of this situation?
The city has a very low probability of experiencing the storm's center, as it is on the fringe of the cone.
The city will definitely experience strong winds and rain, but the storm's eye is unlikely to make a direct hit.
There is a significant, non-zero probability that the storm's center will pass directly over the city. (correct answer)
The forecast is highly uncertain, indicating the model has failed and a new model run is needed for a reliable prediction.
Explanation: The cone of uncertainty is a probabilistic forecast, typically constructed to contain the actual track of the storm's center about two-thirds of the time, based on historical forecast errors. It does not represent the area of impact. Any location within the cone, including the edge, has a significant probability of a direct hit. The probability is not necessarily highest at the center line; the actual track is roughly equally likely to be anywhere inside the cone.
Question 3
The graph plots the measured values from a new sensor against the known true values for a series of standards. Based on the data pattern shown, which conclusion about the sensor's measurement error is most justified?
The sensor has large random errors but no significant systematic error.
The sensor has a significant systematic error that causes it to consistently read higher than the true value. (correct answer)
The sensor has both large random errors and a significant systematic error.
The sensor is functioning perfectly, and the deviations from the 'Perfect Agreement' line are within the expected range of uncertainty.
Explanation: In this type of graph, the 'Perfect Agreement' line (Y=X) represents a flawless measurement. Systematic error is indicated by a consistent deviation of the data points from this line. Here, the data points form a tight cluster (indicating low random error) that is clearly offset above the Y=X line, meaning the sensor consistently measures a value higher than the true value. This consistent, directional offset is the definition of a systematic error.
Question 4
The classic textbook diagram of the water cycle depicts evaporation, condensation, precipitation, and runoff in a simple loop. From the perspective of a hydrologist modeling a real-world watershed, what is a primary conceptual limitation of this simplified model?
It fails to represent the chemical composition of the water, such as its salinity or isotopic ratios.
It omits key storage components and fluxes, such as groundwater, soil moisture, and evapotranspiration. (correct answer)
It incorrectly assumes that the total amount of water on Earth is constant over geological time.
It does not operate according to the laws of thermodynamics, particularly the conservation of energy.
Explanation: Conceptual models are valuable for their simplicity, but that simplicity is also their limitation. For quantitative hydrologic modeling, the simple water cycle diagram is inadequate because it omits major reservoirs (groundwater, soil moisture) and fluxes (evapotranspiration, infiltration) that are critical for determining the timing and volume of water moving through a watershed. The residence time of water in these omitted components is a key control on streamflow and water availability.
Question 5
A paleoclimatologist analyzes a single ice core from central Greenland to reconstruct past atmospheric CO2 concentrations. While the analytical measurement of CO2 in the trapped air bubbles is highly precise, the study acknowledges significant uncertainty when generalizing the findings to represent global atmospheric conditions. What is the most likely source of this larger-scale uncertainty?
Systematic errors in the mass spectrometer used to analyze the gas composition.
Random errors due to temperature fluctuations in the laboratory during analysis.
Sampling error, as a single location may not capture the spatial variability of atmospheric gases. (correct answer)
Model uncertainty in the age-depth model used to date the ice layers.
Explanation: Sampling error occurs when a sample is not representative of the entire population being studied. A single ice core, while providing a valuable local record, may not perfectly represent the average state of the entire global atmosphere at a given time due to spatial variations. Extrapolating from a single point to a global average introduces uncertainty related to how representative that single sample is.
Question 6
The Intergovernmental Panel on Climate Change (IPCC) states that the global mean sea level rise from 1901 to 2018 was 0.20 [0.15 to 0.25] meters. What is the primary scientific reason for presenting the result as a range in brackets?
To suggest that the true value is most likely 0.20 m, but that 0.15 m or 0.25 m are alternative theories.
To account for disagreements and lack of consensus among the scientists who contributed to the report.
To quantify the uncertainty that arises from combining multiple data sources with varying measurement errors and incomplete spatial coverage. (correct answer)
To provide a simplified range for policymakers, while the exact, certain value is reserved for scientific publications.
Explanation: The range provided, known as a confidence interval, is a formal statistical statement of uncertainty. It is not a reflection of disagreement but rather the result of a rigorous synthesis of all available evidence. The range accounts for uncertainties from various sources, including instrumental errors in tide gauges and satellites, incomplete data coverage over the ocean, and different methods for analyzing the data. It represents the range within which the true value is very likely to lie.
Question 7
A research paper uses output from a Global Climate Model (GCM) with a grid cell resolution of 100 km by 100 km. A city planner wants to use the model's precipitation output for a specific small river watershed (25 km²) within one of the model's grid cells to design a new storm drainage system. Why is this a conceptually flawed application of the model data?
The GCM's fundamental physics are only valid for oceanic areas, not for terrestrial watersheds.
The GCM's coarse resolution averages precipitation over the entire grid cell, missing localized, intense rainfall events. (correct answer)
The uncertainty in future greenhouse gas emissions is too high to make any localized prediction useful.
Any single GCM run is subject to random internal variability, and an ensemble of runs must be used.
Explanation: This is a problem of spatial scale. A GCM calculates a single, average value of precipitation for its entire 10,000 km² grid cell. It cannot resolve smaller, sub-grid scale phenomena like individual thunderstorms, which produce the localized, high-intensity rainfall crucial for designing storm drainage systems in a small watershed. Using the GCM's averaged output is a conceptual flaw because it is not representative of the processes that matter at the required local scale.
Question 8
A hydrologist uses a flow meter to measure the velocity of a stream at the same location ten times under stable conditions. The meter was improperly calibrated and consistently reads 0.05 m/s higher than the true velocity. How would this calibration issue affect the precision and accuracy of the measurements?
It would decrease accuracy but not affect precision. (correct answer)
It would decrease precision but not affect accuracy.
It would decrease both precision and accuracy.
It would not affect either precision or accuracy because the error is constant.
Explanation: Accuracy is the closeness of a measurement to the true value, while precision is the closeness of repeated measurements to each other. A consistent error that shifts all measurements in the same direction (a systematic error) reduces accuracy because the measurements are all offset from the true value. However, because the measurements would still be tightly clustered together (just around the wrong value), their precision is unaffected.
Question 9
The Intergovernmental Panel on Climate Change (IPCC) states that the global mean sea level rise from 1901 to 2018 was 0.20 [0.15 to 0.25] meters. What is the primary scientific reason for presenting the result as a range in brackets?
To suggest that the true value is most likely 0.20 m, but that 0.15 m or 0.25 m are alternative theories.
To account for disagreements and lack of consensus among the scientists who contributed to the report.
To quantify the uncertainty that arises from combining multiple data sources with varying measurement errors and incomplete spatial coverage. (correct answer)
To provide a simplified range for policymakers, while the exact, certain value is reserved for scientific publications.
Explanation: The range provided, known as a confidence interval, is a formal statistical statement of uncertainty. It is not a reflection of disagreement but rather the result of a rigorous synthesis of all available evidence. The range accounts for uncertainties from various sources, including instrumental errors in tide gauges and satellites, incomplete data coverage over the ocean, and different methods for analyzing the data. It represents the range within which the true value is very likely to lie.
Question 10
Weather prediction models are known to lose their accuracy significantly beyond 7-10 days. This is primarily because small, unmeasurable variations in the initial atmospheric conditions (temperature, pressure, humidity) can grow into large, unpredictable differences in the forecast. This phenomenon is a key example of which type of model limitation?
Uncertainty due to flawed physical equations in the model.
Uncertainty from errors in the model's boundary conditions, such as sea surface temperature.
Sensitivity to initial conditions, a characteristic of chaotic systems. (correct answer)
Limitation due to insufficient computational power to resolve small-scale weather phenomena.
Explanation: The atmosphere is a chaotic system, which means it exhibits sensitive dependence on initial conditions (often called the 'butterfly effect'). Even infinitesimally small errors or uncertainties in the input data that describes the current state of the atmosphere will be amplified exponentially over time. This inherent property of the system, not flaws in the model's equations or computer power, is the fundamental reason for the limited predictability of weather on long time scales.
Question 11
A global climate model (GCM) uses a parameterization scheme to represent cloud formation, as the processes occur at scales smaller than the model's grid cells. Which statement best explains the primary source of conceptual uncertainty introduced by this parameterization?
The scheme is an empirical approximation of complex physics, which may not hold true under all climate conditions. (correct answer)
The computational cost of running the parameterization scheme introduces rounding errors that accumulate over time.
The initial atmospheric conditions used to start the model run have small errors that are amplified by the cloud scheme.
The observational data used to develop the parameterization scheme contained significant random measurement errors.
Explanation: Parameterization involves replacing complex physical processes that cannot be explicitly resolved with simplified, often empirical, relationships. The primary conceptual uncertainty is that this simplification is an approximation of reality. This approximation, which may be based on the current climate, might not accurately represent how clouds will behave in a future, different climate, leading to uncertainty in the model's projections.
Question 12
A geomorphologist calculates the discharge of a river by multiplying the cross-sectional area (A) by the average flow velocity (v). The measurement of A has an estimated uncertainty of ±3%, and the measurement of v has an estimated uncertainty of ±4%. Assuming the errors are independent and random, which of the following best approximates the uncertainty in the calculated discharge (Q)?
±3.5%
±5.0% (correct answer)
±7.0%
±12.0%
Explanation: When independent quantities with random errors are multiplied, their relative (percentage) uncertainties add in quadrature. The resulting relative uncertainty is the square root of the sum of the squares of the individual relative uncertainties. In this case, the uncertainty is (3%)2+(4%)2=9%2+16%2=25%2=5.0%.
Question 13
Seismologists developing an earthquake forecast model for a specific fault line face two primary sources of uncertainty: (1) the precise timing of the next rupture due to the chaotic nature of rock fracture mechanics, and (2) the exact value of the fault's long-term slip rate, which is inferred from limited geological data. How are these two sources of uncertainty best classified?
(1) is systematic error, and (2) is random error.
(1) is aleatory uncertainty, and (2) is epistemic uncertainty. (correct answer)
(1) is epistemic uncertainty, and (2) is aleatory uncertainty.
Both are forms of model structural uncertainty.
Explanation: Aleatory uncertainty arises from inherent randomness or unpredictability in a system. The exact timing of an earthquake is considered inherently random, hence it is aleatory. Epistemic uncertainty arises from a lack of knowledge about a quantity that is in principle knowable. The long-term slip rate is a fixed physical property of the fault; our uncertainty about it is due to incomplete data and could be reduced with more measurements. Therefore, it is epistemic.
Question 14
Two independent research groups develop climate models to project future sea-level rise. Model A uses a semi-empirical approach relating global temperature to sea level, while Model B uses a process-based model that simulates the dynamics of ice sheets and thermal expansion. The models produce different projections even when forced with the same emissions scenario. This divergence primarily highlights which type of uncertainty?
Initial condition uncertainty
Parameter uncertainty
Aleatory uncertainty
Structural uncertainty (correct answer)
Explanation: Structural uncertainty arises from the fact that there are different plausible ways to mathematically represent the components and interactions of a complex system. Because the two models are built on different fundamental assumptions and equations (semi-empirical vs. process-based), their divergence reflects uncertainty about which model structure is a better representation of the real climate system.
Question 15
A research team is trying to estimate the total volume of a magma chamber beneath a volcano. Their estimate has a large uncertainty, which they believe stems primarily from a poorly constrained value for the seismic wave velocity in the overlying crustal rock. Which of the following actions would most directly address this specific limitation and reduce the uncertainty in their volume estimate?
Running the volume model on a more powerful supercomputer to reduce rounding errors.
Conducting a new active-source seismic survey to better measure crustal wave velocities. (correct answer)
Developing a new model for magma chamber volume that does not rely on seismic data.
Averaging their result with results from older studies that used the same velocity assumption.
Explanation: The problem describes epistemic uncertainty—a lack of knowledge about a key parameter (seismic velocity). The most direct way to reduce this type of uncertainty is to collect new, targeted data to better constrain that parameter. An active-source seismic survey is designed specifically to measure seismic wave velocities in the crust, thereby directly addressing the identified source of uncertainty.
Question 16
A geology student is measuring the strike of a sedimentary bed using a Brunton compass. To read the compass needle accurately, the student must look at the dial from directly above. If the student consistently views the needle from a slight angle to the side, what type of measurement error is being introduced?
A systematic error due to parallax. (correct answer)
A random error due to parallax.
An instrumental error due to magnetic declination.
A sampling error because the measurement was only taken at one location.
Explanation: Parallax is an apparent shift in the position of an object when viewed from different lines of sight. When reading an analog instrument like a compass, viewing the needle from an angle rather than directly overhead will cause it to appear aligned with a different mark on the dial. Because the student's viewing habit is described as consistent, the resulting error will be in a consistent direction and magnitude, making it a systematic error.
Question 17
A geoscientist develops a computer model to predict landslide susceptibility. They use a dataset of 100 past landslides to adjust the model's internal parameters until the model successfully 'predicts' 95 of these 100 events. They then claim a 95% accuracy rate for their model. Why is this claim of accuracy potentially misleading?
The model's accuracy is likely lower because it ignores other important factors like vegetation cover.
The dataset of 100 landslides is too small to achieve any statistically significant results for a predictive model.
A 95% accuracy rate is computationally impossible for such a complex system, indicating a calculation error.
The model was tested on the same data used to calibrate it, so its performance on new, independent data is unknown. (correct answer)
Explanation: When evaluating predictive models in earth science, you must distinguish between model training and model validation. This question tests a fundamental principle in data science: the difference between fitting a model to data versus testing its predictive power.The geoscientist's claim is misleading because they tested the model on the exact same 100 landslides used to calibrate its parameters. This is like giving students a practice test, letting them adjust their study methods until they ace that specific test, then claiming they'll score 95% on any geology exam. The model learned the specific patterns in those 100 cases but hasn't proven it can recognize landslide conditions in new, unseen locations.Option A suggests the model ignores vegetation factors, but the question doesn't specify which variables were included—this isn't the core problem. Option B claims 100 landslides is too small for statistical significance, but sample size adequacy depends on the complexity of the analysis, and 100 events can provide meaningful results. Option C states 95% accuracy is computationally impossible for complex systems, but this is incorrect—models can achieve high accuracy on training data, which is actually part of the problem here.The correct answer is D because true model validation requires testing on independent data that wasn't used during calibration. Without this separation, you can't distinguish between a model that genuinely understands landslide processes versus one that simply memorized the training examples.Study tip: In earth science modeling questions, always look for the distinction between training data (used to build the model) and validation data (used to test it).
Question 18
In radiometric dating, the calculated age of a rock is often reported with an uncertainty, such as 2.50 Ga ± 0.02 Ga. When using the same analytical technique, why does a 1% uncertainty in the measured isotope ratios of an ancient rock (e.g., 2.5 Ga) result in a much larger absolute age uncertainty (in millions of years) than a 1% uncertainty for a geologically young rock (e.g., 50 Ma)?
The radioactive decay constant (λ) is less well-known for the isotopes used to date very old rocks.
The mathematical equation for calculating age becomes less stable for older samples, amplifying any measurement errors.
Older rocks are more likely to have lost daughter isotopes, which systematically increases the uncertainty.
The absolute uncertainty is a percentage of the total age, so a larger age naturally results in a larger absolute uncertainty range. (correct answer)
Explanation: When you encounter radiometric dating questions involving uncertainties, focus on the mathematical relationship between relative and absolute error. The key insight is understanding how percentage uncertainties translate into absolute values across different scales.The correct answer is D because absolute uncertainty is calculated as a percentage of the total measured value. When you have a 1% uncertainty in isotope ratios, this translates to roughly 1% uncertainty in the calculated age. For a 2.5 Ga rock, 1% equals ±25 million years, while for a 50 Ma rock, 1% equals only ±0.5 million years. The percentage stays constant, but the absolute range scales proportionally with age.Option A is incorrect because decay constants (λ) are actually well-established physical constants determined through precise laboratory measurements, regardless of whether they're used for young or old samples. The uncertainty in λ values doesn't significantly differ between isotope systems used for different age ranges.Option B misrepresents the mathematics. The age equation t=λ1ln(1+PD) doesn't become mathematically "unstable" for older samples. The logarithmic relationship is well-behaved across the full range of geological time.Option C describes a real geological process (daughter isotope loss) that can affect accuracy, but this addresses systematic error in the measurement itself, not why the same relative measurement uncertainty produces larger absolute uncertainties in older rocks.Remember: when comparing uncertainties across different scales, always distinguish between relative (percentage) and absolute (actual number) uncertainty. The relative uncertainty often remains constant while absolute uncertainty scales with the measurement magnitude.
Question 19
A geomorphologist calculates the discharge of a river by multiplying the cross-sectional area (A) by the average flow velocity (v). The measurement of A has an estimated uncertainty of ±3%, and the measurement of v has an estimated uncertainty of ±4%. Assuming the errors are independent and random, which of the following best approximates the uncertainty in the calculated discharge (Q)?
±3.5%
±5.0% (correct answer)
±7.0%
±12.0%
Explanation: When independent quantities with random errors are multiplied, their relative (percentage) uncertainties add in quadrature. The resulting relative uncertainty is the square root of the sum of the squares of the individual relative uncertainties. In this case, the uncertainty is (3%)2+(4%)2=9%2+16%2=25%2=5.0%.
Question 20
Seismologists developing an earthquake forecast model for a specific fault line face two primary sources of uncertainty: (1) the precise timing of the next rupture due to the chaotic nature of rock fracture mechanics, and (2) the exact value of the fault's long-term slip rate, which is inferred from limited geological data. How are these two sources of uncertainty best classified?
(1) is systematic error, and (2) is random error.
(1) is aleatory uncertainty, and (2) is epistemic uncertainty. (correct answer)
(1) is epistemic uncertainty, and (2) is aleatory uncertainty.
Both are forms of model structural uncertainty.
Explanation: Aleatory uncertainty arises from inherent randomness or unpredictability in a system. The exact timing of an earthquake is considered inherently random, hence it is aleatory. Epistemic uncertainty arises from a lack of knowledge about a quantity that is in principle knowable. The long-term slip rate is a fixed physical property of the fault; our uncertainty about it is due to incomplete data and could be reduced with more measurements. Therefore, it is epistemic.