College Biology Quiz: Reading Scientific Figures
14 questions · exam conditions
0:00
Reading Scientific FiguresQuestion 1 of 14

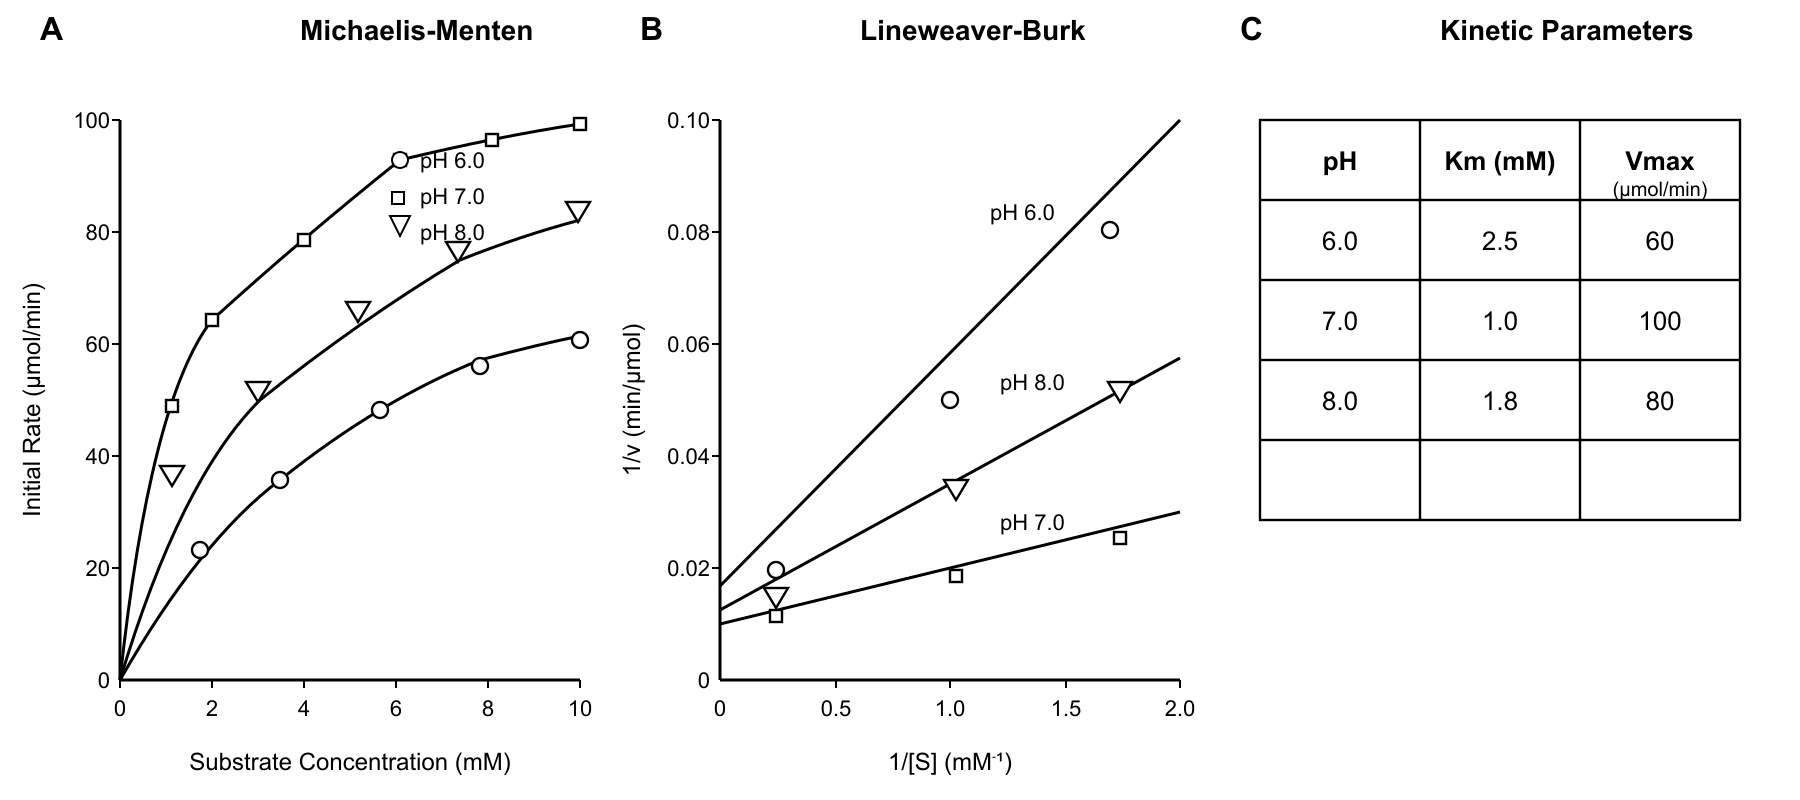
Researchers investigated the effect of pH on enzyme kinetics using the experimental design shown. Panel A displays initial reaction rates at different substrate concentrations for three pH conditions. Panel B shows the corresponding Lineweaver-Burk plots (1/v vs 1/[S]) for the same data. Panel C presents a summary table of calculated kinetic parameters (Km and Vmax). What mechanism best explains the pH effects on this enzyme?
Question graphic
pH affects only substrate binding affinity, as shown by changes in Km values while Vmax remains constant across pH conditions
pH influences both enzyme-substrate binding and catalytic efficiency, evidenced by coordinated changes in both Km and Vmax parameters
The enzyme shows optimal activity at pH 7.0 due to maintenance of proper protein conformation and active site ionization states
pH changes cause competitive inhibition patterns, as demonstrated by the parallel lines in the Lineweaver-Burk plots
The experimental data is inconsistent between panels, suggesting technical errors in either the kinetic measurements or parameter calculations
← Back to quizzes

College Biology Quiz

College Biology Quiz: Reading Scientific Figures

Practice Reading Scientific Figures in College Biology with focused quiz questions that help you check what you know, review explanations, and build confidence with test-style prompts.

What this quiz covers

This quiz focuses on Reading Scientific Figures, giving you a quick way to practice the rules, question types, and explanations that matter most for College Biology.

How to use this quiz

Try each quiz question before looking at the correct answer. Use the explanations to review missed ideas, then come back to similar questions until the pattern feels familiar.

All questions

Question 1

Researchers investigated the effect of pH on enzyme kinetics using the experimental design shown. Panel A displays initial reaction rates at different substrate concentrations for three pH conditions. Panel B shows the corresponding Lineweaver-Burk plots (1/v vs 1/[S]) for the same data. Panel C presents a summary table of calculated kinetic parameters (Km and Vmax). What mechanism best explains the pH effects on this enzyme?

  1. pH affects only substrate binding affinity, as shown by changes in Km values while Vmax remains constant across pH conditions
  2. pH influences both enzyme-substrate binding and catalytic efficiency, evidenced by coordinated changes in both Km and Vmax parameters (correct answer)
  3. The enzyme shows optimal activity at pH 7.0 due to maintenance of proper protein conformation and active site ionization states
  4. pH changes cause competitive inhibition patterns, as demonstrated by the parallel lines in the Lineweaver-Burk plots
  5. The experimental data is inconsistent between panels, suggesting technical errors in either the kinetic measurements or parameter calculations
Explanation: The correct answer is B. This question tests interpretation of enzyme kinetics data across multiple representations. When both Km and Vmax change with pH, it indicates that pH affects both substrate binding (Km) and catalytic turnover (Vmax), which is typical for enzymes with ionizable groups in the active site. A is incorrect if Vmax also changes. C is incomplete without considering the kinetic parameters. D is wrong because competitive inhibition would show intersecting lines at the y-axis. E assumes inconsistency without justification.

Question 2

An environmental biology study examined ecosystem responses to pollution using the multi-panel analysis below. Panel A shows species diversity indices over a 5-year period at three study sites (upstream, pollution source, downstream). Panel B displays biomass measurements for different trophic levels. Panel C presents water quality parameters including pH, dissolved oxygen, and nutrient levels. Based on this comprehensive dataset, what ecological principle is best illustrated?

  1. Pollution effects are limited to the immediate source area, with no detectable impacts on upstream or downstream ecosystems
  2. Species diversity shows inverse correlation with pollution levels, but biomass remains stable across all trophic levels throughout the study period
  3. Downstream sites exhibit reduced species diversity and altered trophic structure, demonstrating the cascading effects of pollution on ecosystem function (correct answer)
  4. Water quality parameters remain within normal ranges at all sites, indicating that biological effects occur independently of chemical changes
  5. The ecosystem shows complete recovery by year 5, suggesting that pollution impacts are temporary and reversible within short time frames
Explanation: The correct answer is C. This question tests interpretation of ecosystem-level data and understanding of pollution impacts. Downstream sites would show decreasing diversity and altered biomass distribution among trophic levels, demonstrating how pollution effects cascade through the ecosystem. A is incorrect because pollution typically affects downstream areas. B is unlikely because biomass typically changes with diversity. D contradicts expected relationships between chemistry and biology. E assumes complete recovery without evidence.

Question 3

A research team investigated the relationship between enzyme activity and temperature using the experimental setup shown. The figure displays three panels: Panel A shows enzyme activity vs. temperature, Panel B shows protein denaturation (measured by circular dichroism) vs. temperature, and Panel C shows substrate binding affinity (Km values) vs. temperature. What is the most likely explanation for the observed pattern in Panel A?

  1. The initial increase in activity results from enhanced molecular motion, while the subsequent decrease reflects progressive protein denaturation as shown in Panel B (correct answer)
  2. The bell-shaped curve indicates competitive inhibition at higher temperatures due to increased substrate degradation rates
  3. Temperature affects only the binding affinity component of enzyme function, as demonstrated by the Km changes in Panel C
  4. The enzyme shows optimal activity at physiological temperature, suggesting it evolved specifically for human body temperature conditions
  5. The decrease in activity above 40°C results from reduced substrate availability rather than changes in enzyme structure or function
Explanation: The correct answer is A. This question tests the ability to integrate data across multiple related panels to understand enzyme kinetics. The typical bell-shaped curve for enzyme activity vs. temperature reflects two competing factors: increased molecular motion (enhancing reaction rates) at moderate temperatures, and protein denaturation at high temperatures (shown in Panel B). B is incorrect because competitive inhibition would show different kinetic patterns. C is wrong because temperature affects both catalytic rate and binding. D makes an unsupported evolutionary assumption. E is incorrect because substrate availability wasn't manipulated in this experiment.

Question 4

A molecular biology laboratory performed a gel electrophoresis experiment to analyze DNA fragments. The figure shows the gel image (Panel A) and a corresponding quantification graph (Panel B) measuring band intensities. The experiment compared DNA samples from three different treatments, with molecular weight markers in the leftmost lane. Each treatment was replicated three times (lanes 2-4, 5-7, 8-10). What does this analysis reveal about the experimental treatments?

  1. Treatment 1 shows consistent results across replicates, while Treatments 2 and 3 demonstrate significant variability in DNA fragment sizes
  2. All three treatments produce identical DNA fragment patterns, suggesting the treatments had no differential effects on DNA processing
  3. Treatment 2 generates the largest DNA fragments, indicating it provides the most effective protection against DNA degradation
  4. The molecular weight markers are improperly loaded, making size comparisons between treatments invalid and requiring experimental repetition
  5. Treatment 3 produces the highest DNA yield based on band intensity quantification, but shows intermediate fragment sizes compared to other treatments (correct answer)
Explanation: The correct answer is E. This tests interpretation of gel electrophoresis data including both qualitative (band positions) and quantitative (band intensities) information. Treatment 3 would show the brightest bands (highest yield) but fragments migrating to intermediate positions between Treatments 1 and 2. A is incorrect without evidence of size variability. B is wrong if treatments show different patterns. C misinterprets the relationship between migration distance and fragment size. D assumes marker problems without evidence.

Question 5

A plant physiology experiment investigated photosynthetic responses to light intensity. The figure shows three measurement approaches: Panel A displays oxygen evolution rates, Panel B shows chlorophyll fluorescence parameters, and Panel C presents leaf temperature changes. All measurements were taken simultaneously on the same leaves at different light intensities. Error bars represent standard error (n=6). What integrated conclusion about photosynthetic performance is best supported?

  1. Light saturation occurs at 800 μmol photons m⁻² s⁻¹ across all measurement parameters, indicating coordinated photosynthetic responses (correct answer)
  2. Oxygen evolution and fluorescence data show contradictory patterns, suggesting measurement technique errors in the experimental setup
  3. Leaf temperature increases indicate that absorbed light energy converts to heat rather than supporting chemical energy production
  4. The plant maintains constant fluorescence parameters while increasing oxygen production, demonstrating photosynthetic efficiency optimization
  5. Chlorophyll fluorescence limits maximum photosynthetic capacity rather than oxygen evolution machinery setting the constraint
Explanation: The correct answer is A. This question tests integration of multiple photosynthetic measurements. Light saturation typically occurs when all three parameters plateau at the same light intensity, indicating that the photosynthetic apparatus has reached maximum capacity. B is incorrect if the data are complementary rather than contradictory. C misinterprets temperature changes which occur even during active photosynthesis. D is unlikely because fluorescence parameters typically change with light intensity. E misidentifies the limiting factor.

Question 6

An ecology research team monitored population dynamics in a predator-prey system over five years. The figure shows population counts for lynx and snowshoe hares. Panel A displays raw population data, while Panel B shows the same data plotted as lynx population vs. hare population (phase plot). Based on these complementary representations, what ecological principle is best illustrated?

  1. The phase plot in Panel B demonstrates that predator and prey populations oscillate with identical frequencies and amplitudes
  2. Panel A shows classic predator-prey cycling with lynx population peaks occurring approximately one year after hare population peaks
  3. The circular pattern in Panel B indicates a stable equilibrium where both populations remain constant over time
  4. Both panels suggest that hare population changes are independent of lynx population size, supporting competition rather than predation as the primary limiting factor
Explanation: B

Question 7

A genetics laboratory performed a linkage analysis experiment examining inheritance patterns of three genes (A, B, C) located on the same chromosome. The figure shows recombination frequency data (Panel A), a genetic map with distances in centiMorgans (Panel B), and pedigree analysis results (Panel C). The study analyzed 1000 offspring from test crosses. Based on this comprehensive genetic analysis, what gene arrangement is most strongly supported?

  1. Genes are arranged linearly as A-B-C with equal spacing of 10 cM between adjacent genes, as shown by uniform recombination frequencies
  2. Gene B is located between A and C, with recombination frequencies reflecting additive map distances for non-adjacent gene pairs
  3. All three genes assort independently despite being on the same chromosome, indicating they are separated by distances greater than 50 cM
  4. The recombination data is inconsistent with the genetic map, suggesting errors in either the crossing experiments or distance calculations
Explanation: B

Question 8

A cell biology lab investigated membrane transport using fluorescent dye uptake assays. The graph shows dye accumulation over time in cells under four different conditions: normal medium (Control), medium with metabolic inhibitor (+ Inhibitor), medium at 4°C (Cold), and medium with transport protein blocker (+ Blocker). The dye normally enters cells via a specific transport protein. What conclusion is best supported by this data?

  1. The transport process is entirely passive diffusion, as evidenced by continued dye uptake in all experimental conditions
  2. The metabolic inhibitor completely blocks transport, indicating the process requires cellular energy (active transport)
  3. Cold temperature eliminates dye uptake, proving that the transport protein is temperature-sensitive but energy-independent
  4. The transport blocker reduces but does not eliminate uptake, suggesting multiple transport pathways exist for this dye
Explanation: D

Question 9

Examine the figure showing results from a chromosome analysis experiment. Panel A displays a karyotype from a patient with developmental abnormalities. Panel B shows the same chromosomes arranged in a standard karyogram format. Panel C presents FISH (fluorescence in situ hybridization) analysis using probes specific for chromosome 21. Based on this multi-panel analysis, what is the most likely chromosomal abnormality?

  1. Monosomy 21, as evidenced by the presence of only one chromosome 21 in the FISH analysis
  2. Trisomy 21, indicated by three fluorescent signals in Panel C and an extra chromosome in the chromosome 21 position in Panel B
  3. Robertsonian translocation involving chromosome 21, shown by abnormal chromosome morphology in Panel A
  4. Normal chromosome complement with no detectable abnormalities in any of the three analytical approaches
Explanation: B

Question 10

The following figure presents results from a Western blot analysis examining protein expression in response to drug treatment. Panel A shows the blot image with bands for target protein (50 kDa) and loading control β-actin (42 kDa). Panel B shows quantified band intensities normalized to β-actin. Lanes represent: 1) Control, 2) Drug A 10 μM, 3) Drug A 50 μM, 4) Drug B 10 μM, 5) Drug B 50 μM. What is the most appropriate interpretation of these results?

  1. Drug A shows dose-dependent protein upregulation while Drug B exhibits dose-independent effects, suggesting different molecular mechanisms of action
  2. Both drugs demonstrate equivalent efficacy at 50 μM concentration, indicating they likely target the same cellular pathway
  3. The β-actin loading control shows uneven protein loading, making quantitative comparisons between lanes invalid
  4. Drug B at 10 μM concentration produces maximal protein induction, with no additional benefit from higher concentrations
Explanation: A

Question 11

A conservation biology study monitored population genetics in a fragmented habitat using the analysis approach below. Panel A shows genetic diversity measurements (heterozygosity) across different population fragments over 10 years. Panel B displays migration rates between fragments based on genetic markers. Panel C presents population size estimates for each fragment. The study tracked 5 isolated forest fragments following habitat fragmentation. What population genetic principle is demonstrated by this longitudinal analysis?

  1. Small population fragments maintain genetic diversity through enhanced migration rates that prevent genetic drift effects
  2. Genetic diversity declines more rapidly in smaller fragments, demonstrating the interaction between population size and genetic drift
  3. Migration rates increase over time as populations adapt to fragmented conditions, leading to genetic homogenization
  4. All fragments show identical genetic change patterns, indicating that fragment size has no influence on genetics
Explanation: B

Question 12

The figure shows results from a cell viability assay testing the effects of two compounds (A and B) on cancer cell growth. The graph displays percent cell survival after 48-hour treatment with varying concentrations. Each point represents the mean of triplicate measurements, and error bars show standard deviation. Based on this data, which conclusion is best supported?

  1. Compound A is more effective than Compound B because it achieves 50% cell death at a lower concentration than Compound B (correct answer)
  2. Compound B shows greater maximum efficacy than Compound A, as evidenced by the lowest survival percentage achieved at high concentrations
  3. Both compounds exhibit identical mechanisms of action since they both reduce cell viability in a dose-dependent manner
  4. The experimental design is inadequate because no positive control for complete cell death was included in the study
  5. Compound A demonstrates superior therapeutic potential due to its steeper dose-response curve compared to Compound B
Explanation: The correct answer is A. This tests interpretation of dose-response curves and IC50 concepts. The compound that achieves 50% cell survival (or death) at a lower concentration is considered more potent. B is incorrect because maximum efficacy refers to the lowest point achieved, but potency (concentration required for effect) is more clinically relevant. C is wrong because similar dose-response patterns don't indicate identical mechanisms. D is incorrect because a positive control for complete cell death isn't necessary when testing compound efficacy. E is wrong because curve steepness (slope) indicates cooperativity, not necessarily therapeutic superiority.

Question 13

Researchers conducted a time-course experiment to study bacterial growth under different nutrient conditions. The figure shows optical density (OD600) measurements over 24 hours for bacteria grown in rich medium (LB), minimal medium (MM), and minimal medium supplemented with amino acids (MM+AA). Each curve represents the mean of six independent cultures. Based on the growth patterns shown, what can be concluded about bacterial metabolism under these conditions?

  1. Bacteria in MM+AA conditions demonstrate the longest lag phase, indicating that amino acid supplementation initially inhibits growth
  2. The MM condition shows the highest maximum growth rate during exponential phase, suggesting minimal medium optimally supports rapid cell division
  3. LB and MM+AA conditions reach similar final cell densities, but LB supports faster exponential growth, indicating that rich medium provides additional growth-limiting factors beyond amino acids (correct answer)
  4. All three conditions show identical exponential growth rates, differing only in the timing of stationary phase onset
  5. The MM condition fails to reach stationary phase within 24 hours, indicating that essential nutrients are completely absent from minimal medium
Explanation: The correct answer is C. This tests interpretation of bacterial growth curves and understanding of growth-limiting factors. LB (rich medium) would show rapid exponential growth and high final density. MM+AA would reach similar final density but with slower exponential growth, while MM alone would show the slowest growth and lowest final density. This indicates LB contains additional growth-promoting factors beyond amino acids. A is incorrect because amino acids typically reduce lag phase. B is wrong because rich medium supports faster growth than minimal medium. D is incorrect because growth rates differ between conditions. E is wrong because minimal medium supports growth, just more slowly.

Question 14

Examine the multi-panel figure. Panel A shows gene expression levels (measured by qRT-PCR) for three genes (X, Y, Z) under normal and stress conditions. Panel B shows protein levels for the same genes measured by Western blot analysis. Error bars represent standard error of the mean (n=5). What is the most accurate interpretation of these combined results?

  1. Gene Y shows coordinated transcriptional and translational upregulation under stress conditions, indicating direct regulatory coupling between mRNA and protein levels
  2. Gene X demonstrates post-transcriptional regulation under stress, as mRNA levels increase significantly while protein levels remain unchanged (correct answer)
  3. Gene Z exhibits translational enhancement under stress conditions, with stable mRNA levels but increased protein production efficiency
  4. All three genes show identical regulatory patterns when both transcriptional and translational data are considered together
  5. The experimental design is flawed because qRT-PCR and Western blot data cannot be meaningfully compared in the same study
Explanation: The correct answer is B. This question tests the ability to interpret multi-panel experimental data and understand the relationship between gene expression and protein production. Gene X would show increased mRNA (Panel A) but unchanged protein levels (Panel B), indicating post-transcriptional regulation such as microRNA inhibition or translational repression. A is incorrect because it describes a simple positive correlation without considering regulatory complexity. C describes a scenario that would be unlikely given typical experimental conditions. D is wrong because genes typically show different regulatory responses. E is incorrect because these are standard complementary techniques in molecular biology.