All questions
Question 1
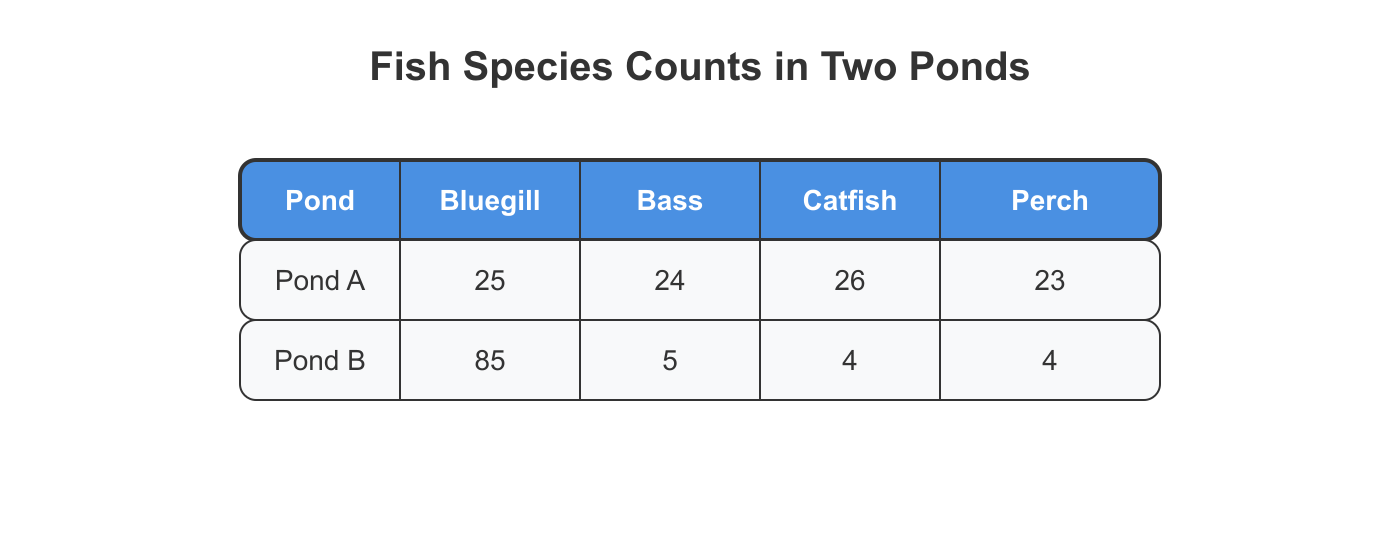
Two ponds were sampled for fish. Counts are shown below.
Pond A: Bluegill (25), Bass (24), Catfish (26), Perch (23)
Pond B: Bluegill (85), Bass (5), Catfish (4), Perch (4)
Which statement best compares the ponds' biodiversity?
- Pond B has higher biodiversity because it has more bluegill
- Pond A has higher biodiversity because it has higher evenness with the same richness (correct answer)
- Pond B has higher biodiversity because it has lower richness
- Both ponds have different richness, so evenness cannot be compared
Explanation: This question tests your ability to analyze biodiversity data by reading species richness (number of different species) and species evenness (how balanced their abundances are) to compare ecosystems or track biodiversity changes. Biodiversity has two main components visible in data: (1) SPECIES RICHNESS is simply the count of how many different species are present—count the rows in a table, count the bars in a graph, or count the species listed (example: if data shows oak, maple, pine, birch, hickory, that's 5 species, so richness = 5). Higher richness = more species = higher biodiversity. (2) SPECIES EVENNESS describes how balanced the populations are—if all species have similar abundances (like 100, 95, 105, 98 individuals each), that's HIGH evenness (balanced), but if one species dominates (like 500, 10, 5, 3 individuals), that's LOW evenness (unbalanced) even though richness is the same (4 species both cases). Analyzing the pond data: Both ponds have 4 species (same richness). Pond A has very balanced abundances (25, 24, 26, 23—all similar), showing HIGH evenness. Pond B has one dominant species (Bluegill 85) with the other three having much lower numbers (5, 4, 4), showing LOW evenness. Since both have the same richness, the pond with higher evenness has higher overall biodiversity. Choice B correctly analyzes that Pond A has higher biodiversity because it has higher evenness with the same richness—the balanced distribution of species in Pond A (no single species dominating) creates a more diverse ecosystem than Pond B where bluegill overwhelmingly dominates. Choice A incorrectly suggests more individuals of one species increases biodiversity, but actually the opposite is true—when one species dominates (like bluegill in Pond B), it reduces evenness and thus overall biodiversity. Analyzing biodiversity from data—the two-check method: (1) COUNT species (richness): In a table, count how many different species are listed (rows usually). In a graph, count how many bars or data points. In a list, count distinct species names. This gives species richness. Example: table with Species A, B, C, D, E = 5 species, richness = 5. (2) CHECK evenness (balance): Look at abundances (population sizes, percentages, bar heights). Are they SIMILAR (high evenness: like 100, 95, 110, 98) or VERY DIFFERENT (low evenness: like 500, 10, 8, 5)? If one species has 80%+ of total, that's low evenness (dominated). When comparing ecosystems with the same richness, the one with higher evenness (more balanced species abundances) has higher biodiversity—think of it like a balanced diet being healthier than eating mostly one food!
Question 2
A forest manager tracked plant species richness in the same 1-hectare plot over time.
Year 2005: 30 plant species
Year 2015: 22 plant species
Year 2025: 14 plant species
Which conclusion is best supported by the data?
- Plant biodiversity (richness) increased over time.
- Plant biodiversity (richness) stayed constant over time.
- Plant biodiversity (richness) decreased over time. (correct answer)
- The total number of individual plants must have increased over time.
Explanation: This question tests your ability to analyze biodiversity data by reading species richness (number of different species) and species evenness (how balanced their abundances are) to compare ecosystems or track biodiversity changes. Biodiversity has two main components visible in data: (1) SPECIES RICHNESS is simply the count of how many different species are present—count the rows in a table, count the bars in a graph, or count the species listed (example: if data shows oak, maple, pine, birch, hickory, that's 5 species, so richness = 5). Higher richness = more species = higher biodiversity. (2) SPECIES EVENNESS describes how balanced the populations are—if all species have similar abundances (like 100, 95, 105, 98 individuals each), that's HIGH evenness (balanced), but if one species dominates (like 500, 10, 5, 3 individuals), that's LOW evenness (unbalanced) even though richness is the same (4 species both cases). HIGH BIODIVERSITY ecosystems have BOTH high richness (many species) AND high evenness (relatively balanced), while LOW BIODIVERSITY has few species or is dominated by one or two species! Comparing: ecosystem with 25 species and balanced abundances is more diverse than ecosystem with 8 species or ecosystem with 25 species but 90% is one species. The data clearly shows richness declining from 30 species in 2005 to 22 in 2015 and 14 in 2025, indicating a decrease over time, with no evenness or total individual data provided. Choice C correctly analyzes biodiversity data by accurately tracking the change in species richness values across years. Choice A fails by claiming an increase, but encouraging correction: double-check the numbers—30 to 14 is a decrease, so richness dropped, possibly due to habitat changes. Analyzing biodiversity from data—the two-check method: (1) COUNT species (richness): In a table, count how many different species are listed (rows usually). In a graph, count how many bars or data points. In a list, count distinct species names. This gives species richness. Example: table with Species A, B, C, D, E = 5 species, richness = 5. (2) CHECK evenness (balance): Look at abundances (population sizes, percentages, bar heights). Are they SIMILAR (high evenness: like 100, 95, 110, 98) or VERY DIFFERENT (low evenness: like 500, 10, 8, 5)? If one species has 80%+ of total, that's low evenness (dominated). If each species has ~similar %, high evenness (balanced). (3) COMBINE for overall diversity: High richness + high evenness = HIGH biodiversity (many species, balanced—example: rainforest with 100+ species, none dominating). Excellent observation of trends—keep monitoring changes like a pro!
Question 3
Two desert sites each have 4 lizard species. The counts are shown below.
Site X: Species 1 (25), Species 2 (24), Species 3 (26), Species 4 (25)
Site Y: Species 1 (90), Species 2 (4), Species 3 (3), Species 4 (3)
Which statement is most accurate?
- Site Y has higher biodiversity because it has more individuals overall
- Site X has higher biodiversity because it has the same richness but greater evenness (correct answer)
- Site Y has higher biodiversity because dominance increases evenness
- Both sites have different richness, so they cannot be compared
Explanation: This question tests your ability to analyze biodiversity data by reading species richness (number of different species) and species evenness (how balanced their abundances are) to compare ecosystems or track biodiversity changes. Biodiversity has two main components visible in data: (1) SPECIES RICHNESS is simply the count of how many different species are present—count the rows in a table, count the bars in a graph, or count the species listed (example: if data shows oak, maple, pine, birch, hickory, that's 5 species, so richness = 5). Higher richness = more species = higher biodiversity. (2) SPECIES EVENNESS describes how balanced the populations are—if all species have similar abundances (like 100, 95, 105, 98 individuals each), that's HIGH evenness (balanced), but if one species dominates (like 500, 10, 5, 3 individuals), that's LOW evenness (unbalanced) even though richness is the same (4 species both cases). Analyzing the desert lizard data: Both sites have 4 species (same richness). Site X shows very balanced counts (25, 24, 26, 25—all nearly equal), indicating HIGH evenness. Site Y shows extreme dominance by Species 1 (90 individuals) while the other three species have very low counts (4, 3, 3), indicating LOW evenness. With equal richness, the site with higher evenness has higher biodiversity. Choice B correctly states that Site X has higher biodiversity because it has the same richness but greater evenness—the balanced distribution of lizard species at Site X creates a more diverse ecosystem than Site Y where one species overwhelmingly dominates. Choice C incorrectly claims dominance increases evenness, when actually dominance by one species (like Species 1 at Site Y with 90% of individuals) DECREASES evenness and overall biodiversity. Analyzing biodiversity from data—the two-check method: (1) COUNT species (richness): In a table, count how many different species are listed (rows usually). In a graph, count how many bars or data points. In a list, count distinct species names. This gives species richness. Example: table with Species A, B, C, D, E = 5 species, richness = 5. (2) CHECK evenness (balance): Look at abundances (population sizes, percentages, bar heights). Are they SIMILAR (high evenness: like 100, 95, 110, 98) or VERY DIFFERENT (low evenness: like 500, 10, 8, 5)? Site Y is a perfect example of low evenness—even though 4 species are present, Species 1 makes up 90% of all lizards (90 out of 100 total), functionally making it almost a single-species system!
Question 4
A student surveys two grassland plots for plant species. Plot 1 contains: bluestem, clover, goldenrod, milkweed, thistle, and ryegrass. Plot 2 contains: bluestem, clover, and goldenrod.
What is the species richness of Plot 1?
- 3 species
- 6 species (correct answer)
- 9 species
- It cannot be determined without abundance data.
Explanation: This question tests your ability to analyze biodiversity data by reading species richness (number of different species) and species evenness (how balanced their abundances are) to compare ecosystems or track biodiversity changes. Biodiversity has two main components visible in data: (1) SPECIES RICHNESS is simply the count of how many different species are present—count the rows in a table, count the bars in a graph, or count the species listed (example: if data shows oak, maple, pine, birch, hickory, that's 5 species, so richness = 5). Higher richness = more species = higher biodiversity. (2) SPECIES EVENNESS describes how balanced the populations are—if all species have similar abundances (like 100, 95, 105, 98 individuals each), that's HIGH evenness (balanced), but if one species dominates (like 500, 10, 5, 3 individuals), that's LOW evenness (unbalanced) even though richness is the same (4 species both cases). HIGH BIODIVERSITY ecosystems have BOTH high richness (many species) AND high evenness (relatively balanced), while LOW BIODIVERSITY has few species or is dominated by one or two species. Comparing: ecosystem with 25 species and balanced abundances is more diverse than ecosystem with 8 species or ecosystem with 25 species but 90% is one species! For this survey, the list for Plot 1 includes six distinct plant species (bluestem, clover, goldenrod, milkweed, thistle, ryegrass), so we count them directly to determine richness without needing abundance data for this specific question. Choice B correctly analyzes biodiversity data by accurately counting the species richness of Plot 1 as 6 based on the listed names. Choice A might come from miscounting or confusing with Plot 2's 3 species, but supportively, list them out one by one—there are indeed six unique names, so double-check by writing them down to avoid errors. Analyzing biodiversity from data—the two-check method: (1) COUNT species (richness): In a table, count how many different species are listed (rows usually). In a graph, count how many bars or data points. In a list, count distinct species names. This gives species richness. Example: table with Species A, B, C, D, E = 5 species, richness = 5. (2) CHECK evenness (balance): Look at abundances (population sizes, percentages, bar heights). Are they SIMILAR (high evenness: like 100, 95, 110, 98) or VERY DIFFERENT (low evenness: like 500, 10, 8, 5)? If one species has 80%+ of total, that's low evenness (dominated). If each species has ~similar %, high evenness (balanced). (3) COMBINE for overall diversity: High richness + high evenness = HIGH biodiversity (many species, balanced—example: rainforest with 100+ species, none dominating). Low richness or low evenness = LOW biodiversity (few species—example: corn field with 3 species, or unbalanced—example: lawn with 10 plant species but 95% grass). Comparing ecosystems: which has higher biodiversity? First compare richness (more species usually wins unless very uneven). If richness similar, check evenness (more balanced wins). Example: Ecosystem A (richness 20, very even) vs Ecosystem B (richness 22, one species 70% of total) → A might be more diverse overall despite slightly lower richness because B's extreme dominance reduces functional diversity. Richness and evenness TOGETHER determine biodiversity quality! Why evenness matters: imagine two forests, both with 10 tree species (same richness). Forest 1: each species ~10% of trees (even). Forest 2: oak is 95% of trees, other 9 species combined only 5% (very uneven). Forest 1 is more biodiverse and ecologically healthy because multiple species contribute substantially to ecosystem function. Forest 2 is functionally almost a monoculture despite technically having 10 species. Evenness captures this ecological reality that richness alone misses!
Question 5
A class compares two habitats: a natural meadow and a corn field. The meadow survey found 18 plant species. The corn field survey found 4 plant species (including corn and three weed species).
Which statement is best supported by the data?
- The corn field has higher biodiversity because corn plants are very abundant.
- The meadow has higher species richness and therefore higher biodiversity. (correct answer)
- Both habitats have equal biodiversity because both contain plants.
- The corn field has higher biodiversity because it is managed by humans.
Explanation: This question tests your ability to analyze biodiversity data by reading species richness (number of different species) and species evenness (how balanced their abundances are) to compare ecosystems or track biodiversity changes. Biodiversity has two main components visible in data: (1) SPECIES RICHNESS is simply the count of how many different species are present—count the rows in a table, count the bars in a graph, or count the species listed (example: if data shows oak, maple, pine, birch, hickory, that's 5 species, so richness = 5). Higher richness = more species = higher biodiversity. (2) SPECIES EVENNESS describes how balanced the populations are—if all species have similar abundances (like 100, 95, 105, 98 individuals each), that's HIGH evenness (balanced), but if one species dominates (like 500, 10, 5, 3 individuals), that's LOW evenness (unbalanced) even though richness is the same (4 species both cases). HIGH BIODIVERSITY ecosystems have BOTH high richness (many species) AND high evenness (relatively balanced), while LOW BIODIVERSITY has few species or is dominated by one or two species. Comparing: ecosystem with 25 species and balanced abundances is more diverse than ecosystem with 8 species or ecosystem with 25 species but 90% is one species! The surveys report 18 plant species in the meadow and 4 in the corn field (corn plus three weeds), so compare richness directly, noting that higher richness typically means higher biodiversity, especially since no evenness data is given but meadows are naturally more diverse. Choice B correctly analyzes biodiversity data by accurately counting species richness and concluding the meadow has higher richness and thus higher biodiversity. Choice A mistakes abundance of one species for overall diversity, but supportively, biodiversity prioritizes number of species over total individuals— the corn field's dominance by one crop actually suggests lower evenness, reinforcing the meadow's advantage. Analyzing biodiversity from data—the two-check method: (1) COUNT species (richness): In a table, count how many different species are listed (rows usually). In a graph, count how many bars or data points. In a list, count distinct species names. This gives species richness. Example: table with Species A, B, C, D, E = 5 species, richness = 5. (2) CHECK evenness (balance): Look at abundances (population sizes, percentages, bar heights). Are they SIMILAR (high evenness: like 100, 95, 110, 98) or VERY DIFFERENT (low evenness: like 500, 10, 8, 5)? If one species has 80%+ of total, that's low evenness (dominated). If each species has ~similar %, high evenness (balanced). (3) COMBINE for overall diversity: High richness + high evenness = HIGH biodiversity (many species, balanced—example: rainforest with 100+ species, none dominating). Low richness or low evenness = LOW biodiversity (few species—example: corn field with 3 species, or unbalanced—example: lawn with 10 plant species but 95% grass). Comparing ecosystems: which has higher biodiversity? First compare richness (more species usually wins unless very uneven). If richness similar, check evenness (more balanced wins). Example: Ecosystem A (richness 20, very even) vs Ecosystem B (richness 22, one species 70% of total) → A might be more diverse overall despite slightly lower richness because B's extreme dominance reduces functional diversity. Richness and evenness TOGETHER determine biodiversity quality! Why evenness matters: imagine two forests, both with 10 tree species (same richness). Forest 1: each species ~10% of trees (even). Forest 2: oak is 95% of trees, other 9 species combined only 5% (very uneven). Forest 1 is more biodiverse and ecologically healthy because multiple species contribute substantially to ecosystem function. Forest 2 is functionally almost a monoculture despite technically having 10 species. Evenness captures this ecological reality that richness alone misses!
Question 6
Two grassland plots were surveyed for insect biodiversity. The counts below show the number of individuals of each species found.
Plot A: Beetle (25), Ant (24), Grasshopper (26), Butterfly (23)
Plot B: Beetle (80), Ant (10), Grasshopper (5), Butterfly (5)
Which statement best compares the biodiversity of Plot A and Plot B (considering both species richness and species evenness)?
- Plot B has higher biodiversity because it has more total individuals.
- Plot A has higher biodiversity because it has the same richness as Plot B but greater evenness. (correct answer)
- Plot B has higher biodiversity because it has greater evenness.
- Plot A has lower biodiversity because it has fewer species than Plot B.
Explanation: This question tests your ability to analyze biodiversity data by reading species richness (number of different species) and species evenness (how balanced their abundances are) to compare ecosystems or track biodiversity changes. Biodiversity has two main components visible in data: (1) SPECIES RICHNESS is simply the count of how many different species are present—count the rows in a table, count the bars in a graph, or count the species listed (example: if data shows oak, maple, pine, birch, hickory, that's 5 species, so richness = 5). Higher richness = more species = higher biodiversity. (2) SPECIES EVENNESS describes how balanced the populations are—if all species have similar abundances (like 100, 95, 105, 98 individuals each), that's HIGH evenness (balanced), but if one species dominates (like 500, 10, 5, 3 individuals), that's LOW evenness (unbalanced) even though richness is the same (4 species both cases). HIGH BIODIVERSITY ecosystems have BOTH high richness (many species) AND high evenness (relatively balanced), while LOW BIODIVERSITY has few species or is dominated by one or two species! Comparing: ecosystem with 25 species and balanced abundances is more diverse than ecosystem with 8 species or ecosystem with 25 species but 90% is one species. In this case, both plots have the same richness (4 species each), but Plot A shows high evenness with abundances around 23-26 individuals per species, while Plot B has low evenness with beetles dominating at 80 individuals and others at 5-10, so Plot A has higher overall biodiversity. Choice B correctly analyzes biodiversity data by accurately counting species richness as equal and assessing evenness from abundance patterns to conclude Plot A is more diverse. Choice A fails by focusing only on total individuals, but remember, biodiversity isn't about total population size—it's about the number and balance of species, so even with fewer total insects, Plot A is more diverse due to better evenness. Analyzing biodiversity from data—the two-check method: (1) COUNT species (richness): In a table, count how many different species are listed (rows usually). In a graph, count how many bars or data points. In a list, count distinct species names. This gives species richness. Example: table with Species A, B, C, D, E = 5 species, richness = 5. (2) CHECK evenness (balance): Look at abundances (population sizes, percentages, bar heights). Are they SIMILAR (high evenness: like 100, 95, 110, 98) or VERY DIFFERENT (low evenness: like 500, 10, 8, 5)? If one species has 80%+ of total, that's low evenness (dominated). If each species has ~similar %, high evenness (balanced). (3) COMBINE for overall diversity: High richness + high evenness = HIGH biodiversity (many species, balanced—example: rainforest with 100+ species, none dominating). Keep practicing this method, and you'll confidently compare any biodiversity datasets!
Question 7
A scientist compared two stream sections using the macroinvertebrate counts shown.
Section 1: Mayfly (15), Caddisfly (16), Stonefly (14), Snail (15), Worm (15), Beetle larva (15)
Section 2: Mayfly (70), Caddisfly (5), Stonefly (5), Snail (5), Worm (5), Beetle larva (5)
Which section has higher biodiversity overall (consider richness and evenness)?
- Section 2, because it has more individuals total.
- Section 1, because it has the same richness as Section 2 but much higher evenness. (correct answer)
- Section 2, because it has a higher number of species.
- Neither; biodiversity cannot be compared without calculating a Shannon index.
Explanation: This question tests your ability to analyze biodiversity data by reading species richness (number of different species) and species evenness (how balanced their abundances are) to compare ecosystems or track biodiversity changes. Biodiversity has two main components visible in data: (1) SPECIES RICHNESS is simply the count of how many different species are present—count the rows in a table, count the bars in a graph, or count the species listed (example: if data shows oak, maple, pine, birch, hickory, that's 5 species, so richness = 5). Higher richness = more species = higher biodiversity. (2) SPECIES EVENNESS describes how balanced the populations are—if all species have similar abundances (like 100, 95, 105, 98 individuals each), that's HIGH evenness (balanced), but if one species dominates (like 500, 10, 5, 3 individuals), that's LOW evenness (unbalanced) even though richness is the same (4 species both cases). HIGH BIODIVERSITY ecosystems have BOTH high richness (many species) AND high evenness (relatively balanced), while LOW BIODIVERSITY has few species or is dominated by one or two species! Comparing: ecosystem with 25 species and balanced abundances is more diverse than ecosystem with 8 species or ecosystem with 25 species but 90% is one species. Both sections have 6 macroinvertebrate types (same richness), but Section 1 has high evenness with 14-16 per type, while Section 2 has low evenness with mayflies at 70 dominating over 5 each, so Section 1 has higher overall biodiversity. Choice B correctly analyzes biodiversity data by counting richness equally and assessing evenness for a full comparison. Choice A fails by focusing on total individuals, but encouraging insight: higher totals don't mean higher diversity if unbalanced—Section 1's evenness boosts its biodiversity! Analyzing biodiversity from data—the two-check method: (1) COUNT species (richness): In a table, count how many different species are listed (rows usually). In a graph, count how many bars or data points. In a list, count distinct species names. This gives species richness. Example: table with Species A, B, C, D, E = 5 species, richness = 5. (2) CHECK evenness (balance): Look at abundances (population sizes, percentages, bar heights). Are they SIMILAR (high evenness: like 100, 95, 110, 98) or VERY DIFFERENT (low evenness: like 500, 10, 8, 5)? If one species has 80%+ of total, that's low evenness (dominated). If each species has ~similar %, high evenness (balanced). (3) COMBINE for overall diversity: High richness + high evenness = HIGH biodiversity (many species, balanced—example: rainforest with 100+ species, none dominating). Fantastic work on evenness—continue honing your analysis!
Question 8
Two coral reef patches were surveyed. Patch 1 had 10 fish species, and Patch 2 had 6 fish species. The most abundant species made up 20% of all fish in Patch 1 and 65% of all fish in Patch 2.
Which patch has higher biodiversity overall?
- Patch 2, because the most abundant species makes up a larger percent of the community.
- Patch 2, because it has fewer species so competition is lower.
- Patch 1, because it has higher richness and higher evenness. (correct answer)
- Both patches, because evenness does not affect biodiversity.
Explanation: This question tests your ability to analyze biodiversity data by reading species richness (number of different species) and species evenness (how balanced their abundances are) to compare ecosystems or track biodiversity changes. Biodiversity has two main components visible in data: (1) SPECIES RICHNESS is simply the count of how many different species are present—count the rows in a table, count the bars in a graph, or count the species listed (example: if data shows oak, maple, pine, birch, hickory, that's 5 species, so richness = 5). Higher richness = more species = higher biodiversity. (2) SPECIES EVENNESS describes how balanced the populations are—if all species have similar abundances (like 100, 95, 105, 98 individuals each), that's HIGH evenness (balanced), but if one species dominates (like 500, 10, 5, 3 individuals), that's LOW evenness (unbalanced) even though richness is the same (4 species both cases). HIGH BIODIVERSITY ecosystems have BOTH high richness (many species) AND high evenness (relatively balanced), while LOW BIODIVERSITY has few species or is dominated by one or two species! Comparing: ecosystem with 25 species and balanced abundances is more diverse than ecosystem with 8 species or ecosystem with 25 species but 90% is one species. Patch 1 has higher richness (10 species vs. 6) and higher evenness (20% max dominance vs. 65%), making its overall biodiversity superior as it combines more species with better balance. Choice C correctly analyzes biodiversity data by evaluating both richness and evenness to determine the patch with higher overall diversity. Choice A fails by favoring higher dominance as positive, but encouraging reminder: high dominance lowers evenness and thus biodiversity—balance supports healthier ecosystems! Analyzing biodiversity from data—the two-check method: (1) COUNT species (richness): In a table, count how many different species are listed (rows usually). In a graph, count how many bars or data points. In a list, count distinct species names. This gives species richness. Example: table with Species A, B, C, D, E = 5 species, richness = 5. (2) CHECK evenness (balance): Look at abundances (population sizes, percentages, bar heights). Are they SIMILAR (high evenness: like 100, 95, 110, 98) or VERY DIFFERENT (low evenness: like 500, 10, 8, 5)? If one species has 80%+ of total, that's low evenness (dominated). If each species has ~similar %, high evenness (balanced). (3) COMBINE for overall diversity: High richness + high evenness = HIGH biodiversity (many species, balanced—example: rainforest with 100+ species, none dominating). Impressive integration of factors—you're on your way to expertise!
Question 9
A field class compared two habitats (same size area) for insect biodiversity.
Habitat M species abundances: Beetle (25), Ant (24), Fly (26), Bee (23), Butterfly (22).
Habitat N species abundances: Beetle (95), Ant (2), Fly (1), Bee (1), Butterfly (1).
Which statement is correct?
- Habitat N has higher biodiversity because it has more beetles
- Habitat M has higher biodiversity because it has the same richness as N but much higher evenness (correct answer)
- Habitat N has higher biodiversity because it has lower richness
- Both habitats have different richness because Habitat N has more total insects
Explanation: This question tests your ability to analyze biodiversity data by reading species richness (number of different species) and species evenness (how balanced their abundances are) to compare ecosystems or track biodiversity changes. Biodiversity has two main components visible in data: (1) SPECIES RICHNESS is simply the count of how many different species are present—count the rows in a table, count the bars in a graph, or count the species listed (example: if data shows oak, maple, pine, birch, hickory, that's 5 species, so richness = 5). Higher richness = more species = higher biodiversity. (2) SPECIES EVENNESS describes how balanced the populations are—if all species have similar abundances (like 100, 95, 105, 98 individuals each), that's HIGH evenness (balanced), but if one species dominates (like 500, 10, 5, 3 individuals), that's LOW evenness (unbalanced) even though richness is the same (4 species both cases). HIGH BIODIVERSITY ecosystems have BOTH high richness (many species) AND high evenness (relatively balanced), while LOW BIODIVERSITY has few species or is dominated by one or two species. Comparing: ecosystem with 25 species and balanced abundances is more diverse than ecosystem with 8 species or ecosystem with 25 species but 90% is one species! The provided abundances show both habitats with 5 insect species (same richness), but Habitat M has very even numbers (high evenness), while N is dominated by beetles (low evenness), so M has higher overall biodiversity. Choice B correctly analyzes biodiversity data by accurately counting species richness, assessing evenness from abundance patterns, and comparing diversity between ecosystems. Choice A prioritizes total insects over evenness, but balance is key for biodiversity—terrific correction! You're amazing—master the two-check method: (1) COUNT species (richness): In a table, count how many different species are listed (rows usually). In a graph, count how many bars or data points. In a list, count distinct species names. This gives species richness. Example: table with Species A, B, C, D, E = 5 species, richness = 5. (2) CHECK evenness (balance): Look at abundances (population sizes, percentages, bar heights). Are they SIMILAR (high evenness: like 100, 95, 110, 98) or VERY DIFFERENT (low evenness: like 500, 10, 8, 5)? If one species has 80%+ of total, that's low evenness (dominated). If each species has ~similar %, high evenness (balanced). (3) COMBINE for overall diversity: High richness + high evenness = HIGH biodiversity (many species, balanced—example: rainforest with 100+ species, none dominating). Low richness or low evenness = LOW biodiversity (few species—example: corn field with 3 species, or unbalanced—example: lawn with 10 plant species but 95% grass). Comparing ecosystems: which has higher biodiversity? First compare richness (more species usually wins unless very uneven). If richness similar, check evenness (more balanced wins). Example: Ecosystem A (richness 20, very even) vs Ecosystem B (richness 22, one species
Question 10
A biologist sampled two tide pools for the number of different species present.
Tide Pool 1 species list: sea star, mussel, crab, anemone, snail, algae.
Tide Pool 2 species list: mussel, crab, algae.
What is the species richness of each tide pool?
- Tide Pool 1: 6 species; Tide Pool 2: 3 species (correct answer)
- Tide Pool 1: 6 species; Tide Pool 2: 6 species
- Tide Pool 1: 12 species; Tide Pool 2: 6 species
- Tide Pool 1: 3 species; Tide Pool 2: 6 species
Explanation: This question tests your ability to analyze biodiversity data by reading species richness (number of different species) and species evenness (how balanced their abundances are) to compare ecosystems or track biodiversity changes. Biodiversity has two main components visible in data: (1) SPECIES RICHNESS is simply the count of how many different species are present—count the rows in a table, count the bars in a graph, or count the species listed (example: if data shows oak, maple, pine, birch, hickory, that's 5 species, so richness = 5). Higher richness = more species = higher biodiversity. (2) SPECIES EVENNESS describes how balanced the populations are—if all species have similar abundances (like 100, 95, 105, 98 individuals each), that's HIGH evenness (balanced), but if one species dominates (like 500, 10, 5, 3 individuals), that's LOW evenness (unbalanced) even though richness is the same (4 species both cases). For this problem, we simply count the distinct species in each list: Tide Pool 1 has sea star, mussel, crab, anemone, snail, algae = 6 different species (richness = 6), while Tide Pool 2 has mussel, crab, algae = 3 different species (richness = 3). Choice A correctly identifies the species richness as 6 for Tide Pool 1 and 3 for Tide Pool 2 by accurately counting each distinct species name in the lists. Choice B incorrectly counts 6 species in Tide Pool 2 (perhaps confusing the pools), while choice C doubles the count for Pool 1 and choice D reverses the pools. Analyzing biodiversity from data—the two-check method: (1) COUNT species (richness): In a table, count how many different species are listed (rows usually). In a graph, count how many bars or data points. In a list, count distinct species names. This gives species richness. Example: table with Species A, B, C, D, E = 5 species, richness = 5. (2) CHECK evenness (balance): Look at abundances (population sizes, percentages, bar heights). Are they SIMILAR (high evenness: like 100, 95, 110, 98) or VERY DIFFERENT (low evenness: like 500, 10, 8, 5)? Remember that species richness is purely a count of different species—it doesn't matter how many individuals of each species there are, just how many different types exist in the ecosystem!
Question 11
Two forest plots have the same species richness (same number of species), but different abundances.
Plot A counts: Oak 25, Maple 25, Pine 25, Birch 25.
Plot B counts: Oak 85, Maple 5, Pine 5, Birch 5.
Which statement is correct?
- Plot B has higher evenness because Oak is very successful
- Plot A has higher evenness because species abundances are more balanced (correct answer)
- Plot B has higher richness because it has more Oak trees
- Both plots have the same evenness because they have 4 species each
Explanation: This question tests your ability to analyze biodiversity data by reading species richness (number of different species) and species evenness (how balanced their abundances are) to compare ecosystems or track biodiversity changes. Biodiversity has two main components visible in data: (1) SPECIES RICHNESS is simply the count of how many different species are present—count the rows in a table, count the bars in a graph, or count the species listed (example: if data shows oak, maple, pine, birch, hickory, that's 5 species, so richness = 5). Higher richness = more species = higher biodiversity. (2) SPECIES EVENNESS describes how balanced the populations are—if all species have similar abundances (like 100, 95, 105, 98 individuals each), that's HIGH evenness (balanced), but if one species dominates (like 500, 10, 5, 3 individuals), that's LOW evenness (unbalanced) even though richness is the same (4 species both cases). Comparing the two plots: Plot A shows perfectly balanced abundances (25, 25, 25, 25—each species is 25% of total), while Plot B shows extreme dominance by Oak (85 out of 100 total = 85%, with other three species only 5% each), making Plot A dramatically more even despite identical richness of 4 species. Choice B correctly identifies that Plot A has higher evenness because the species abundances are more balanced (all equal at 25 each), creating a diverse community structure. Choice A incorrectly claims Plot B has higher evenness due to Oak's success (dominance actually reduces evenness), while choice C confuses richness with abundance. Analyzing biodiversity from data—the two-check method: (1) COUNT species (richness): In a table, count how many different species are listed (rows usually). In a graph, count how many bars or data points. In a list, count distinct species names. This gives species richness. Example: table with Species A, B, C, D, E = 5 species, richness = 5. (2) CHECK evenness (balance): Look at abundances (population sizes, percentages, bar heights). Are they SIMILAR (high evenness: like 100, 95, 110, 98) or VERY DIFFERENT (low evenness: like 500, 10, 8, 5)? Plot A's perfect 25-25-25-25 distribution represents maximum possible evenness, while Plot B's 85-5-5-5 distribution shows severe dominance and minimal evenness—this difference would be immediately visible as equal-height bars versus one towering bar in a graph!
Question 12
A researcher measured the percent of total individuals made up by the most abundant species in two habitats (a simple way to think about dominance and evenness).
Habitat M: 10 species; most abundant species = 22% of individuals
Habitat N: 10 species; most abundant species = 78% of individuals
Which habitat likely has higher species evenness?
- Habitat N, because 78% is a larger percentage
- Habitat M, because the most abundant species makes up a smaller share of the total (correct answer)
- Habitat N, because both habitats have the same richness
- Both habitats, because both have 10 species
Explanation: This question tests your ability to analyze biodiversity data by reading species richness (number of different species) and species evenness (how balanced their abundances are) to compare ecosystems or track biodiversity changes. Biodiversity has two main components visible in data: (1) SPECIES RICHNESS is simply the count of how many different species are present—count the rows in a table, count the bars in a graph, or count the species listed (example: if data shows oak, maple, pine, birch, hickory, that's 5 species, so richness = 5). Higher richness = more species = higher biodiversity. (2) SPECIES EVENNESS describes how balanced the populations are—if all species have similar abundances (like 100, 95, 105, 98 individuals each), that's HIGH evenness (balanced), but if one species dominates (like 500, 10, 5, 3 individuals), that's LOW evenness (unbalanced) even though richness is the same (4 species both cases). The key insight here is that lower dominance by the most abundant species indicates higher evenness: Habitat M with only 22% in its most abundant species is much more balanced than Habitat N where one species comprises 78% of all individuals—this extreme dominance in N means very low evenness. Choice B correctly identifies Habitat M as having higher evenness because when the most abundant species makes up a smaller share of the total (22% vs 78%), it indicates the community is more balanced across all species. Choice A incorrectly interprets the larger percentage as better evenness (it's actually worse—more dominance means less evenness), while choice C wrongly claims both have equal evenness. Analyzing biodiversity from data—the two-check method: (1) COUNT species (richness): In a table, count how many different species are listed (rows usually). In a graph, count how many bars or data points. In a list, count distinct species names. This gives species richness. Example: table with Species A, B, C, D, E = 5 species, richness = 5. (2) CHECK evenness (balance): Look at abundances (population sizes, percentages, bar heights). A quick evenness check: if one species has >50% of total individuals, that's low evenness. If no species has >30%, that's high evenness. Habitat M (22% max) shows high evenness while Habitat N (78% max) shows very low evenness—imagine 10 species where one has 780 individuals out of 1000 total!
Question 13
A class compared species richness between two stream sections by counting the number of different macroinvertebrate species found.
Section A: 11 species
Section B: 7 species
How much greater is the species richness in Section A than in Section B?
- 4 species (correct answer)
- 18 species
- 11 species
- 7 species
Explanation: This question tests your ability to analyze biodiversity data by reading species richness (number of different species) and species evenness (how balanced their abundances are) to compare ecosystems or track biodiversity changes. Biodiversity has two main components visible in data: (1) SPECIES RICHNESS is simply the count of how many different species are present—count the rows in a table, count the bars in a graph, or count the species listed (example: if data shows oak, maple, pine, birch, hickory, that's 5 species, so richness = 5). Higher richness = more species = higher biodiversity. (2) SPECIES EVENNESS describes how balanced the populations are—if all species have similar abundances (like 100, 95, 105, 98 individuals each), that's HIGH evenness (balanced), but if one species dominates (like 500, 10, 5, 3 individuals), that's LOW evenness (unbalanced) even though richness is the same (4 species both cases). This is a simple subtraction problem: Section A has 11 species and Section B has 7 species, so the difference in species richness is 11 - 7 = 4 species greater in Section A. Choice A correctly calculates that Section A has 4 more species than Section B (11 - 7 = 4), showing proper understanding of comparing species richness values. Choice B incorrectly adds the values (11 + 7 = 18), choice C just states Section A's richness without comparing, and choice D states Section B's richness without calculating the difference. Analyzing biodiversity from data—the two-check method: (1) COUNT species (richness): In a table, count how many different species are listed (rows usually). In a graph, count how many bars or data points. In a list, count distinct species names. This gives species richness. Example: table with Species A, B, C, D, E = 5 species, richness = 5. When comparing richness between sites, subtract the smaller value from the larger value to find the difference—this tells you how many more species the richer site has, which is useful for assessing the magnitude of biodiversity differences between ecosystems!
Question 14
Two desert sites have the same species richness (4 lizard species each). The counts below show the number of individuals of each species.
Site M: L1 (25), L2 (24), L3 (26), L4 (25)
Site N: L1 (90), L2 (5), L3 (3), L4 (2)
Which statement is most accurate?
- Site N has higher biodiversity because it has more total lizards.
- Site M has higher biodiversity because it has higher evenness with the same richness. (correct answer)
- Both sites have equal biodiversity because their richness is the same.
- Site N has higher biodiversity because it has a dominant species.
Explanation: This question tests your ability to analyze biodiversity data by reading species richness (number of different species) and species evenness (how balanced their abundances are) to compare ecosystems or track biodiversity changes. Biodiversity has two main components visible in data: (1) SPECIES RICHNESS is simply the count of how many different species are present—count the rows in a table, count the bars in a graph, or count the species listed (example: if data shows oak, maple, pine, birch, hickory, that's 5 species, so richness = 5). Higher richness = more species = higher biodiversity. (2) SPECIES EVENNESS describes how balanced the populations are—if all species have similar abundances (like 100, 95, 105, 98 individuals each), that's HIGH evenness (balanced), but if one species dominates (like 500, 10, 5, 3 individuals), that's LOW evenness (unbalanced) even though richness is the same (4 species both cases). HIGH BIODIVERSITY ecosystems have BOTH high richness (many species) AND high evenness (relatively balanced), while LOW BIODIVERSITY has few species or is dominated by one or two species! Comparing: ecosystem with 25 species and balanced abundances is more diverse than ecosystem with 8 species or ecosystem with 25 species but 90% is one species. Both sites have 4 lizard species (same richness), but Site M shows high evenness with 24-26 per species, while Site N has low evenness with L1 at 90 dominating over 2-5, so M has higher biodiversity. Choice B correctly analyzes biodiversity data by accurately counting richness as equal and assessing evenness to compare overall diversity. Choice A fails by emphasizing total lizards, but positive tip: biodiversity prioritizes diversity metrics over sheer numbers—balance makes M more diverse! Analyzing biodiversity from data—the two-check method: (1) COUNT species (richness): In a table, count how many different species are listed (rows usually). In a graph, count how many bars or data points. In a list, count distinct species names. This gives species richness. Example: table with Species A, B, C, D, E = 5 species, richness = 5. (2) CHECK evenness (balance): Look at abundances (population sizes, percentages, bar heights). Are they SIMILAR (high evenness: like 100, 95, 110, 98) or VERY DIFFERENT (low evenness: like 500, 10, 8, 5)? If one species has 80%+ of total, that's low evenness (dominated). If each species has ~similar %, high evenness (balanced). (3) COMBINE for overall diversity: High richness + high evenness = HIGH biodiversity (many species, balanced—example: rainforest with 100+ species, none dominating). You're mastering comparisons—keep it up!
Question 15
A biologist sampled two pond edges and recorded which amphibian species were present.
Site 1 species list: Frog A, Frog B, Salamander A, Salamander B, Toad A
Site 2 species list: Frog A, Toad A
Which site has greater species richness, and what are the richness values?
- Site 1; richness = 5 species. Site 2; richness = 2 species. (correct answer)
- Site 1; richness = 7 species. Site 2; richness = 2 species.
- Site 2; richness = 5 species. Site 1; richness = 2 species.
- Both sites have the same richness because they both include Frog A and Toad A.
Explanation: This question tests your ability to analyze biodiversity data by reading species richness (number of different species) and species evenness (how balanced their abundances are) to compare ecosystems or track biodiversity changes. Biodiversity has two main components visible in data: (1) SPECIES RICHNESS is simply the count of how many different species are present—count the rows in a table, count the bars in a graph, or count the species listed (example: if data shows oak, maple, pine, birch, hickory, that's 5 species, so richness = 5). Higher richness = more species = higher biodiversity. (2) SPECIES EVENNESS describes how balanced the populations are—if all species have similar abundances (like 100, 95, 105, 98 individuals each), that's HIGH evenness (balanced), but if one species dominates (like 500, 10, 5, 3 individuals), that's LOW evenness (unbalanced) even though richness is the same (4 species both cases). HIGH BIODIVERSITY ecosystems have BOTH high richness (many species) AND high evenness (relatively balanced), while LOW BIODIVERSITY has few species or is dominated by one or two species! Comparing: ecosystem with 25 species and balanced abundances is more diverse than ecosystem with 8 species or ecosystem with 25 species but 90% is one species. Here, Site 1 lists 5 distinct species (Frog A, Frog B, Salamander A, Salamander B, Toad A), giving richness of 5, while Site 2 lists only 2 (Frog A, Toad A), so Site 1 has greater richness—no evenness data is provided, but the question focuses on richness comparison. Choice A correctly analyzes biodiversity data by accurately counting species richness for each site without double-counting shared species. Choice D fails by assuming same richness due to shared species, but supportive correction: richness counts distinct species per site independently, so shared ones don't make richness equal—Site 1 has more unique ones! Analyzing biodiversity from data—the two-check method: (1) COUNT species (richness): In a table, count how many different species are listed (rows usually). In a graph, count how many bars or data points. In a list, count distinct species names. This gives species richness. Example: table with Species A, B, C, D, E = 5 species, richness = 5. (2) CHECK evenness (balance): Look at abundances (population sizes, percentages, bar heights). Are they SIMILAR (high evenness: like 100, 95, 110, 98) or VERY DIFFERENT (low evenness: like 500, 10, 8, 5)? If one species has 80%+ of total, that's low evenness (dominated). If each species has ~similar %, high evenness (balanced). (3) COMBINE for overall diversity: High richness + high evenness = HIGH biodiversity (many species, balanced—example: rainforest with 100+ species, none dominating). You're doing great—keep counting carefully to master richness!
Question 16
A reef was surveyed in three different years. The number of different coral species found each year is shown below.
Year 2005: 32 species
Year 2015: 24 species
Year 2025: 15 species
Which conclusion is best supported by the data?
- Species richness increased over time
- Species richness decreased over time (correct answer)
- Species evenness increased because there are fewer species
- Biodiversity stayed the same because the habitat is a reef
Explanation: This question tests your ability to analyze biodiversity data by reading species richness (number of different species) and species evenness (how balanced their abundances are) to compare ecosystems or track biodiversity changes. Biodiversity has two main components visible in data: (1) SPECIES RICHNESS is simply the count of how many different species are present—count the rows in a table, count the bars in a graph, or count the species listed (example: if data shows oak, maple, pine, birch, hickory, that's 5 species, so richness = 5). Higher richness = more species = higher biodiversity. (2) SPECIES EVENNESS describes how balanced the populations are—if all species have similar abundances (like 100, 95, 105, 98 individuals each), that's HIGH evenness (balanced), but if one species dominates (like 500, 10, 5, 3 individuals), that's LOW evenness (unbalanced) even though richness is the same (4 species both cases). The reef data shows a clear trend: 2005 had 32 species, 2015 had 24 species, and 2025 had only 15 species. This is a steady decline in species richness from 32→24→15, indicating decreasing biodiversity over the 20-year period. Choice B correctly identifies that species richness decreased over time, as shown by the declining number of coral species found in each survey (32→24→15 species). Choice C incorrectly claims evenness increased because there are fewer species, but evenness is about balance of abundances, not number of species—and we don't have abundance data here, only richness data. Analyzing biodiversity from data—the two-check method: (1) COUNT species (richness): In a table, count how many different species are listed (rows usually). In a graph, count how many bars or data points. In a list, count distinct species names. This gives species richness. Example: table with Species A, B, C, D, E = 5 species, richness = 5. (2) CHECK evenness (balance): Look at abundances (population sizes, percentages, bar heights). Are they SIMILAR (high evenness: like 100, 95, 110, 98) or VERY DIFFERENT (low evenness: like 500, 10, 8, 5)? When tracking biodiversity over time, decreasing species richness (fewer species present) is a clear sign of declining biodiversity—this reef lost over half its coral species diversity in 20 years, a concerning ecological trend!
Question 17
A student compared two schoolyard habitats by counting individuals of each plant species in a 1 m2 quadrat.
Which habitat has higher species richness?
- Habitat A (lawn), because it has more total plants
- Habitat B (meadow), because it contains more different species (correct answer)
- Habitat A (lawn), because one species is very abundant
- They have the same richness because both have plants
Explanation: This question tests your ability to analyze biodiversity data by reading species richness (number of different species) and species evenness (how balanced their abundances are) to compare ecosystems or track biodiversity changes. Biodiversity has two main components visible in data: (1) SPECIES RICHNESS is simply the count of how many different species are present—count the rows in a table, count the bars in a graph, or count the species listed (example: if data shows oak, maple, pine, birch, hickory, that's 5 species, so richness = 5). Higher richness = more species = higher biodiversity. (2) SPECIES EVENNESS describes how balanced the populations are—if all species have similar abundances (like 100, 95, 105, 98 individuals each), that's HIGH evenness (balanced), but if one species dominates (like 500, 10, 5, 3 individuals), that's LOW evenness (unbalanced) even though richness is the same (4 species both cases). Comparing the schoolyard habitats for species richness: Habitat A (lawn) likely has fewer plant species (maybe just 2-3 like grass, dandelion, clover), while Habitat B (meadow) has more different plant species (could be 8-10 different wildflowers, grasses, and herbs). Species richness only counts how many different species, not total individuals. Choice B correctly identifies that Habitat B (meadow) has higher species richness because it contains more different species—meadows typically support many plant species while lawns are often dominated by just a few grass species. Choice A incorrectly focuses on total plants (abundance) rather than number of different species—a lawn could have thousands of grass plants but still only represent 1-2 species, giving it low richness. Analyzing biodiversity from data—the two-check method: (1) COUNT species (richness): In a table, count how many different species are listed (rows usually). In a graph, count how many bars or data points. In a list, count distinct species names. This gives species richness. Example: table with Species A, B, C, D, E = 5 species, richness = 5. (2) CHECK evenness (balance): Look at abundances (population sizes, percentages, bar heights). Remember that managed habitats like lawns typically have low species richness (few species) even if they have many individual plants, while natural habitats like meadows support many different species!