All questions
Question 1
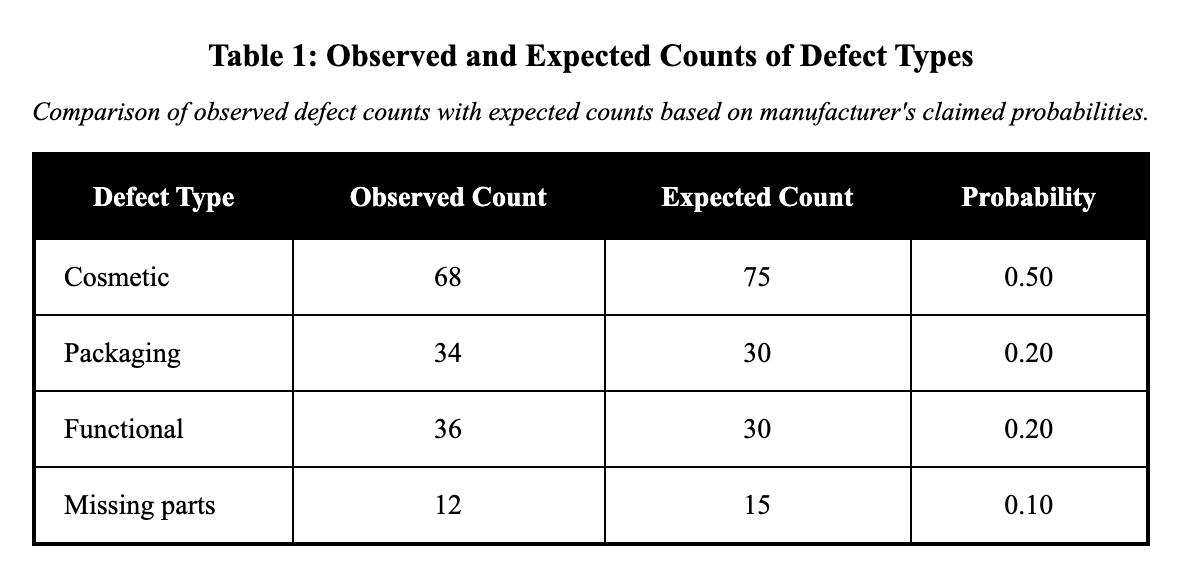
A manufacturer claims that defects in its products fall into 4 categories with probabilities 0.50 cosmetic, 0.20 packaging, 0.20 functional, and 0.10 missing parts. An auditor inspects 150 defective products and records the observed counts shown in the table. Which hypotheses are appropriate for a chi-square goodness-of-fit test of the claim?
Observed counts table (n = 150): Cosmetic 68, Packaging 34, Functional 36, Missing parts 12.
- H0: The population distribution of defect types is (0.50, 0.20, 0.20, 0.10). Ha: The population distribution of defect types is not (0.50, 0.20, 0.20, 0.10). (correct answer)
- H0: Defect type and production line are independent. Ha: Defect type and production line are not independent.
- H0: The observed counts are 75, 30, 30, 15. Ha: The observed counts are not exactly 75, 30, 30, 15.
- H0: The sample distribution of defect types is (0.50, 0.20, 0.20, 0.10). Ha: The sample distribution differs.
- H0: pcos=ppack=pfunc=pmiss=0.25. Ha: Not all four proportions are equal.
Explanation: This question tests hypothesis formulation for the chi-square goodness-of-fit test in AP Statistics, to see if defect types match the manufacturer's population probabilities (0.50 cosmetic, etc.). The null claims the population distribution is as stated, alternative that it's not. Option A accurately captures this. Option B is a distractor, suggesting independence, which isn't relevant without another variable like production line. Mini-lesson: Hypotheses must refer to population distributions, not observed counts (C), sample distributions (D), or equal proportions (E) unless claimed. Verification aligns with A as the proper setup.
Question 2
A local election official claims that the distribution of voters arriving at a polling place by hour is 10% from 7–8am, 25% from 8–10am, 35% from 10am–1pm, and 30% from 1–5pm. A random sample of 300 voters from election day is recorded with observed counts shown in the table. Which hypotheses are appropriate for a chi-square goodness-of-fit test?
Observed counts table (n = 300): 7–8am 24, 8–10am 90, 10am–1pm 108, 1–5pm 78.
- H0: The population distribution of arrival times matches 10%, 25%, 35%, 30%. Ha: The population distribution of arrival times does not match 10%, 25%, 35%, 30%. (correct answer)
- H0: The observed counts equal 30, 75, 105, 90. Ha: The observed counts are not exactly 30, 75, 105, 90.
- H0: Voter arrival time and political party are independent. Ha: Voter arrival time and political party are not independent.
- H0: The sample proportions are 10%, 25%, 35%, 30%. Ha: At least one sample proportion differs.
- H0: p7−8=p8−10=p10−1=p1−5=0.25. Ha: Not all four proportions equal 0.25.
Explanation: This question assesses hypothesis formulation for the chi-square goodness-of-fit test in AP Statistics, which examines whether sample data conforms to a hypothesized population distribution of categories. Appropriate hypotheses involve a null stating the population arrival times follow the official's claim (10%, 25%, 35%, 30%) and an alternative indicating mismatch in the population. Option A correctly specifies this, focusing on population parameters. Option C is a common distractor, representing the chi-square independence test, which is inappropriate here as there's only one categorical variable. In a mini-lesson, emphasize that goodness-of-fit setups must target population distributions, avoiding references to samples (D), observed counts (B), or equal proportions unless claimed (E). Verification shows A aligns with the test's requirements for the given claim.
Question 3
A die manufacturer claims its 6-sided die is fair, so each face (1–6) has probability 1/6. A quality-control inspector rolls one die 120 times and records the observed counts shown in the table. Which hypotheses are appropriate for a chi-square goodness-of-fit test?
Claimed distribution: each face 1/6.
Observed counts table (n = 120): 1: 15, 2: 18, 3: 22, 4: 17, 5: 25, 6: 23.
- H0: The population probabilities for faces 1–6 are each 1/6. Ha: At least one population probability for faces 1–6 differs from 1/6. (correct answer)
- H0: The sample probabilities for faces 1–6 are each 1/6. Ha: At least one sample probability differs from 1/6.
- H0: Outcome and trial number are independent. Ha: Outcome and trial number are not independent.
- H0: The observed counts are exactly 20 for each face. Ha: At least one observed count is not 20.
- H0: The die is biased toward larger numbers. Ha: The die is not biased toward larger numbers.
Explanation: This question tests hypothesis configuration for the chi-square goodness-of-fit test in AP Statistics, assessing if a die's outcomes fit a fair population model with each face at 1/6 probability. The null should claim equal population probabilities of 1/6 for faces 1-6, and the alternative that at least one differs. Option A precisely states this for the population. Option C distracts by suggesting an independence test, unsuitable for testing a single variable's distribution across rolls. Mini-lesson: Goodness-of-fit requires population-based hypotheses, not sample-based (B), count equality (D), or directional alternatives (E) unless specified. My check confirms A fits the fairness claim perfectly.
Question 4
A die manufacturer claims a six-sided die is fair, so each face (1–6) has probability 61. A student rolls the die 120 times and records the observed counts below.
Which hypotheses are appropriate for a chi-square goodness-of-fit test of the manufacturer's claim?
- H0: The sample proportions for faces 1–6 are each 61; Ha: The sample proportions are not all 61.
- H0: The population distribution of outcomes 1–6 is uniform (each 61); Ha: The population distribution of outcomes is not uniform. (correct answer)
- H0: Outcome is independent of roll number; Ha: Outcome is not independent of roll number.
- H0: The observed counts must be exactly 20 for each face; Ha: At least one observed count is not 20.
- H0: p(6)=61; Ha: p(6)=61.
Explanation: This question involves testing whether a die is fair using chi-square goodness-of-fit. For a fair die, each face should have probability 1/6 in the population of all possible rolls. Option A incorrectly refers to sample proportions - hypotheses must be about population parameters. Option B correctly states the null hypothesis that the population distribution is uniform (each outcome has probability 1/6), with the alternative that it's not uniform. The goodness-of-fit test determines whether the observed frequencies from 120 rolls provide evidence against the claim of fairness.
Question 5
A school cafeteria manager claims that students choose among four lunch options in the following proportions: 35% pizza, 30% salad, 20% sandwich, and 15% pasta. On a randomly selected day, a random sample of 200 students is recorded with the observed counts below.
Which hypotheses are appropriate for a chi-square goodness-of-fit test of the manager's claim?
- H0: The observed counts are 70 pizza, 60 salad, 40 sandwich, 30 pasta; Ha: The observed counts are not those values.
- H0: The population distribution of lunch choices is 0.35 pizza, 0.30 salad, 0.20 sandwich, 0.15 pasta; Ha: The population distribution differs from these proportions. (correct answer)
- H0: The sample distribution of lunch choices is 0.35, 0.30, 0.20, 0.15; Ha: The sample distribution is not 0.35, 0.30, 0.20, 0.15.
- H0: Lunch choice is independent of whether a student was sampled; Ha: Lunch choice is not independent of whether a student was sampled.
- H0: Each lunch option is equally likely (25% each); Ha: At least one option has a different probability.
Explanation: This question tests proper hypothesis formulation for a cafeteria manager's claim about lunch preferences. The null hypothesis must state the claimed population distribution (35% pizza, 30% salad, 20% sandwich, 15% pasta), not sample values or observed counts. Option C incorrectly refers to the sample distribution - hypotheses are about population parameters. Option B correctly states that the population distribution follows the claimed proportions, with the alternative being that it differs. The chi-square goodness-of-fit test helps determine if observed sample data provides sufficient evidence against the claimed population distribution.
Question 6
A city's transportation office claims that commuters use the following primary modes of transportation: 50% drive alone, 20% carpool, 15% public transit, 10% bike, and 5% walk. A random sample of 400 commuters is taken and the observed counts are shown below.
Which hypotheses are appropriate for a chi-square goodness-of-fit test of the office's claim?
- H0: Mode of transportation is independent of commuter; Ha: Mode of transportation is not independent of commuter.
- H0: The sample proportions are 0.50, 0.20, 0.15, 0.10, 0.05 for the five modes; Ha: The sample proportions differ from these values.
- H0: The population distribution of primary commute mode is 0.50 drive alone, 0.20 carpool, 0.15 public transit, 0.10 bike, 0.05 walk; Ha: The population distribution is not as claimed. (correct answer)
- H0: pdrive=pcarpool=ptransit=pbike=pwalk; Ha: At least one proportion differs.
- H0: The observed counts match the claim exactly; Ha: The observed counts do not match the claim exactly.
Explanation: This question tests understanding of chi-square goodness-of-fit hypothesis setup for transportation mode claims. The null hypothesis should state the claimed population distribution of commute modes (50% drive alone, 20% carpool, 15% public transit, 10% bike, 5% walk). Option B incorrectly refers to sample proportions - we test population parameters, not sample statistics. Option C correctly states the null hypothesis about the population distribution matching the claim, with the alternative that it differs. Options about independence or equal proportions are inappropriate for goodness-of-fit tests, which specifically test whether data fits a claimed distribution.
Question 7
A political analyst claims that support for three candidates in a district is: 45% Candidate A, 35% Candidate B, and 20% Candidate C. A random sample of 500 registered voters is polled and the observed counts are shown below.
Which hypotheses are appropriate for a chi-square goodness-of-fit test of the analyst's claim?
- H0: The population distribution of candidate support is 0.45 A, 0.35 B, 0.20 C; Ha: The population distribution of candidate support differs from 0.45/0.35/0.20. (correct answer)
- H0: Candidate support is independent of voter; Ha: Candidate support is not independent of voter.
- H0: The sample distribution is 0.45/0.35/0.20; Ha: The sample distribution is not 0.45/0.35/0.20.
- H0: Each candidate has equal support (1/3 each); Ha: Support is not equal for all candidates.
- H0: The observed counts equal the expected counts; Ha: The observed counts do not equal the expected counts.
Explanation: This question tests understanding of chi-square goodness-of-fit hypothesis setup for political polling. The null hypothesis should state the analyst's claimed population distribution of support (45% Candidate A, 35% Candidate B, 20% Candidate C). Option C incorrectly refers to the sample distribution - we test population parameters, not sample statistics. Option A correctly states the null hypothesis about the population distribution matching the claim, with the alternative that it differs. Goodness-of-fit tests specifically examine whether observed sample data provides evidence against a claimed population distribution.
Question 8
An online retailer claims that orders are shipped using three carriers in these proportions: 50% Carrier A, 30% Carrier B, and 20% Carrier C. A random sample of 250 recent orders is selected and the observed counts are shown below.
Which hypotheses are appropriate for a chi-square goodness-of-fit test of the retailer's claim?
- H0: The population distribution of shipping carriers is 0.50 A, 0.30 B, 0.20 C; Ha: The population distribution of shipping carriers differs from 0.50/0.30/0.20. (correct answer)
- H0: The observed counts are exactly 125, 75, and 50; Ha: The observed counts are not exactly 125, 75, and 50.
- H0: Shipping carrier is independent of order number; Ha: Shipping carrier is not independent of order number.
- H0: The sample distribution of shipping carriers is 0.50/0.30/0.20; Ha: The sample distribution is not 0.50/0.30/0.20.
- H0: Each carrier is equally likely (1/3 each); Ha: At least one carrier has a different probability.
Explanation: This question tests understanding of hypothesis setup for testing a retailer's shipping carrier claim. The null hypothesis should state the claimed population distribution (50% Carrier A, 30% Carrier B, 20% Carrier C), not sample statistics or observed counts. Option D incorrectly refers to the sample distribution rather than population parameters. Option A correctly states that the population distribution of shipping carriers follows the claimed proportions, with the alternative that it differs. Chi-square goodness-of-fit tests whether observed sample data provides evidence against a specific claimed population distribution.
Question 9
A museum claims that visitors' favorite exhibit among four options is distributed as follows: 10% Exhibit 1, 20% Exhibit 2, 30% Exhibit 3, and 40% Exhibit 4. A random sample of 150 visitors is surveyed, producing the observed counts below.
Which hypotheses are appropriate for a chi-square goodness-of-fit test of the museum's claim?
- H0: Favorite exhibit is independent of whether a visitor is in the sample; Ha: Favorite exhibit is not independent of whether a visitor is in the sample.
- H0: The population distribution of favorite exhibit is 0.10, 0.20, 0.30, 0.40 for Exhibits 1–4; Ha: The population distribution is not 0.10, 0.20, 0.30, 0.40. (correct answer)
- H0: The sample proportions are 0.10, 0.20, 0.30, 0.40; Ha: The sample proportions are not 0.10, 0.20, 0.30, 0.40.
- H0: Each exhibit is equally likely (25% each); Ha: The exhibits are not equally likely.
- H0: The observed counts match the expected counts exactly; Ha: They do not match exactly.
Explanation: This question assesses proper hypothesis formulation for testing a museum's claim about exhibit preferences. The null hypothesis must state the claimed population distribution (10% Exhibit 1, 20% Exhibit 2, 30% Exhibit 3, 40% Exhibit 4). Option C incorrectly refers to sample proportions - hypotheses are always about population parameters. Option B correctly states that the population distribution of favorite exhibits follows the claimed proportions, with the alternative being that it differs. The chi-square goodness-of-fit test determines whether the observed visitor preferences provide evidence against the museum's claimed distribution.
Question 10
A museum claims that the long-run distribution of visitor ticket types is 70% adult, 20% child, and 10% senior. On a randomly selected day, a random sample of 300 visitors is taken from that day's visitors, and ticket type is recorded.
Observed counts table:
Adult 225, Child 54, Senior 21
Claimed distribution: (0.70, 0.20, 0.10). Which hypotheses are appropriate for a chi-square goodness-of-fit test?
- H0: Ticket type and day are independent. Ha: Ticket type and day are not independent.
- H0: The long-run distribution of ticket types for museum visitors is 70% adult, 20% child, 10% senior. Ha: The long-run distribution of ticket types for museum visitors is not 70%, 20%, 10%. (correct answer)
- H0: The sample proportions are 0.70, 0.20, 0.10. Ha: The sample proportions are not 0.70, 0.20, 0.10.
- H0: padult=0.70. Ha: padult=0.70.
- H0: The expected counts are (225, 54, 21). Ha: The expected counts are not (225, 54, 21).
Explanation: This AP Statistics question focuses on chi-square goodness-of-fit hypothesis setup. The test examines if categorical sample data fits a hypothesized population distribution, like ticket types. The appropriate H0 is that the long-run distribution is 70% adult, 20% child, and 10% senior, with Ha that it differs. This is correct for assessing the museum's claim. Choice C is a common distractor, incorrectly using sample proportions. Mini-lesson: Always reference the population in H0; avoid independence tests (choice A) or single-proportion (choice D). Hypotheses about expected counts (choice E) are not standard, as the test derives them from H0.
Question 11
A streaming service claims that the proportion of its users who prefer each of five genres is: 40% drama, 25% comedy, 15% action, 10% documentary, and 10% sci-fi. A random sample of 300 users is surveyed, producing the observed counts below.
Which hypotheses are appropriate for a chi-square goodness-of-fit test of the company's claim?
- H0: The population distribution of preferred genre is 0.40 drama, 0.25 comedy, 0.15 action, 0.10 documentary, 0.10 sci-fi; Ha: The population distribution differs from these proportions. (correct answer)
- H0: The sample distribution of preferred genre is 0.40 drama, 0.25 comedy, 0.15 action, 0.10 documentary, 0.10 sci-fi; Ha: The sample distribution differs from these proportions.
- H0: Preferred genre is independent of whether a user is in the sample; Ha: Preferred genre is not independent of whether a user is in the sample.
- H0: Each genre is equally preferred (20% each); Ha: Preferences are not equally distributed.
- H0: The observed counts equal the expected counts; Ha: The observed counts do not equal the expected counts.
Explanation: This question assesses proper hypothesis formulation for testing a streaming service's claimed genre preferences. The null hypothesis must state the claimed population distribution (40% drama, 25% comedy, 15% action, 10% documentary, 10% sci-fi), not sample proportions. Option B incorrectly refers to the sample distribution - hypotheses are always about population parameters, never sample statistics. Option A correctly states that the population distribution follows the claimed proportions, with the alternative being that it differs. The chi-square goodness-of-fit test determines whether observed sample data provides evidence against a claimed population distribution.
Question 12
A school counselor claims that the long-run distribution of students' preferred study times is 25% morning, 45% afternoon, and 30% evening. A random sample of 120 students is surveyed with results shown.
Observed counts table:
Morning 22, Afternoon 61, Evening 37
Claimed distribution: (0.25, 0.45, 0.30). Which hypotheses are appropriate for a chi-square goodness-of-fit test?
- H0: The distribution of preferred study times in the sample is 25% morning, 45% afternoon, 30% evening. Ha: The sample distribution is different.
- H0: Preferred study time is independent of the student selected. Ha: Preferred study time is not independent of the student selected.
- H0: The long-run distribution of preferred study times for students at this school is 25% morning, 45% afternoon, 30% evening. Ha: The long-run distribution is not 25%, 45%, 30%. (correct answer)
- H0: pafternoon=0.45. Ha: pafternoon=0.45.
- H0: The observed counts equal (30, 54, 36). Ha: The observed counts are not (30, 54, 36).
Explanation: In AP Statistics, this tests hypothesis setup for the chi-square goodness-of-fit test. The test assesses if categorical data from a sample fits a proposed population distribution, here study times. The correct H0 is that the long-run distribution for students is 25% morning, 45% afternoon, and 30% evening, with Ha that it is not. This is accurate because it evaluates the counselor's claim about the population. Choice A distracts by applying to the sample, not the population. Mini-lesson: Frame H0 with population proportions and Ha generally; avoid independence hypotheses (choice B) or single-proportion tests (choice D). Choice E incorrectly focuses on exact count equality, overlooking the role of expected counts in the test.
Question 13
A restaurant owner claims that the long-run distribution of entrée orders during dinner is 50% pasta, 20% burger, 15% salad, and 15% tacos. Over a randomly selected set of 180 dinner orders, the counts are recorded.
Observed counts table:
Pasta 84, Burger 44, Salad 22, Tacos 30
Claimed distribution: (0.50, 0.20, 0.15, 0.15). Which hypotheses are appropriate for a chi-square goodness-of-fit test?
- H0: The long-run distribution of entrée orders is (0.50, 0.20, 0.15, 0.15). Ha: The long-run distribution of entrée orders is different from (0.50, 0.20, 0.15, 0.15). (correct answer)
- H0: The distribution of entrée orders in these 180 orders is (0.50, 0.20, 0.15, 0.15). Ha: The distribution in these 180 orders is not (0.50, 0.20, 0.15, 0.15).
- H0: Entrée type is independent of the night selected. Ha: Entrée type is not independent of the night selected.
- H0: ppasta=0.50. Ha: ppasta=0.50.
- H0: The expected counts are 84, 44, 22, 30. Ha: The expected counts are not 84, 44, 22, 30.
Explanation: The skill here in AP Statistics is formulating hypotheses for the chi-square goodness-of-fit test. This test is designed to see if the distribution of a categorical variable in a population matches specified proportions, based on sample observations like entrée orders. The correct H0 is that the long-run distribution is 50% pasta, 20% burger, 15% salad, and 15% tacos, with Ha that it differs. This fits because it directly tests the owner's population claim. Choice B distracts by focusing on the sample distribution, not the population. Mini-lesson: Set H0 to the claimed population proportions and Ha as the negation; distinguish from independence tests (choice C) or single-category tests (choice D). Avoid hypotheses about expected counts directly (choice E), as the test compares observed to expected under H0.
Question 14
A board game manufacturer claims that the long-run distribution of outcomes when rolling its special 6-sided die is: 1 occurs 10% of the time, 2 occurs 15%, 3 occurs 20%, 4 occurs 20%, 5 occurs 20%, and 6 occurs 15%. A quality-control technician rolls the die 200 times and records the results.
Observed counts table:
1: 28, 2: 29, 3: 35, 4: 40, 5: 39, 6: 29
Claimed distribution: (0.10, 0.15, 0.20, 0.20, 0.20, 0.15). Which hypotheses are appropriate for a chi-square goodness-of-fit test?
- H0: The long-run distribution of die outcomes matches (0.10, 0.15, 0.20, 0.20, 0.20, 0.15). Ha: The long-run distribution of die outcomes does not match (0.10, 0.15, 0.20, 0.20, 0.20, 0.15). (correct answer)
- H0: The probability of rolling a 6 is 0.15. Ha: The probability of rolling a 6 is not 0.15.
- H0: The observed counts are proportional to (0.10, 0.15, 0.20, 0.20, 0.20, 0.15) in this sample. Ha: The observed counts are not proportional in this sample.
- H0: Outcome and roll number are independent. Ha: Outcome and roll number are not independent.
- H0: The expected counts are (28, 29, 35, 40, 39, 29). Ha: The expected counts are not (28, 29, 35, 40, 39, 29).
Explanation: This AP Statistics question evaluates hypotheses for a chi-square goodness-of-fit test. The test checks if observed outcomes fit a specified distribution, like die rolls. The proper H0 is that the long-run distribution matches (0.10, 0.15, 0.20, 0.20, 0.20, 0.15), with Ha that it does not. This is correct for testing the manufacturer's population claim. Choice C is a distractor, wrongly emphasizing the sample. Mini-lesson: Ensure H0 specifies all population probabilities; differentiate from single-proportion tests (choice B) or independence (choice D). Avoid direct expected count hypotheses (choice E), as the test computes expectations under H0 to compare with observations.
Question 15
A streaming service claims that the long-run distribution of subscription types among its customers is 55% Basic, 30% Standard, and 15% Premium. A random sample of 200 current customers is selected, and their subscription types are recorded as shown.
Observed counts table:
Basic 96, Standard 73, Premium 31
Claimed distribution: (0.55, 0.30, 0.15). Which hypotheses are appropriate for a chi-square goodness-of-fit test?
- H0: The long-run distribution of subscription types is 55% Basic, 30% Standard, 15% Premium. Ha: The long-run distribution of subscription types differs from 55%, 30%, 15%. (correct answer)
- H0: The sample distribution is 55% Basic, 30% Standard, 15% Premium. Ha: The sample distribution is not 55%, 30%, 15%.
- H0: Subscription type is independent of customer. Ha: Subscription type is not independent of customer.
- H0: pBasic=0.55. Ha: pBasic=0.55.
- H0: The expected counts are (96, 73, 31). Ha: The expected counts are not (96, 73, 31).
Explanation: In AP Statistics, this question focuses on hypothesizing for a chi-square goodness-of-fit test. The test checks if sample data fits a hypothesized distribution of categories, here subscription types. The correct H0 is that the long-run distribution among all customers is 55% Basic, 30% Standard, and 15% Premium, with Ha stating it differs. This setup is appropriate as it targets the population claim, using the sample to test it. Choice B is a distractor because it wrongly frames the hypotheses around the sample distribution instead of the population. For a mini-lesson: Always ensure H0 references the population or long-run proportions, and avoid single-proportion tests like choice D, which only address one category. Hypotheses about independence, as in choice C, belong to the chi-square test of independence, not goodness-of-fit.
Question 16
A city transit report claims that riders pay their fare using 55% card, 35% mobile app, and 10% cash. A random sample of 500 riders is observed, with counts shown in the table. Which hypotheses are appropriate for a chi-square goodness-of-fit test of the report's claim?
Observed counts table (n = 500): Card 292, Mobile app 158, Cash 50.
- H0: Fare payment method and bus route are independent. Ha: Fare payment method and bus route are not independent.
- H0: The observed counts are 275 card, 175 app, 50 cash. Ha: At least one observed count differs from these values.
- H0: The population distribution of payment methods is 55% card, 35% app, 10% cash. Ha: The population distribution of payment methods is not 55%, 35%, 10%. (correct answer)
- H0: The sample distribution of payment methods is 55% card, 35% app, 10% cash. Ha: The sample distribution is not 55%, 35%, 10%.
- H0: pcard=papp=pcash=1/3. Ha: Not all three proportions are equal to 1/3.
Explanation: This question evaluates hypothesis setup for the chi-square goodness-of-fit test in AP Statistics, to verify if payment method data fits the transit report's population distribution (55% card, etc.). The null asserts the population matches these percentages, with the alternative denying it. Option C correctly phrases this at the population level. A common distractor is option A, which is for chi-square independence, not applicable without a second variable like bus route. Mini-lesson: Focus hypotheses on population proportions matching the claim, avoiding observed counts (B), sample distributions (D), or equal probabilities (E). Independent verification supports C as the right choice.
Question 17
A museum claims that visitors' favorite exhibit is distributed as 30% Ancient History, 25% Modern Art, 20% Science, 15% Nature, and 10% Technology. A random sample of 400 visitors is surveyed, and the observed counts are shown in the table. Which hypotheses are appropriate for a chi-square goodness-of-fit test?
Observed counts table (n = 400): Ancient 132, Modern Art 88, Science 70, Nature 66, Technology 44.
- H0: Favorite exhibit and day of week are independent. Ha: Favorite exhibit and day of week are not independent.
- H0: The population distribution of favorite exhibits is 30%, 25%, 20%, 15%, 10%. Ha: The population distribution is not 30%, 25%, 20%, 15%, 10%. (correct answer)
- H0: The sample proportions equal 30%, 25%, 20%, 15%, 10%. Ha: At least one sample proportion differs.
- H0: The observed counts equal 120, 100, 80, 60, 40. Ha: At least one observed count differs.
- H0: pAncient=pModern=pScience=pNature=pTech=0.20. Ha: Not all five proportions are 0.20.
Explanation: This question assesses setting up hypotheses for the chi-square goodness-of-fit test in AP Statistics, checking if visitor preferences align with the museum's claimed population distribution (30% Ancient, etc.). The null should state the population follows these percentages, alternative that it does not. Option B properly defines this. Option A distracts with independence hypotheses, which test associations, not distribution fit. Mini-lesson: Goodness-of-fit demands population parameter statements, not sample proportions (C), observed counts (D), or equal divisions (E) if unequal in the claim. Confirmation shows B is correct for the survey data.
Question 18
A survey firm claims that, in a certain county, political affiliation is distributed as 48% Independent, 42% Democrat, and 10% Republican. A random sample of 250 registered voters is selected and affiliation is recorded, with observed counts shown in the table. Which hypotheses are appropriate for a chi-square goodness-of-fit test?
Observed counts table (n = 250): Independent 110, Democrat 112, Republican 28.
- H0: Political affiliation and voter age group are independent. Ha: Political affiliation and voter age group are not independent.
- H0: The observed counts are 120 Independent, 105 Democrat, 25 Republican. Ha: At least one observed count differs from these values.
- H0: The population distribution of political affiliation is 48% Independent, 42% Democrat, 10% Republican. Ha: The population distribution of political affiliation differs from 48%, 42%, 10%. (correct answer)
- H0: The sample proportions are 48% Independent, 42% Democrat, 10% Republican. Ha: At least one sample proportion differs.
- H0: pI=pD=pR=1/3. Ha: Not all three proportions are equal.
Explanation: This question examines hypothesis setup for the chi-square goodness-of-fit test in AP Statistics, testing if voter affiliations fit the survey firm's population claims (48% Independent, etc.). The null should affirm the population distribution matches, alternative that it differs. Option C correctly specifies this. Option A distracts by using independence language, inappropriate for a single categorical variable. Mini-lesson: Ensure goodness-of-fit hypotheses target population proportions, not observed counts (B), sample proportions (D), or equal thirds (E). Independent solving confirms C as the appropriate choice.
Question 19
A city transportation department claims that the long-run distribution of commute modes for residents is 40% car, 35% public transit, 15% bike, and 10% walk. A random sample of 250 residents is surveyed, with results shown.
Observed counts table:
Car 112, Transit 78, Bike 36, Walk 24
Claimed distribution: (0.40, 0.35, 0.15, 0.10). Which hypotheses are appropriate for a chi-square goodness-of-fit test?
- H0: Commute mode and resident are independent. Ha: Commute mode and resident are not independent.
- H0: The long-run distribution of commute modes is 40% car, 35% transit, 15% bike, 10% walk. Ha: The long-run distribution of commute modes is not 40%, 35%, 15%, 10%. (correct answer)
- H0: The sample proportions are 0.40, 0.35, 0.15, 0.10. Ha: The sample proportions are not 0.40, 0.35, 0.15, 0.10.
- H0: pcar=0.40. Ha: pcar>0.40.
- H0: All observed counts equal their expected counts exactly. Ha: At least one observed count differs due to sampling variability.
Explanation: This AP Statistics question tests the setup of hypotheses for a chi-square goodness-of-fit test. The goodness-of-fit test evaluates whether observed categorical frequencies align with expected ones from a claimed population distribution, such as commute modes. The proper H0 asserts that the long-run distribution for residents is 40% car, 35% transit, 15% bike, and 10% walk, with Ha indicating it is not. This is correct because the test infers about the population based on sample data. A frequent distractor is choice C, which mistakenly applies proportions to the sample rather than the population. Mini-lesson: In goodness-of-fit, H0 specifies the full set of population proportions, and Ha is non-directional; avoid confusing with independence tests like choice A or one-sided single-proportion tests like choice D. Hypotheses about exact equality of counts, as in choice E, ignore sampling variability and are incorrect.
Question 20
A political analyst claims that the long-run distribution of party affiliation in a county is 48% Independent, 32% Democrat, and 20% Republican. A random sample of 250 registered voters is selected and asked their affiliation.
Observed counts table:
Independent 110, Democrat 88, Republican 52
Claimed distribution: (0.48, 0.32, 0.20). Which hypotheses are appropriate for a chi-square goodness-of-fit test?
- H0: The distribution of affiliations in the sample is 48% Independent, 32% Democrat, 20% Republican. Ha: The distribution of affiliations in the sample differs from 48%, 32%, 20%.
- H0: Affiliation is independent of voter. Ha: Affiliation is not independent of voter.
- H0: The long-run distribution of party affiliation in the county is 48% Independent, 32% Democrat, 20% Republican. Ha: The long-run distribution of party affiliation in the county is not 48%, 32%, 20%. (correct answer)
- H0: pRepublican=0.20. Ha: pRepublican<0.20.
- H0: The observed counts equal the claimed percentages exactly. Ha: The observed counts do not equal the claimed percentages exactly.
Explanation: In AP Statistics, this question tests setting up hypotheses for a chi-square goodness-of-fit test. The test determines if observed affiliations match a claimed distribution in the population. The correct H0 is that the long-run distribution is 48% Independent, 32% Democrat, and 20% Republican, with Ha that it is not. This fits because it tests the analyst's population claim. Choice A distracts by focusing on the sample. Mini-lesson: Specify population proportions in H0 and a general Ha; distinguish from independence (choice B) or directional tests (choice D). Choice E incorrectly demands exact matches, ignoring statistical variability in sampling.