All questions
Question 1
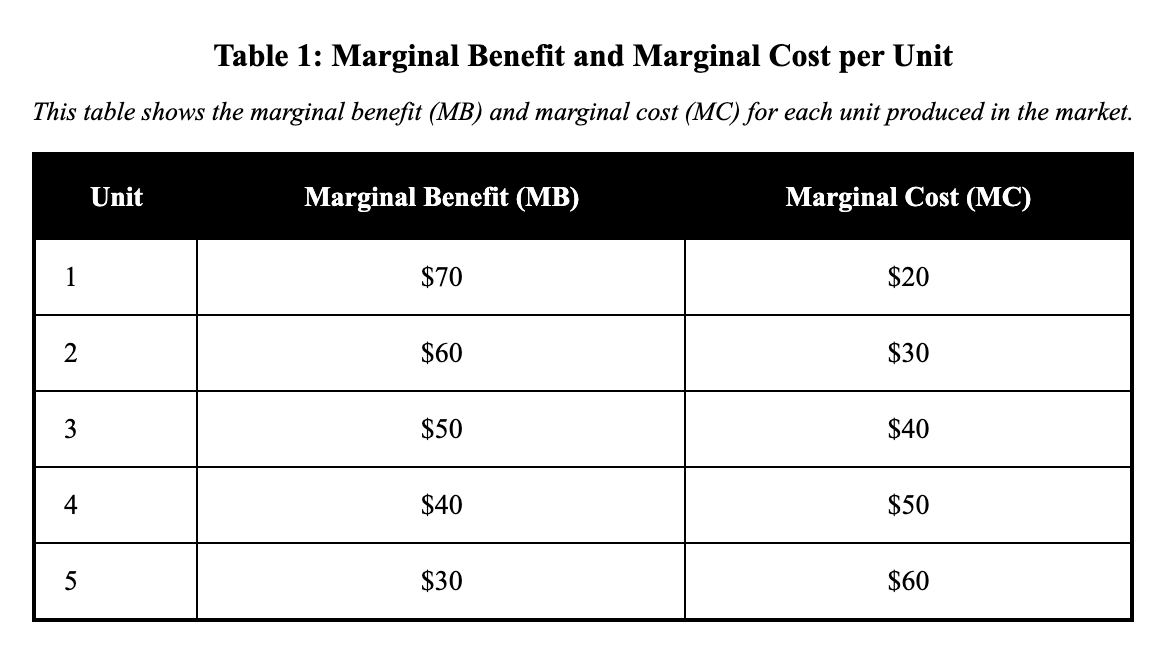
Based on the market outcome shown in the table, which statement correctly identifies the deadweight loss (DWL) when the market produces Q=1 unit?
Table (per unit):
- Unit 1: MB=\70,MC=$20$
- Unit 2: MB=\60,MC=$30$
- Unit 3: MB=\50,MC=$40$
- Unit 4: MB=\40,MC=$50$
- Unit 5: MB=\30,MC=$60$
- DWL is the loss from not producing units 2 and 3, where MB>MC (correct answer)
- DWL is the total spending by consumers on unit 1
- DWL is the tax revenue collected on units 2 and 3
- DWL is zero because MB>MC for the unit that is produced
- DWL is the transfer from producers to consumers on unit 1
Explanation: This question asks about deadweight loss when the market underproduces relative to the socially efficient quantity. Social efficiency requires producing where marginal benefit equals marginal cost to maximize total surplus. Looking at the table, units 2 and 3 both have MB > MC (unit 2: $60 > $30 = $30 surplus; unit 3: $50 > $40 = $10 surplus), meaning society loses $40 total by not producing these units—this is the deadweight loss. The market stops at Q=1, missing these beneficial trades. Students often confuse DWL with consumer spending or transfers, but DWL represents lost surplus from trades that should happen but don't. To find DWL from underproduction, identify all units where MB > MC that aren't being produced and sum the differences.
Question 2
Based on the market outcome shown in the table, at which quantity is total surplus maximized (the socially efficient quantity)? The market currently produces Q=4 units.
Table (per unit):
- Unit 1: MB=\65,MC=$5$
- Unit 2: MB=\55,MC=$15$
- Unit 3: MB=\45,MC=$25$
- Unit 4: MB=\35,MC=$35$
- Unit 5: MB=\25,MC=$45$
- Total surplus is maximized at Q=2 units
- Total surplus is maximized at Q=3 units
- Total surplus is maximized at Q=4 units (correct answer)
- Total surplus is maximized at Q=5 units
- Total surplus is maximized at Q=1 unit
Explanation: This question asks you to identify the socially efficient quantity where total surplus is maximized. Social efficiency occurs when we produce all units where marginal benefit equals or exceeds marginal cost. Looking at the table, MB > MC for units 1-3, MB = MC = $35 for unit 4, and MB < MC for unit 5. The efficient quantity is Q=4 because we capture all positive surplus and stop before creating losses. The market happening to produce Q=4 doesn't determine efficiency—what matters is the MB-MC relationship. Students sometimes think efficiency means equal consumer and producer surplus, but it only requires producing where MB = MC at the margin. To find the efficient quantity, produce all units where MB ≥ MC and stop when the next unit would have MB < MC.
Question 3
Based on the market outcome shown in the table, at which quantity is total surplus maximized (the socially efficient quantity)? The market currently produces Q=6 units.
Table (per unit):
- Unit 1: MB=\95,MC=$15$
- Unit 2: MB=\85,MC=$25$
- Unit 3: MB=\75,MC=$35$
- Unit 4: MB=\65,MC=$45$
- Unit 5: MB=\55,MC=$55$
- Unit 6: MB=\45,MC=$65$
- Total surplus is maximized at Q=4 units
- Total surplus is maximized at Q=5 units (correct answer)
- Total surplus is maximized at Q=6 units
- Total surplus is maximized at Q=3 units
- Total surplus is maximized at Q=2 units
Explanation: This question tests your ability to find the socially efficient quantity where total surplus is maximized. Social efficiency occurs when marginal benefit equals marginal cost for the last unit produced. Examining the table, we see MB > MC for units 1-4, MB = MC = $55 for unit 5, and MB < MC for unit 6. The efficient quantity is Q=5 because we produce all units where MB ≥ MC and stop before MB < MC. The fact that the market currently produces Q=6 (overproducing) doesn't change where efficiency occurs. Students sometimes think more production is always better, but producing unit 6 creates a 20loss(45 - $65). To find efficiency, produce each unit where MB ≥ MC and stop when MB would be less than MC. Question 4
Based on the market outcome shown in the table, which statement correctly identifies the deadweight loss (DWL) when the market produces Q=5 units?
Table (per unit):
- Unit 1: MB=\100,MC=$20$
- Unit 2: MB=\80,MC=$30$
- Unit 3: MB=\60,MC=$40$
- Unit 4: MB=\40,MC=$50$
- Unit 5: MB=\20,MC=$60$
- DWL is the loss from producing units where MC>MB, which occurs on units 4 and 5 (correct answer)
- DWL is zero because the market produces all 5 units demanded
- DWL is the transfer from consumers to producers on units 1 through 3
- DWL is the producer surplus on unit 3 because that is where profit is highest
- DWL is the consumer surplus on units 1 and 2 because MB is highest there
Explanation: This question tests understanding of deadweight loss and social efficiency. Social efficiency requires producing where marginal benefit equals marginal cost, maximizing total surplus. Looking at the table, efficiency occurs at Q=3 where MB = MC = $40, but the market produces Q=5. For units 4 and 5, MC exceeds MB (unit 4: $50 > $40; unit 5: $60 > $20), creating net losses of $10 and $40 respectively—this is the deadweight loss. Students often confuse transfers (like consumer or producer surplus) with deadweight loss, but DWL represents destroyed value, not redistributed value. To identify DWL, find units where MC > MB (overproduction) or where MB > MC but units aren't produced (underproduction).
Question 5
Based on the market outcome shown in the table, is the outcome socially efficient? The market currently produces Q=3 units.
Table (per unit):
- Unit 1: MB=\50,MC=$10$
- Unit 2: MB=\40,MC=$20$
- Unit 3: MB=\30,MC=$30$
- Unit 4: MB=\20,MC=$40$
- Unit 5: MB=\10,MC=$50$
- No; the outcome is inefficient because consumer surplus is positive at Q=3
- Yes; the outcome is efficient because MB=MC on the third unit and MB<MC on the fourth unit (correct answer)
- No; the outcome is inefficient because the market should always produce 5 units
- Yes; the outcome is efficient because firms earn zero economic profit at Q=3
- No; the outcome is inefficient because the market outcome differs from the highest MB
Explanation: This question asks whether a market outcome is socially efficient, which occurs when marginal benefit equals marginal cost. Social efficiency maximizes total surplus by producing all units where MB ≥ MC and stopping where MB < MC. The table shows that at Q=3, MB = MC = 30,andforunit4,MB(20) < MC ($40), which would create a loss. Since the market produces exactly Q=3 and stops before the inefficient fourth unit, this outcome is socially efficient. Students often think efficiency requires special conditions like zero profit, but it simply means producing where MB = MC at the margin. To verify efficiency, check that the last unit produced has MB = MC and the next unit would have MB < MC. Question 6
Based on the market outcome shown in the table, at which quantity is total surplus maximized (the socially efficient quantity)? Assume each row is an additional unit and MC is the marginal cost of producing that unit.
Table (per unit):
- Unit 1: MB=\90,MC=$20$
- Unit 2: MB=\80,MC=$30$
- Unit 3: MB=\70,MC=$40$
- Unit 4: MB=\60,MC=$50$
- Unit 5: MB=\50,MC=$60ThemarketproducesQ=3$ units.
- Total surplus is maximized at Q=3 units
- Total surplus is maximized at Q=4 units (correct answer)
- Total surplus is maximized at Q=5 units
- Total surplus is maximized at Q=2 units
- Total surplus is maximized at Q=1 unit
Explanation: This question tests your understanding of social efficiency in markets. Social efficiency occurs when marginal benefit (MB) equals marginal cost (MC), maximizing total surplus. Looking at the table, we need to find where MB = MC or where MB last exceeds MC. For units 1-4, MB > MC (adding positive surplus), but at unit 5, MB (50)<MC(60), creating a loss. Many students confuse the market equilibrium (Q=3) with the efficient quantity, but efficiency depends on MB vs MC, not what the market produces. To find efficiency, check each unit: if MB > MC, produce it; if MB < MC, don't produce it—here, produce through unit 4. Question 7
Based on the market outcome shown in the table, which region corresponds to deadweight loss (DWL) when the market produces Q=2 units instead of the socially efficient quantity?
Table (per unit):
- Unit 1: MB=\80,MC=$10$
- Unit 2: MB=\70,MC=$20$
- Unit 3: MB=\60,MC=$30$
- Unit 4: MB=\50,MC=$40$
- Unit 5: MB=\40,MC=$50$
- The net loss from not producing units 3 and 4, where MB>MC (correct answer)
- The consumer surplus on units 1 and 2 because buyers gain from trade
- The producer surplus on units 1 and 2 because sellers gain from trade
- The transfer between buyers and sellers on unit 2 due to the market price
- The total revenue earned by sellers on the first two units
Explanation: This question tests understanding of deadweight loss from underproduction relative to social efficiency. Social efficiency requires producing where marginal benefit equals marginal cost to maximize total surplus. The efficient quantity here is Q=4 (where MB last exceeds MC), but the market only produces Q=2. Units 3 and 4 have MB > MC (unit 3: $60 > $30 = $30 surplus; unit 4: $50 > $40 = $10 surplus), so not producing them creates $40 of deadweight loss. Students often confuse existing surpluses with deadweight loss—consumer and producer surplus on units 1-2 represent gains from trade, not losses. To identify DWL, find the net benefit (MB - MC) for each unit that should be produced but isn't, then sum these losses.
Question 8
Based on the market outcome shown in the table, is the outcome socially efficient? The market currently produces Q=4 units.
Table (per unit):
- Unit 1: MB=\75,MC=$10$
- Unit 2: MB=\65,MC=$20$
- Unit 3: MB=\55,MC=$30$
- Unit 4: MB=\45,MC=$40$
- Unit 5: MB=\35,MC=$50$
- Yes; the outcome is efficient because the market produces more output than before
- No; the outcome is inefficient because MB>MC for unit 5, so more should be produced
- Yes; the outcome is efficient because MB≥MC for units 1 through 4 and MB<MC for unit 5 (correct answer)
- No; the outcome is inefficient because any consumer surplus is deadweight loss
- Yes; the outcome is efficient because the price equals average total cost at Q=4
Explanation: This question tests whether you can identify social efficiency in a market outcome. Social efficiency occurs when marginal benefit equals marginal cost, maximizing total surplus by ensuring all beneficial trades happen. The table shows that for units 1-4, MB ≥ MC (creating positive or zero net surplus), while for unit 5, MB (35)<MC(50), which would create a $15 loss. Since the market produces Q=4 and stops before producing the inefficient fifth unit, this outcome is socially efficient. Students often confuse efficiency with other concepts like zero profit or equal surpluses, but efficiency only requires MB = MC at the margin. To verify efficiency, check that all produced units have MB ≥ MC and no unproduced units have MB > MC. Question 9
Based on the market outcome shown in the table, is the outcome socially efficient if the market produces Q=4 units? Social efficiency requires producing all units for which MB≥MC and no units for which MB<MC.
Table: Marginal Benefit and Marginal Cost by Unit
Units (Q): 1 2 3 4 5
MB ():119753MC(): 1 4 7 10 13
- Yes; because Q=4 is efficient whenever MB is still positive
- No; because efficiency occurs at Q=3 where MB=MC, and producing Q=4 creates deadweight loss (correct answer)
- Yes; because producing beyond MB=MC increases producer surplus
- No; because the market is efficient only at Q=5, the largest quantity listed
- Yes; because any difference between MB and MC is a transfer, not inefficiency
Explanation: Social efficiency is the key skill in determining the optimal market outcome. Efficiency is defined as the point where marginal benefit (MB) equals marginal cost (MC), maximizing total surplus. In the provided table, MB and MC values are listed for each unit from Q=1 to Q=5. The outcome at Q=4 is not efficient because efficiency occurs at Q=3 where MB=7 equals MC=7, and producing Q=4 creates deadweight loss since MB=5 < MC=10. A common misconception is that the market equilibrium always equals the efficient outcome, but externalities or market power can cause them to differ. A transferable strategy is to check if MB exceeds MC for each additional unit and produce until MB no longer exceeds MC. Continue by summing the net benefits to confirm the quantity that maximizes total surplus.
Question 10
Based on the market outcome shown in the graph, which region represents deadweight loss if a per-unit tax reduces the quantity traded from the efficient quantity Q∗ to Qt? Demand is MB and supply is MC.
Graph: Market for Coffee
- Demand: P=12−Q
- Supply: P=Q
- A tax causes the traded quantity to be Qt=4 (instead of the efficient quantity at the intersection).
- The triangle between demand and supply from Qt=4 to Q∗ (correct answer)
- The rectangle equal to (tax per unit) ×Qt, which is deadweight loss
- The entire consumer surplus after the tax is imposed
- The entire producer surplus after the tax is imposed
- There is no deadweight loss because tax revenue offsets any losses
Explanation: Social efficiency is the key skill in determining the optimal market outcome. Efficiency is defined as the point where marginal benefit (MB) equals marginal cost (MC), maximizing total surplus. In the provided graph, the demand curve represents MB and the supply curve represents MC, with a tax reducing quantity to Qt=4. The deadweight loss is the triangle between demand and supply from Qt=4 to Q*, representing forgone surplus from units not produced where MB > MC after the tax. A common misconception is that the market equilibrium always equals the efficient outcome, but externalities or market power can cause them to differ. A transferable strategy is to check if MB exceeds MC for each additional unit and produce until MB no longer exceeds MC. Continue by summing the net benefits to confirm the quantity that maximizes total surplus.
Question 11
Based on the market outcome shown in the graph, at which quantity is total surplus maximized? Demand is MB and supply is MC. Both curves are linear.
Graph: Market for Bottled Water
- Demand: P=14−Q
- Supply: P=2+Q
- Quantity is measured in units; price in dollars per unit.
- Quantity Q=4 units
- Quantity Q=5 units
- Quantity Q=6 units (correct answer)
- Quantity Q=7 units
- Quantity Q=8 units
Explanation: Social efficiency is the key skill in determining the optimal market outcome. Efficiency is defined as the point where marginal benefit (MB) equals marginal cost (MC), maximizing total surplus. In the provided graph, the demand curve represents MB and the supply curve represents MC, both linear. The efficient quantity is Q=6 because that's where the demand and supply curves intersect, equating MB and MC. A common misconception is that the market equilibrium always equals the efficient outcome, but externalities or market power can cause them to differ. A transferable strategy is to check if MB exceeds MC for each additional unit and produce until MB no longer exceeds MC. Continue by summing the net benefits to confirm the quantity that maximizes total surplus.
Question 12
Based on the market outcome shown in the table, at which quantity is total surplus maximized (the socially efficient quantity)? The market currently produces Q=1 unit.
Table (per unit):
- Unit 1: MB=\55,MC=$15$
- Unit 2: MB=\45,MC=$25$
- Unit 3: MB=\35,MC=$35$
- Unit 4: MB=\25,MC=$45$
- Unit 5: MB=\15,MC=$55$
- Total surplus is maximized at Q=1 unit
- Total surplus is maximized at Q=2 units
- Total surplus is maximized at Q=3 units (correct answer)
- Total surplus is maximized at Q=4 units
- Total surplus is maximized at Q=5 units
Explanation: This question asks you to identify the socially efficient quantity, where total surplus is maximized. Social efficiency occurs when marginal benefit equals marginal cost, ensuring all mutually beneficial trades occur. Examining the table, unit 3 shows MB = MC = $35, and this is where we should stop producing—units 1 and 2 have MB > MC (creating surplus), while units 4 and 5 have MB < MC (creating losses). The market producing only Q=1 doesn't determine efficiency; what matters is the MB-MC comparison. Students often think efficiency means producing the most units, but it means producing exactly where MB = MC. To find the efficient quantity, produce all units where MB ≥ MC and stop when MB < MC.
Question 13
Based on the market outcome shown in the table, is the outcome socially efficient if the market produces Q=2 units? Social efficiency occurs where MB=MC.
Table: Marginal Benefit and Marginal Cost by Unit
Units (Q): 1 2 3 4
MB ():9753MC(): 1 3 5 7
- Yes; because Q=2 maximizes profit where MB>MC
- Yes; because the market outcome must be efficient whenever output is positive
- No; because efficiency requires MB=MC, which occurs at Q=3 units (correct answer)
- No; because any consumer surplus at Q=2 is deadweight loss
- Yes; because efficiency is achieved at the quantity where MB is highest
Explanation: Social efficiency is the key skill in determining the optimal market outcome. Efficiency is defined as the point where marginal benefit (MB) equals marginal cost (MC), maximizing total surplus. In the provided table, MB and MC values are listed for each unit from Q=1 to Q=4. The market outcome at Q=2 is not efficient because efficiency occurs at Q=3 where MB=5 equals MC=5, and at Q=2 society forgoes positive surplus from the third unit. A common misconception is that the market equilibrium always equals the efficient outcome, but externalities or market power can cause them to differ. A transferable strategy is to check if MB exceeds MC for each additional unit and produce until MB no longer exceeds MC. Continue by summing the net benefits to confirm the quantity that maximizes total surplus.
Question 14
Based on the market outcome shown in the graph, is the outcome socially efficient if the market produces the competitive equilibrium quantity? Demand is MB and supply is MC.
Graph: Market for Gym Visits
- Demand: P=16−2Q
- Supply: P=4+Q
- Assume the market produces at the intersection of demand and supply.
- Yes; because competitive equilibrium occurs where MB=MC (correct answer)
- No; because competitive equilibrium maximizes total revenue, not total surplus
- No; because any equilibrium creates deadweight loss by definition
- Yes; because producer surplus is maximized at the intersection
- No; because the efficient quantity is where demand is highest
Explanation: Social efficiency is the key skill in determining the optimal market outcome. Efficiency is defined as the point where marginal benefit (MB) equals marginal cost (MC), maximizing total surplus. In the provided graph, the demand curve represents MB and the supply curve represents MC. The competitive equilibrium is efficient because it occurs at the intersection where MB=MC, assuming no externalities or market failures. A common misconception is that the market equilibrium always equals the efficient outcome, but externalities or market power can cause them to differ. A transferable strategy is to check if MB exceeds MC for each additional unit and produce until MB no longer exceeds MC. Continue by summing the net benefits to confirm the quantity that maximizes total surplus.
Question 15
Based on the market outcome shown in the table, at which quantity is total surplus maximized (socially efficient quantity)? Assume each unit has MC given by the supply-side marginal cost and MB given by the demand-side marginal benefit.
Table: Marginal Benefit and Marginal Cost by Unit
Units (Q): 1 2 3 4 5
MB ():108642MC(): 2 4 6 8 10
- Quantity Q=2 units
- Quantity Q=3 units (correct answer)
- Quantity Q=4 units
- Quantity Q=5 units
- Quantity Q=1 unit
Explanation: Social efficiency is the key skill in determining the optimal market outcome. Efficiency is defined as the point where marginal benefit (MB) equals marginal cost (MC), maximizing total surplus. In the provided table, MB and MC values are listed for each unit from Q=1 to Q=5. The efficient quantity is Q=3 because at this point MB=6 equals MC=6, and producing additional units would have MB < MC, reducing total surplus. A common misconception is that the market equilibrium always equals the efficient outcome, but externalities or market power can cause them to differ. A transferable strategy is to check if MB exceeds MC for each additional unit and produce until MB no longer exceeds MC. Continue by summing the net benefits to confirm the quantity that maximizes total surplus.
Question 16
Based on the market outcome shown in the table, which region represents deadweight loss if the market produces Q=5 units but the socially efficient quantity is where MB=MC? Deadweight loss is the net loss from producing units for which MC>MB.
Table: Marginal Benefit and Marginal Cost by Unit
Units (Q): 1 2 3 4 5
MB ():97531MC(): 1 3 5 7 9
- The loss on units Q=4 and Q=5, equal to (MC−MB) on those units (correct answer)
- The gain on units Q=1 and Q=2, equal to (MB−MC) on those units
- The transfer from consumers to producers on unit Q=3
- All producer surplus earned on units Q=1 through Q=5
- There is no deadweight loss because total output is higher than efficient output
Explanation: Social efficiency is the key skill in determining the optimal market outcome. Efficiency is defined as the point where marginal benefit (MB) equals marginal cost (MC), maximizing total surplus. In the provided table, MB and MC values are listed for each unit from Q=1 to Q=5. The deadweight loss when producing Q=5 is the loss on units Q=4 and Q=5, equal to (MC-MB) for those units where MC > MB beyond the efficient Q=3. A common misconception is that the market equilibrium always equals the efficient outcome, but externalities or market power can cause them to differ. A transferable strategy is to check if MB exceeds MC for each additional unit and produce until MB no longer exceeds MC. Continue by summing the net benefits to confirm the quantity that maximizes total surplus.
Question 17
Based on the market outcome shown in the table, is the outcome socially efficient? The market currently produces Q=2 units.
Table (per unit):
- Unit 1: MB=\60,MC=$10$
- Unit 2: MB=\50,MC=$20$
- Unit 3: MB=\40,MC=$30$
- Unit 4: MB=\30,MC=$40$
- Unit 5: MB=\20,MC=$50$
- Yes; the outcome is efficient because firms maximize profit at Q=2
- Yes; the outcome is efficient because MB=MC at Q=2
- No; the outcome is inefficient because MB>MC for unit 3, so more should be produced (correct answer)
- No; the outcome is inefficient because the market outcome is never efficient
- Yes; the outcome is efficient because consumer surplus equals producer surplus at Q=2
Explanation: This question asks about social efficiency, which occurs when marginal benefit equals marginal cost for all units produced. Social efficiency maximizes total surplus by producing all units where MB ≥ MC and stopping where MB < MC. The table shows the market produces Q=2, but for unit 3, MB (40)>MC(30), meaning society gains $10 of surplus if this unit is produced. The outcome is inefficient because we're missing this beneficial trade. Students often think profit maximization ensures efficiency, but private decisions may not account for all social benefits. To check efficiency, compare MB and MC for each unit—if MB > MC for any unproduced unit, the outcome is inefficient.