Interpreting Data from Tables Practice Test
•15 QuestionsPASSAGE VI
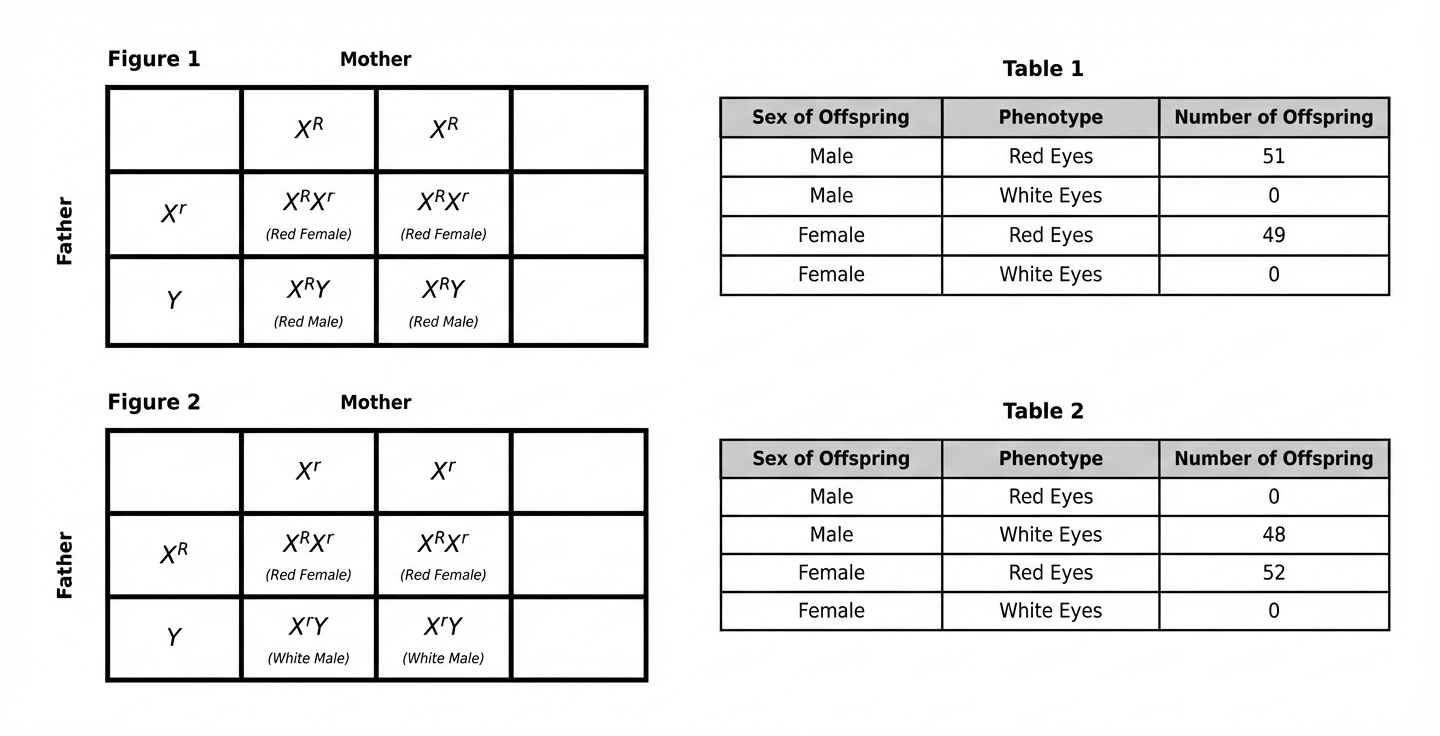
BIOLOGY / GENETICS: Research Summary
Introduction
Restriction enzymes are proteins that cut DNA molecules at specific, predictable sequences of base pairs (bp). Gel electrophoresis is a technique used to separate these resulting DNA fragments by size. When an electrical current is applied to the gel, the negatively charged DNA fragments migrate toward the positive electrode. Smaller DNA fragments move through the gel much faster and travel further than larger fragments.
A researcher isolated a circular bacterial plasmid (a ring of DNA) consisting of exactly 5,000 bp. To map the plasmid, the researcher treated identical samples of the plasmid with different restriction enzymes—Enzyme 1 (E1), Enzyme 2 (E2), and Enzyme 3 (E3)—both individually and in combinations.
After allowing the enzymes to cut the DNA, the researcher ran the samples on an electrophoresis gel. A dye was added to make the DNA bands visible. The size of the fragments in each band was recorded in Table 1.
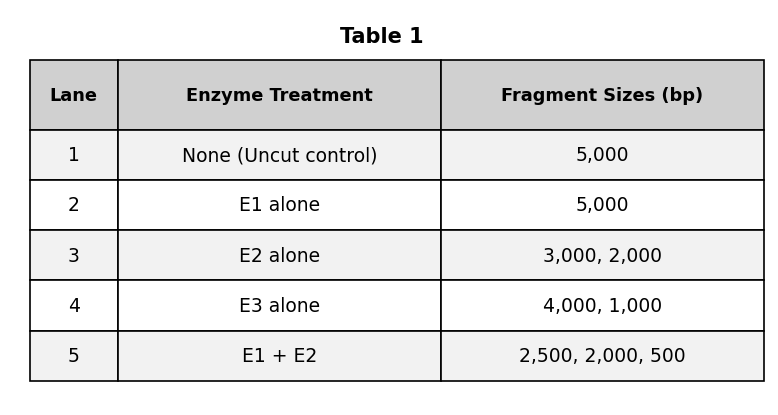
Based on the passage, which of the following fragments from Table 1 would migrate the furthest distance from the starting well during electrophoresis?
Based on the passage, which of the following fragments from Table 1 would migrate the furthest distance from the starting well during electrophoresis?