All questions
Question 1
PASSAGE I
CHEMISTRY: This passage is adapted from a study on the solubility of various substances in water.
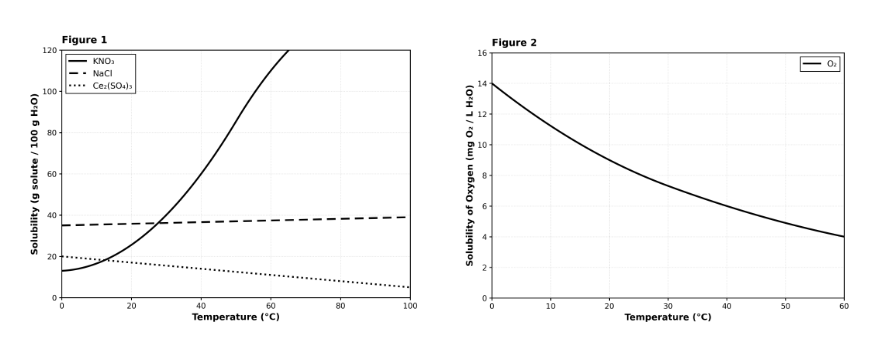
Solubility is defined as the maximum amount of a solute (substance being dissolved) that can dissolve in a specific amount of solvent (usually water) at a given temperature. The solubility of most solids increases with temperature, while the solubility of most gases decreases with temperature. A student performed an experiment to measure the solubility of three solid salts—Potassium Nitrate (KNO3), Sodium Chloride (NaCl), and Cerium(III) Sulfate (Ce2(SO4)3)—and one gas, Oxygen (O2).
A student dissolves 50 g of KNO₃ in 100 g of water at 40°C. Based on Figure 1, the resulting solution would be best described as:
- saturated, because 50 g is exactly the maximum solubility at 40°C.
- unsaturated, because 50 g is less than the maximum solubility of 60 g at 40°C. (correct answer)
- supersaturated, because 50 g is greater than the maximum solubility at 40°C.
- dilute, because KNO₃ is insoluble at 40°C.
Explanation: This is a concept application question requiring you to understand solubility definitions and apply them to graph data. According to Figure 1, KNO₃ has a solubility of approximately 60 g/100 g H₂O at 40°C. This means up to 60 g can dissolve at this temperature. Since the student only dissolved 50 g, which is less than the maximum of 60 g, more could still dissolve. By definition, this makes the solution unsaturated (not yet at maximum capacity). Choice B is correct. Choice A (saturated) would only be true if exactly 60 g were dissolved. Choice C (supersaturated) would require dissolving MORE than the maximum, which typically requires special cooling techniques. Choice D (dilute/insoluble) is nonsensical—the graph clearly shows KNO₃ does dissolve at 40°C. Pro tip: Saturated = at maximum; Unsaturated = below maximum; Supersaturated = above maximum (unstable).
Question 2
PASSAGE III
PHYSICS: This passage presents three hypotheses regarding the discrepancy between the observed mass of galaxies and their rotational speeds.
Introduction
In the 1970s, astronomer Vera Rubin observed that stars at the edges of spiral galaxies move just as fast as stars near the center. According to Newtonian physics, stars further from the center should move slower due to the decrease in gravitational pull. This observation implies that galaxies contain far more mass than what is visible in stars and gas. This missing mass is referred to as "Dark Matter." Three scientists propose different explanations for its nature.
Scientist 1
The missing mass consists of Weakly Interacting Massive Particles (WIMPs). These are subatomic particles that have mass but do not interact with electromagnetic radiation (light), making them invisible. WIMPs interact only through gravity and the weak nuclear force. They were produced in the early universe and now form a vast, spherical "halo" that surrounds every galaxy. Computer simulations of the universe's formation match observational data only when this "cold dark matter" is included. If WIMPs exist, they should eventually be detectable by sensitive underground experiments designed to catch rare collisions between WIMPs and atomic nuclei.
Scientist 2
The missing mass is not some exotic new particle; it is simply normal ("baryonic") matter that is too dim to see. These objects are called Massive Compact Halo Objects (MACHOs). They include black holes, neutron stars, brown dwarfs (failed stars), and rogue planets. Because they emit little to no light, they have escaped detection. The gravitational pull of these objects accounts for the high rotational speeds of galaxies. Evidence for MACHOs comes from "microlensing" events, where the gravity of a massive, invisible object bends the light of a distant star, causing it to brighten temporarily.
Scientist 3
There is no missing mass. The discrepancy is caused by a flaw in our understanding of gravity itself. This theory is known as Modified Newtonian Dynamics (MOND). Newtonian laws work well on the scale of our solar system, where accelerations are high. However, on the galactic scale, where accelerations are incredibly low (\<10−10m/s2), gravity behaves differently. Below this threshold, gravitational force decays more slowly with distance (1/r instead of 1/r2). This stronger effective gravity eliminates the need for invisible halos or new particles. The rotation curves are exactly what the laws of physics predict when corrected for this scale.
Suppose a new survey of the Milky Way's halo reveals a vast population of billions of rogue planets and brown dwarfs, totaling 5 times the mass of all visible stars. This finding would strictly support the hypothesis of:
- Scientist 1.
- Scientist 2. (correct answer)
- Scientist 3.
- both Scientist 1 and Scientist 3.
Explanation: This is a prediction/evidence evaluation question. Scientist 2 explicitly proposes that dark matter consists of MACHOs: "black holes, neutron stars, brown dwarfs (failed stars), and rogue planets." Finding billions of rogue planets and brown dwarfs would directly confirm Scientist 2's hypothesis. Choice B is correct. Choice A (Scientist 1) proposes WIMPs (exotic particles), not normal matter objects. Choice C (Scientist 3) rejects the existence of missing mass entirely. Choice D is illogical—Scientists 1 and 3 have opposing views. Pro tip: Match new evidence to the specific prediction each hypothesis makes.
Question 3
Ecologists investigated whether adding artificial nest boxes increases the number of breeding pairs of a bird species in urban parks. Four parks received 20 nest boxes each (Box parks) and four similar parks received none (No-box parks). Breeding pairs were counted in spring before installation (Year 0) and the next spring (Year 1). One Box park underwent tree removal between years.
Authors concluded: "Nest boxes caused the population increase observed in Year 1."
Which of the following is a flaw in the author's reasoning?
- They assume causation, but both groups increased; factors like year-to-year conditions could explain the change. (correct answer)
- They ignore that tree removal occurred, which must mean nest boxes reduced breeding in all Box parks.
- They fail to measure breeding pairs in Year 0, so no baseline exists for comparison.
- They used too many parks; a smaller sample would better isolate the effect of nest boxes.
Explanation: The flaw is that the authors assume causation when both groups increased, and other factors like year-to-year environmental conditions could explain the population changes. The data show both No-box parks (12→13 pairs) and Box parks (11→14 pairs) increased from Year 0 to Year 1, indicating favorable breeding conditions affected all parks. While Box parks had a slightly larger increase (3 vs 1 pair), this difference could result from natural population fluctuations, habitat quality differences, or the tree removal mentioned in one Box park. The lack of a true control group receiving no intervention prevents isolating the nest box effect from temporal confounding variables.
Question 4
Engineers evaluated whether a new tire tread (Tread N) improves braking distance on wet pavement. Ten cars of the same model were tested on a closed track. Each car performed two braking trials from 60 km/h: one with standard tires and one with Tread N. Testing occurred on two different days; Day 2 had heavier rainfall.
The authors concluded: "Tread N reduces wet braking distance under rainy conditions."
Which statement best evaluates the validity of the author's conclusion?
- Valid: Tread N has shorter mean braking distance than standard tires on both test days. (correct answer)
- Invalid: because rainfall differed by day, no comparison between tire types can be made within each day.
- Invalid: longer distances on Day 2 prove Tread N increases braking distance in heavy rain.
- Valid: Day 2 shows the largest distances, proving tread design is the only factor affecting braking.
Explanation: The conclusion is valid because Tread N consistently shows shorter mean braking distances than standard tires on both test days despite different weather conditions. On Day 1 (light rain), Tread N averaged 27.5m versus 29.0m for standard tires, and on Day 2 (heavy rain), it averaged 33.8m versus 34.5m for standard tires. While heavy rain increased stopping distances for both tire types, the consistent pattern across different conditions supports the claim that Tread N improves wet braking performance. The within-day comparisons control for environmental factors like rainfall intensity.
Question 5
A study examined whether listening to instrumental music improves memory recall. Forty students were assigned to either Music or Silence during a 15-minute study period. Students then completed a 30-word recall test. Researchers also recorded whether students reported being "well-rested" (≥7 hours sleep) or "tired" (<7 hours).
The authors concluded: "Instrumental music significantly improves memory recall for students."
The conclusion that the authors' claim is:
- Supported: the difference between well‑rested and tired groups confirms music improves recall by increasing alertness.
- Supported: a 1-word advantage in both groups proves music meaningfully improves recall for all students.
- Not supported: because tired students score lower, music must decrease recall by distracting them.
- Not supported: the data show sleep status has a much larger effect than music, and no significance is demonstrated. (correct answer)
Explanation: The claim is not supported because sleep status has a much larger effect on recall than music, and no statistical significance is demonstrated. The data show well-rested students recalled 7-8 more words than tired students (24-25 vs 17-18), while music provided only a 1-word advantage in each sleep group. This 1-word difference is minimal and could easily result from random variation rather than a meaningful effect. The authors cannot conclude 'significant improvement' without statistical testing, and the much larger sleep effect suggests individual factors outweigh any potential music benefit.
Question 6
A lab tested whether a disinfectant (Solution D) reduces bacterial growth on countertops. Identical countertop squares were inoculated with bacteria and then treated with either Solution D or water (Control). After 4 hours, technicians counted colony-forming units (CFU). The experiment was repeated at two room humidities.
Based on the data, which conclusion is most strongly supported?
- Solution D works only at low humidity, since CFU counts are higher at 70% RH than 30% RH.
- Solution D eliminates all bacteria regardless of humidity, proving complete sterilization within 4 hours.
- Humidity has no effect on CFU because Solution D lowers CFU under both humidity conditions.
- Solution D reduces CFU relative to water at both humidities tested, though humidity still affects overall CFU. (correct answer)
Explanation: Solution D reduces CFU relative to water control at both humidity levels tested, though humidity still affects overall bacterial survival. At 30% humidity, Solution D yields 150 CFU compared to 1,200 for Control (87.5% reduction), and at 70% humidity, it yields 260 CFU versus 2,100 for Control (87.6% reduction). The consistently large reductions demonstrate Solution D's effectiveness across humidity conditions. However, humidity clearly influences bacterial growth since both treatments show higher CFU at 70% than 30% humidity, indicating environmental factors interact with but don't eliminate the disinfectant's antimicrobial effect.
Question 7
Meteorologists examined whether a city's new reflective roof policy reduced summer electricity demand. Monthly mean daytime temperature and total electricity use were recorded for June–August in the year before the policy (Year A) and the year after (Year B). No other energy policies were reported, but Year B had a cooler summer.
The authors concluded: "Reflective roofs reduced summer electricity demand."
Which statement best evaluates the validity of the author's conclusion?
- Invalid: lower electricity use could be due to the cooler summer in Year B, a confounding variable. (correct answer)
- Valid: because electricity use dropped after the policy, the policy must be the primary cause.
- Valid: cooler temperatures prove reflective roofs worked by reducing city heat, lowering electricity demand.
- Invalid: electricity use is measured in GWh, so it cannot be compared across different years.
Explanation: The conclusion is invalid because the cooler summer temperatures in Year B (29.0°C vs 31.0°C) provide an alternative explanation for reduced electricity use (470 vs 520 GWh). Since air conditioning demand typically drives summer electricity consumption, the 2°C temperature difference could account for the 50 GWh reduction without any contribution from reflective roofs. The study lacks a control group and cannot separate the policy effect from the confounding variable of weather variation. Multiple factors influence electricity demand, making it impossible to attribute causation to the roof policy based on this observational data.
Question 8
PASSAGE V
Atmospheric Structure
Introduction
Earth's atmosphere is divided into four primary layers based on the way temperature changes with altitude. From lowest to highest, these layers are the troposphere, stratosphere, mesosphere, and thermosphere. The boundaries between these layers are known as "pauses" (e.g., the tropopause).
Researchers launched a series of weather balloons and sounding rockets to record the atmospheric pressure (in millibars, mb) and temperature (in °C) at various altitudes. The average data for a mid-latitude region is presented in Figure 1.
The relationship between atmospheric pressure and altitude is shown in Figure 2.
Atmospheric pressure is defined as the force exerted by the weight of the air above a given point. Based on Figure 2, which of the following statements best explains why atmospheric pressure decreases with altitude?
- Gravity increases as distance from the Earth's center increases.
- There is less air mass above a point at higher altitudes. (correct answer)
- The ozone layer in the stratosphere blocks solar radiation.
- The temperature decreases in the troposphere.
Explanation: This is a scientific reasoning question that combines a definition with data interpretation to explain a physical phenomenon. You can recognize this question type because the stem provides a definition ("Atmospheric pressure is defined as...") and then asks you to use that definition with the figure to explain a trend. The definition tells you pressure=weight of air above a point. If you go higher in altitude, there is literally less air above you (you've climbed through some of it), so the weight pressing down decreases. This explains why Figure 2 shows pressure dropping with altitude. Choice D focuses on temperature, but temperature doesn't directly explain pressure changes (they're related but not causal in this way). Choice C mentions the ozone layer, which is irrelevant to why pressure decreases. Choice A is factually wrong—gravity decreases (slightly) with altitude, not increases, and this wouldn't explain pressure drop anyway. Remember: When a question provides a definition, that definition contains the key to the answer—use it directly in your reasoning! Question 9
PASSAGE VII
PHYSICS: Research Summary
Introduction
When an object falls through a fluid (like air), it experiences a downward gravitational force (Fg) and an upward air resistance, or drag force (Fd). As the object's falling speed increases, Fd also increases. Eventually, Fd becomes exactly equal to Fg. At this point, the net force on the object is zero, and it stops accelerating, falling at a constant maximum speed known as terminal velocity (vt).
Students investigated terminal velocity by dropping standard paper coffee filters from a height of 5 meters.
Study 1
The students nested (stacked) different numbers of coffee filters (N) together. Nesting the filters increased the total mass (m) of the falling object without significantly changing its cross-sectional area. They dropped the nested filters and used a motion sensor to record the terminal velocity (vt) in meters per second (m/s). Findings are shown in Table 1.
Study 2
The students investigated how cross-sectional area (A) affects terminal velocity. They built 4 small parachutes of different cross-sectional areas. They attached a constant 10.0-gram mass to each parachute and dropped them from 5 meters, recording the vt. Findings are shown in Table 2.
At terminal velocity, the drag force on an object is exactly equal to the object's weight (gravitational force). Based on Study 1, what is the ratio of the drag force acting on N=2 filters at terminal velocity to the drag force acting on N=4 filters at terminal velocity?
- 1 : 1
- 1 : 2 (correct answer)
- 1 : 4
- 1.4 : 2.0
Explanation: The correct answer is B. At terminal velocity, Fd = Fg = weight. Weight is directly proportional to mass. From Study 1: N=2 has a mass of 2.0 g and N=4 has a mass of 4.0 g. Since N=4 has exactly twice the mass of N=2, it has exactly twice the weight, and therefore exactly twice the drag force at terminal velocity. The ratio of N=2 drag to N=4 drag is 2.0 g : 4.0 g = 1 : 2. B (1:1) would mean both objects have the same drag force — only possible if their masses were equal. C (1:4) would require N=4 to have four times the drag force, which would require four times the mass. D (1.4:2.0) confuses the terminal velocity values with the force ratio — terminal velocities do not directly equal forces. Pro tip: Force ratio questions at terminal velocity are solved entirely through mass ratios, not velocity ratios. Fd = weight = mg, so Fd ratios equal mass ratios.
Question 10
PASSAGE IV
CHEMISTRY: Research Summary
Introduction
Colligative properties are properties of a solution that depend on the ratio of the number of solute particles to the number of solvent molecules, and not on the identity of the solute. Two common colligative properties are freezing point depression (a lowering of the freezing point) and boiling point elevation (an increase in the boiling point).
At standard atmospheric pressure (1 atm), pure liquid water (H2O) has a freezing point of 0.00∘C and a boiling point of 100.00∘C. Students conducted two studies to investigate how adding different solutes to 1.00 kilogram (kg) of water affects these points.
Study 1
Sodium chloride (NaCl) is a salt that completely dissociates (breaks apart) into two separate ions (Na+ and Cl−) when dissolved in water. The students added varying amounts of NaCl, measured in moles (mol), to 1.00 kg of water. They measured the resulting freezing point and boiling point of the solutions. Measurements are shown in Table 1.
Study 2
The students wanted to see how the number of particles a molecule dissociates into (n) affects the freezing and boiling points. They gathered three different solutes:
•Sucrose (C12H22O11): Does not dissociate in water (n \= 1).
•Sodium chloride (NaCl): Dissociates into 2 ions (n \= 2).
•Magnesium chloride (MgCl2): Dissociates into 3 ions (Mg2+ and two Cl− ions) (n \= 3).
They added exactly 1.00 mole of each solute to separate beakers containing 1.00 kg of water and recorded the results. Findings are shown in Table 2.
According to the passage, why did adding 1.00 mole of sucrose have a smaller effect on the boiling point of the water than adding 1.00 mole of NaCl?
- Sucrose is a much heavier molecule than NaCl.
- Sucrose lowers the freezing point, which prevents the boiling point from changing.
- Sucrose does not dissociate into multiple particles when dissolved in water. (correct answer)
- Sucrose acts as a solvent rather than a solute.
Explanation: The correct answer is C. The introduction to Study 2 explicitly states that sucrose 'does not dissociate in water (n=1),' meaning one mole of sucrose produces only one mole of dissolved particles. NaCl dissociates into two ions (n=2), producing twice the number of particles per mole. Since colligative properties depend on the number of dissolved particles — not the identity of the solute — NaCl's greater particle count produces a greater effect on boiling point. A is wrong — molecular weight is irrelevant to colligative properties; the passage's introduction explicitly states this. B is wrong — freezing point depression and boiling point elevation are independent phenomena; one does not prevent the other. D is wrong — sucrose is the dissolved substance (solute), not the solvent. Pro tip: When a passage explicitly states a rule in its introduction, questions that ask 'why' are almost always answered by applying that rule directly.
Question 11
A survey recorded the number of hours students studied per week and their exam scores. Figure 2 shows a scatter plot of study hours versus exam scores. Which conclusion is most strongly supported by the data?
- More study hours correlate with higher exam scores. (correct answer)
- Study hours have no impact on scores.
- Studying more than 10 hours guarantees passing scores.
- Less than 5 hours of study leads to failure.
Explanation: More study hours correlate with higher exam scores according to the scatter plot data. The figure would show a positive relationship between hours studied per week and exam performance, with data points generally trending upward from left to right. This demonstrates a correlation where students who invest more time in studying tend to achieve better scores. Option C makes an absolute guarantee claim that goes beyond what correlation data can support.
Question 12
A gardener gave a new plant food to four seedlings, measured them on day 1 and again on day 30, and concluded that the plant food makes seedlings grow taller. Table 1 shows the measurements. No other seedlings were measured.
Why do the measurements in Table 1 fail to support the gardener's conclusion?
- No seedlings were grown without the plant food for comparison. (correct answer)
- The seedlings were measured only twice.
- The seedlings were not all the same height on day 1.
- Four seedlings is too few to measure.
Explanation: Seedlings grow on their own, so growing taller over 30 days is what they would do with or without the plant food. Without a group of untreated seedlings measured over the same 30 days, there is nothing to compare the treated growth against and the plant food cannot be credited. The small differences in starting height and the number of seedlings are minor next to having no comparison at all.
Question 13
A hydrology study measured nitrate concentration in a stream upstream and downstream of a farm. Samples were taken on three dates. Between Date 1 and Date 2, the farm applied fertilizer. Between Date 2 and Date 3, a large storm occurred.
Based on the data, which conclusion is most strongly supported?
- Downstream nitrate exceeds upstream on all dates, suggesting an added nitrate source between sampling locations. (correct answer)
- Fertilizer application definitively caused the Date 2 downstream increase, ruling out all other explanations.
- The storm caused downstream nitrate to drop below upstream, proving dilution eliminated farm impacts.
- Upstream nitrate is constant, so any downstream changes must be measurement error rather than real variation.
Explanation: Downstream nitrate consistently exceeds upstream concentrations on all three sampling dates (2.3 vs 2.1, 3.8 vs 2.0, and 2.9 vs 2.4 mg/L), suggesting a nitrate source exists between the two sampling locations. The pattern shows the largest downstream elevation on Date 2 following fertilizer application, which decreased after the storm on Date 3 but remained above upstream levels. While the temporal association with fertilizer application is suggestive, other sources like livestock operations, septic systems, or natural groundwater inputs could also contribute to the consistently higher downstream concentrations observed across all sampling periods.
Question 14
A biology class investigated whether a certain wavelength of light affects plant height. Students grew seedlings under either red LEDs or blue LEDs for 14 days. Each group used the same soil and watering schedule, but the red-LED shelf was closer to a window and received some additional sunlight.
The authors concluded: "Red light causes greater seedling growth than blue light."
Which statement best evaluates the validity of the author's conclusion?
- Valid: red LEDs always outperform blue LEDs for all plant species, as demonstrated by these results.
- Valid: because the same soil and watering were used, light color must be the only factor affecting height.
- Invalid: the data show blue LEDs increase height because 9.1 cm is closer to typical seedling height.
- Invalid: extra sunlight is a confounding variable, so the height difference cannot be attributed to LED color alone. (correct answer)
Explanation: The conclusion is invalid because additional sunlight exposure is a confounding variable that prevents attributing the height difference to LED color alone. While red-LED seedlings averaged 11.4 cm compared to 9.1 cm for blue-LED seedlings, the red-LED shelf was positioned closer to a window and received extra sunlight. This uncontrolled environmental factor could fully or partially account for the observed height difference. Proper experimental design requires controlling all variables except the one being tested, so the mixed lighting conditions make it impossible to isolate the effect of LED wavelength on plant growth.
Question 15
An astronomy team measured the brightness of a variable star over 6 nights using the same telescope. Brightness was recorded as apparent magnitude (lower magnitude = brighter). Cloud cover was noted each night.
The authors concluded: "The star dimmed on Nights 3 and 4 due to intrinsic stellar variability."
Which statement best evaluates the validity of the author's conclusion?
- Supported: cloud cover causes stars to brighten, so the dimming must be intrinsic to the star.
- Supported: because magnitude changed, the star must have intrinsically dimmed regardless of observing conditions.
- Not supported: low magnitude means dimmer, so the star was actually brightest on Nights 3 and 4.
- Not fully supported: increased cloud cover could make the star appear dimmer, providing an alternative explanation. (correct answer)
Explanation: The conclusion is not fully supported because increased cloud cover during Nights 3-4 could make the star appear dimmer, providing an alternative explanation for the higher magnitude readings. The data show that nights with 60-70% cloud cover correspond to magnitudes of 10.8-10.9 (dimmer), while nights with 5-15% cloud cover show magnitudes of 10.1-10.2 (brighter). Since clouds can attenuate starlight and reduce apparent brightness, the observed dimming could reflect atmospheric interference rather than intrinsic stellar variability. To establish true stellar dimming, observations would need to control for or correct for atmospheric conditions.
Question 16
A medical device company tested whether a new wristband reduces tremor amplitude in patients with essential tremor. Twelve patients wore the wristband for 1 hour on Day 1 (device OFF) and Day 2 (device ON). Tremor amplitude (arbitrary units) was measured during a standardized task. Day 2 measurements were always taken after Day 1.
The authors concluded: "The wristband reduces tremor amplitude."
Which statement best evaluates the validity of the author's conclusion?
- Supported: the data prove long‑term tremor reduction for all patients over months of use.
- Not supported: since amplitude is arbitrary units, it cannot be compared across days.
- Supported: any decrease from Day 1 to Day 2 must be caused by the device being turned on.
- Not fully supported: device ON is confounded with Day 2, so order effects could explain reduced tremor. (correct answer)
Explanation: The conclusion is not fully supported because the device ON condition is confounded with Day 2 testing, so practice effects or day-to-day variation could explain the reduced tremor amplitude. The data show lower mean tremor on Day 2 (device ON, 6.6 units) compared to Day 1 (device OFF, 8.0 units), but since device state always corresponded to test order, the improvement could result from patient familiarity with the standardized task or natural tremor fluctuation. Proper evaluation would require counterbalancing the order of device conditions across participants to separate treatment effects from temporal confounding factors.
Question 17
PASSAGE VII
Electrical Circuits
Introduction
A simple electric circuit consists of a power source (battery) and a resistor connected by wires. According to Ohm's Law, the current (I) flowing through a conductor is directly proportional to the voltage (V) and inversely proportional to the resistance (R):
I=RV
where I is measured in amperes (A), V in volts (V), and R in ohms (Ω).
Experiment
Students built a simple circuit using a variable resistor and a DC power supply, as shown in the diagram below.
They performed two trials.
Trial 1: They kept the voltage constant at 12 V and varied the resistance. The results are shown in Figure 1.
Trial 2: They kept the resistance constant at 100 Ω and varied the voltage. The results are shown in Figure 2.
Consider the data point in Figure 1 where the resistance is 24 Ω and the current is 0.5 A. Does this data point support the equation V=I×R if the voltage was held at 12 V?
- No, because the voltage was varied in this trial.
- Yes, because 0.5A/24Ω=12V.
- No, because the current should be 2.0 A.
- Yes, because 0.5A×24Ω=12V. (correct answer)
Explanation: This is an equation verification question that asks you to check whether experimental data supports a mathematical relationship. The key phrase "Does this data point support the equation" signals you should substitute the given values into the equation and see if it works. The equation is V=I×R. You're given R = 24 Ω and I = 0.5 A, and told that voltage was 12 V. Substituting: V=0.5A×24Ω=12V. Since this equals the stated voltage, the data point supports the equation. Choice B uses the wrong mathematical operation (division instead of multiplication). Choice C incorrectly calculates what current "should be"—if this were correct, it would give I=2.0A. Choice A is wrong because voltage was held constant (not varied) in Trial 1. Remember: For equation verification questions, carefully substitute the given values and do the arithmetic—these questions reward accuracy with the math! Question 18
PASSAGE I
Enzyme Activity
Introduction
Amylase is an enzyme that catalyzes the hydrolysis (breakdown) of starch into sugars. Its activity is influenced by environmental factors such as temperature and pH. Students conducted two studies to determine the optimal conditions for amylase activity in two different bacterial strains: Strain A and Strain B.
Study 1
Students measured the relative enzyme activity of both Strain A and Strain B at various temperatures ranging from 10°C to 70°C. In each trial, the pH was held constant at 7.0, and the incubation time was 10 minutes. The results are shown in Figure 1.
Study 2
Students measured the enzyme activity of both strains at four different pH levels (3, 5, 7, and 9). The temperature was held constant at 37°C for Strain A and 55°C for Strain B (their respective optimal temperatures from Study 1). Incubation time was 10 minutes. Activity was assessed by measuring the starch remaining after incubation; a lower amount of starch remaining indicates higher enzyme activity. The results are shown in Figure 2.
A scientist claims that Strain B enzymes are "thermophilic" (heat-loving) compared to Strain A enzymes. Do the results in Figure 1 support this claim?
- Yes; Strain B peaks at a higher temperature (55°C) than Strain A (37°C). (correct answer)
- Yes; Strain B has higher activity at all temperatures than Strain A.
- No; Strain A has higher activity at 37°C than Strain B does at 55°C.
- No; both strains have 0% activity at 70°C.
Explanation: This is a claim evaluation question that tests whether you can use data to support or refute a scientific statement. The key phrase "Do the results in Figure 1 support this claim?" signals that you need to check whether the data matches what the scientist is asserting. The term "thermophilic" means "heat-loving," so a thermophilic enzyme would have optimal activity at a higher temperature. To answer this, compare the optimal temperatures for both strains: Strain A peaks at 37°C, while Strain B peaks at 55°C. Since 55°C is significantly warmer than 37°C, Strain B is indeed more heat-loving, supporting the claim. Choice B is wrong because it makes a false claim—Strain B does not have higher activity at ALL temperatures; at 37°C, for example, Strain A is at 100% while Strain B is lower. Choice C is a trap that compares absolute peak heights rather than the temperatures at which peaks occur. Choice D is irrelevant—both having 0% at 70°C doesn't address which prefers warmer conditions. Remember: For "thermophilic" or temperature-preference questions, focus on WHERE the peak occurs on the temperature axis, not HOW HIGH the peak is!
Question 19
PASSAGE II
BIOLOGY: Research Summary
Introduction
Transpiration is the process by which moisture is carried through plants from roots to small pores on the underside of leaves, where it changes to vapor and is released to the atmosphere. A botanist conducted two studies to investigate how environmental factors affect the transpiration rate of Spathiphyllum (peace lily) plants.
Study 1
The botanist placed 5 identical Spathiphyllum plants into 5 identical environmentally controlled chambers. The relative humidity inside all chambers was kept constant at 40%, and the temperature was kept constant at 22°C. The botanist varied the light intensity—measured in micromoles of photons per square meter per second (μmol/m2/s)—in each chamber.
After 4 hours, the botanist measured the mass of water lost by each plant to calculate the transpiration rate in milligrams of water per square centimeter of leaf area per hour (mg/cm2/hr). Results are shown in Table 1.
Study 2
The botanist obtained 5 new, identical Spathiphyllum plants and placed them in the chambers. This time, the light intensity in all chambers was kept constant at 400 μmol/m2/s and the temperature at 22°C. The botanist varied the relative humidity in each chamber. The transpiration rates were calculated after 4 hours. Results are shown in Table 2.
Based on the data in both studies, which of the following combinations of light intensity and relative humidity would likely produce the highest overall transpiration rate for a Spathiphyllum plant?
- 0 μmol/m²/s and 100% relative humidity
- 0 μmol/m²/s and 20% relative humidity
- 800 μmol/m²/s and 100% relative humidity
- 800 μmol/m²/s and 20% relative humidity (correct answer)
Explanation: The correct answer is D. Study 1 shows that higher light intensity increases transpiration rate, with 800 μmol/m²/s producing the highest rate (6.3 mg/cm²/hr). Study 2 shows that lower relative humidity increases transpiration rate, with 20% humidity producing the highest rate (6.5 mg/cm²/hr). To maximize transpiration, both optimal conditions must be combined: 800 μmol/m²/s light AND 20% relative humidity. A combines the worst light intensity with the worst humidity — both minimize transpiration. B uses minimum light, which produces near-zero transpiration regardless of humidity. C uses optimal light but maximum humidity, which severely limits transpiration. Pro tip: Synthesis questions combining two studies require identifying the optimal value for each variable separately, then selecting the answer that combines both optima.
Question 20
PASSAGE VII
PHYSICS: Research Summary
Introduction
When an object falls through a fluid (like air), it experiences a downward gravitational force (Fg) and an upward air resistance, or drag force (Fd). As the object's falling speed increases, Fd also increases. Eventually, Fd becomes exactly equal to Fg. At this point, the net force on the object is zero, and it stops accelerating, falling at a constant maximum speed known as terminal velocity (vt).
Students investigated terminal velocity by dropping standard paper coffee filters from a height of 5 meters.
Study 1
The students nested (stacked) different numbers of coffee filters (N) together. Nesting the filters increased the total mass (m) of the falling object without significantly changing its cross-sectional area. They dropped the nested filters and used a motion sensor to record the terminal velocity (vt) in meters per second (m/s). Findings are shown in Table 1.
Study 2
The students investigated how cross-sectional area (A) affects terminal velocity. They built 4 small parachutes of different cross-sectional areas. They attached a constant 10.0-gram mass to each parachute and dropped them from 5 meters, recording the vt. Findings are shown in Table 2.
Based on the passage introduction, when Parachute X reaches its terminal velocity of 2.8 m/s, what is the relationship between the gravitational force (Fg) and the drag force (Fd)?
- Fg > Fd
- Fg < Fd
- Fg = Fd (correct answer)
- Fg and Fd both equal zero.
Explanation: The correct answer is C. The introduction explicitly states: 'Eventually, Fd becomes exactly equal to Fg. At this point, the net force on the object is zero, and it stops accelerating, falling at a constant maximum speed known as terminal velocity.' When Parachute X reaches terminal velocity (2.8 m/s), by definition, the two forces are exactly equal. A is wrong — if Fg > Fd, the net force would be downward and the object would still be accelerating, not at terminal velocity. B is wrong — if Fg < Fd, the net force would be upward, decelerating the object. D is wrong — both forces are acting (gravity always pulls downward; drag exists whenever the object is moving), but they are equal and opposite, producing zero net force. Pro tip: Questions that ask you to apply the passage's definition to a specific scenario require only reading the definition and substituting the given values. No calculation is needed.