GMAT Integrated Reasoning - GMAT Data Insights
Card 0 of 88
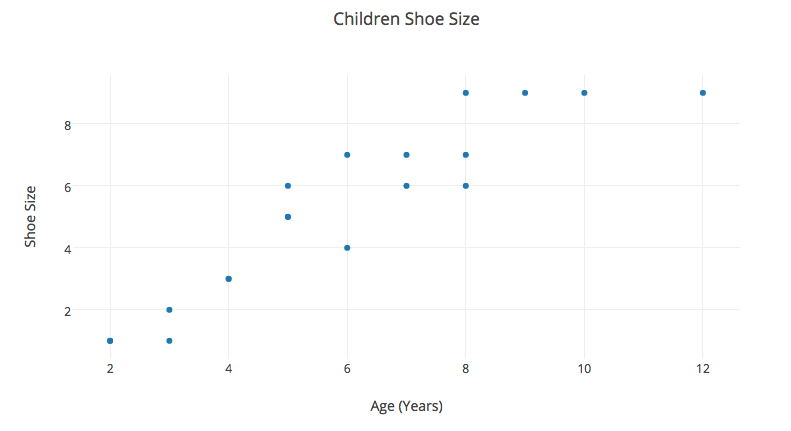
The graph above plots sixteen points that each describe the shoe size of sixteen individual children.
Identify the missing information of the following statement.
The relationship between the age of the child and the child's shoe size is .
The graph above plots sixteen points that each describe the shoe size of sixteen individual children.
Identify the missing information of the following statement.
The relationship between the age of the child and the child's shoe size is .
Looking at the graph, first identify the points.
There are sixteen points: (2,1), (3,1), (3,2), (4,3), (5,5), (5,6), (6,4), (6, 7), (7,6), (7,7), (8,6), (8,7), (8,9), (9,9), (10,9), (12,9)
The line of best fit can be drawn on the image and it would have a positive slope.
It is seen that as the age of the children increases that the shoe size also increases.
Therefore there is a positive relationship between the child's age and shoe size.
Compare your answer with the correct one above
The graph above plots sixteen points that each describe the shoe size of sixteen individual children.
Identify the missing information of the following statement.
The relationship between the age of the child and the child's shoe size is .
The graph above plots sixteen points that each describe the shoe size of sixteen individual children.
Identify the missing information of the following statement.
The relationship between the age of the child and the child's shoe size is .
Looking at the graph, first identify the points.
There are sixteen points: (2,1), (3,1), (3,2), (4,3), (5,5), (5,6), (6,4), (6, 7), (7,6), (7,7), (8,6), (8,7), (8,9), (9,9), (10,9), (12,9)
The line of best fit can be drawn on the image and it would have a positive slope.
It is seen that as the age of the children increases that the shoe size also increases.
Therefore there is a positive relationship between the child's age and shoe size.
Compare your answer with the correct one above
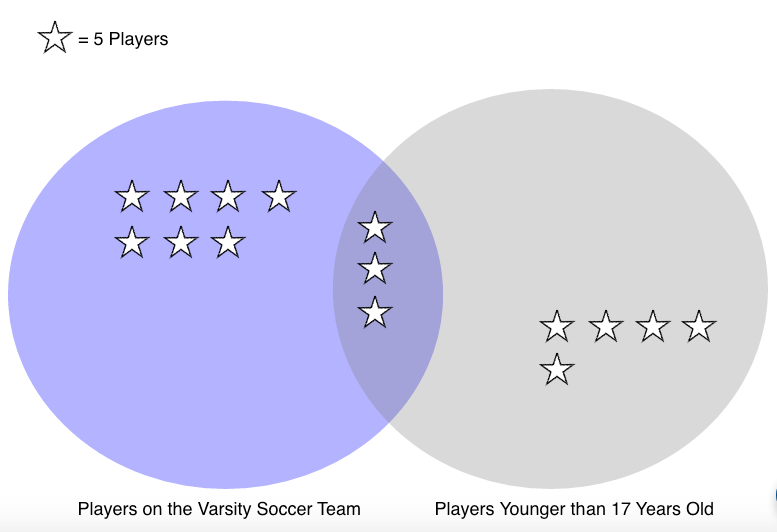
Refer to the pictograph that describes all of the students who play soccer at Douglas High School. Each star represents 5 students from a sample of 75 total students.
Identify the missing information in the following statements using the pictograph.
I. If one student is selected at random from the 75, the chance that the student will be older than 17 or on the Varsity team, or both is .
II. If one student is selected at random from the 75, the chance that the students is both younger than 17 and on the Varsity Soccer Team is .
To identify the missing information in the following statements use the pictograph.
I. If one student is selected at random from the 75, the chance that the student will be older than 17 or on the Varsity team, or both is .
To find the probability of choosing a student that is either older than 17, or on the Varsity team, or both can be written mathematically as follows.
+P(<17\cap VT) \35+15 \50")
To find the ratio divide the number found above by the total number of students.

In words this is 2 out of 3.
II. If one student is selected at random from the 75, the chance that the students is both younger than 17 and on the Varsity Soccer Team is .
In mathematical terms this is written as the following,
 \15")
To find the ratio divide the number found above by the total number of students.

In words this is 1 out of 5.
To identify the missing information in the following statements use the pictograph.
I. If one student is selected at random from the 75, the chance that the student will be older than 17 or on the Varsity team, or both is .
To find the probability of choosing a student that is either older than 17, or on the Varsity team, or both can be written mathematically as follows.
To find the ratio divide the number found above by the total number of students.
In words this is 2 out of 3.
II. If one student is selected at random from the 75, the chance that the students is both younger than 17 and on the Varsity Soccer Team is .
In mathematical terms this is written as the following,
To find the ratio divide the number found above by the total number of students.
In words this is 1 out of 5.
Compare your answer with the correct one above
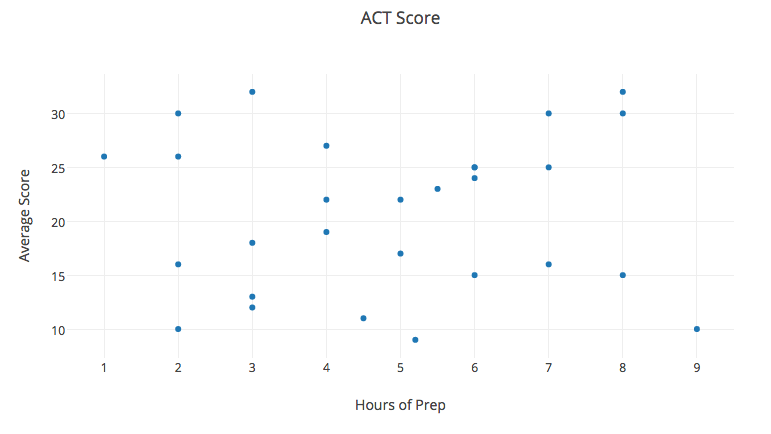
The graph depicts the hours prep time for students who took the ACT test and their corresponding average score.
Identify the missing information for the following statements using the graph.
I. The relationship between study time and test scores is .
II. The slope of the regression line is .
The graph depicts the hours prep time for students who took the ACT test and their corresponding average score.
Identify the missing information for the following statements using the graph.
I. The relationship between study time and test scores is .
II. The slope of the regression line is .
To identify the missing information for the following statements use the graph.
I. The relationship between study time and test scores is .
Since the scatterplot shows no clear trend, the relationship between the study time and the test score is zero.
II. The slope of the regression line is .
Since there is no relationship between the study time and the average test score, a regression line in non-applicable.
Compare your answer with the correct one above
The table displays the academic class spread among Dawn County schools in 2005.

Based on the given information in the table, select the options that can be proven to be true.
I. No class is offered in less than one-third of the schools.
II. Every school in the district offers either Gym or at least one Art class (Painting or Sculpting).
III. Math is an academic class that is offered in all schools in Dawn County.
The table displays the academic class spread among Dawn County schools in 2005.
Based on the given information in the table, select the options that can be proven to be true.
I. No class is offered in less than one-third of the schools.
II. Every school in the district offers either Gym or at least one Art class (Painting or Sculpting).
III. Math is an academic class that is offered in all schools in Dawn County.
Examining the table given, the truth of the statements can be identified.
Looking at option I. No class is offered in less than one-third of the schools.
It is seen that Sculpting is offered in 13% of the schools which is less than 33% therefore sculpting is offered in less than one-third of the schools thus making the statement false.
Looking at option II. Every school in the district offers either Gym or an Art class.
The table states that 5 schools offer Gym and a total of three schools offer Art (Painting or Sculpting). This makes a total of 8 schools but it is unknown if there are 8 different school or if the 5 schools that have gym also have an art class. Therefore this statement is false.
Looking at option III. Math is an academic class that all schools in Dawn County offer.
The table shows that the % of schools offering Math is 100% therefore this statement is true.
Compare your answer with the correct one above
Refer to the pictograph that describes all of the students who play soccer at Douglas High School. Each star represents 5 students from a sample of 75 total students.
Identify the missing information in the following statements using the pictograph.
I. If one student is selected at random from the 75, the chance that the student will be older than 17 or on the Varsity team, or both is .
II. If one student is selected at random from the 75, the chance that the students is both younger than 17 and on the Varsity Soccer Team is .
To identify the missing information in the following statements use the pictograph.
I. If one student is selected at random from the 75, the chance that the student will be older than 17 or on the Varsity team, or both is .
To find the probability of choosing a student that is either older than 17, or on the Varsity team, or both can be written mathematically as follows.
To find the ratio divide the number found above by the total number of students.
In words this is 2 out of 3.
II. If one student is selected at random from the 75, the chance that the students is both younger than 17 and on the Varsity Soccer Team is .
In mathematical terms this is written as the following,
To find the ratio divide the number found above by the total number of students.
In words this is 1 out of 5.
Compare your answer with the correct one above
The graph depicts the hours prep time for students who took the ACT test and their corresponding average score.
Identify the missing information for the following statements using the graph.
I. The relationship between study time and test scores is .
II. The slope of the regression line is .
The graph depicts the hours prep time for students who took the ACT test and their corresponding average score.
Identify the missing information for the following statements using the graph.
I. The relationship between study time and test scores is .
II. The slope of the regression line is .
To identify the missing information for the following statements use the graph.
I. The relationship between study time and test scores is .
Since the scatterplot shows no clear trend, the relationship between the study time and the test score is zero.
II. The slope of the regression line is .
Since there is no relationship between the study time and the average test score, a regression line in non-applicable.
Compare your answer with the correct one above
Over a seven-year period, from 2002 to 2009, the number of babies born to married couples increased despite a decrease in marriages from 17,000 marriages in 2002.
In the given expression,  and
and  represent the percent change in the babies and marriages, respectively.
  represents the number of babies per married couple in 2002. The percent change in a quantity is calculated by the formula:

Identify the following with the given information,
I. The expression that represents the number of babies born in 2002.
II. The expression of the number of babies born per family in 2009.
Over a seven-year period, from 2002 to 2009, the number of babies born to married couples increased despite a decrease in marriages from 17,000 marriages in 2002.
In the given expression,
Identify the following with the given information,
I. The expression that represents the number of babies born in 2002.
II. The expression of the number of babies born per family in 2009.
To identify,
I. The expression that represents the number of babies born in 2002.
Recall the given information in this particular question.
It is known that in 2002 there are 17,000 marriages and  represents
  .
.
Using this information to create a mathematical expression is as follows.

Now to identify,
II. The expression of the number of babies born per married couple in 2009.
Use the formula given

This part of the problem is asking for a ratio, but the variables that are given are percents.
Therefore, the 100’s are there because M and B are percent quantitie_s._ They are both added because M is a negative number.
So the number in the numerator is the percentage of babies that exist in 2009 compared to 2002 (a number that will be less than 100). The denominator is the percentage of the 2002 marriages that exists in 2009 (a number greater than 100).
Thus the solution is,
\times I")
To identify,
I. The expression that represents the number of babies born in 2002.
Recall the given information in this particular question.
It is known that in 2002 there are 17,000 marriages and
Using this information to create a mathematical expression is as follows.
Now to identify,
II. The expression of the number of babies born per married couple in 2009.
Use the formula given
This part of the problem is asking for a ratio, but the variables that are given are percents.
Therefore, the 100’s are there because M and B are percent quantitie_s._ They are both added because M is a negative number.
So the number in the numerator is the percentage of babies that exist in 2009 compared to 2002 (a number that will be less than 100). The denominator is the percentage of the 2002 marriages that exists in 2009 (a number greater than 100).
Thus the solution is,
Compare your answer with the correct one above
A high-school music department is putting together a two-day music festival to highlight the students' talents. The schedule for the two days will adhere to the following rules:
1. Five musical performances are scheduled for each day.
2. The majority of the performances on one of the days will be composed of woodwind instruments (clarinets, flutes, saxophones, oboes, or bassoons)
3. The other day will primarily feature solo performances.
Currently, 8 of the performances (4 each day) have been scheduled. The music department must add one additional performance on each day:
Day 1
Smooth Jazz Group (10th Grade, Saxophone Trio)
Rock Your Socks Off (12th Grade, Vocal Group)
Dustin & Karen (11th Grade, Flute Duo)
James (11th Grade, Trumpet Solo)
Day 2
Adam (10th Grade, Vocal Solo)
John (11th Grade, Clarinet Solo)
Rachel (12th Grade, Brass Solo)
4 Blind Mice (9th Grade, Woodwind Quartet)
The music department must add one additional performance on each day.
Based on the rules above, identify a performance that following:
I. A performance that can be scheduled on either day.
II. A performance that cannot be scheduled on either day.
Recall the criteria for this particular problem.
Five musicians are scheduled to play each day. To feature the departments strengths, the majority of the musicians on one of the days will be composed of woodwind instruments (clarinets, flutes, saxophones, oboes, bassoons) and the other day will be primarily solo musicians.
Looking at day one it is clear that represents the woodwind day and day two represents the solo day.
Therefore, for someone to be able to play either day that student must play a woodwind instrument and be doing a solo. For a musician(s) to play neither day it must be a group that is composed of instruments other than woodwind.
Also recall that violins are string instruments, trumpets are brass instruments, and vocal is ones voice.
Keeping all of this in mind, the correct answer is,
I. Susan (12th Grade, Flute Solo)
II. James & Jimmy (10th Grade, Vocal Duo)
Compare your answer with the correct one above
Over a seven-year period, from 2002 to 2009, the number of babies born to married couples increased despite a decrease in marriages from 17,000 marriages in 2002.
In the given expression, and represent the percent change in the babies and marriages, respectively. represents the number of babies per married couple in 2002. The percent change in a quantity is calculated by the formula:
Identify the following with the given information,
I. The expression that represents the number of babies born in 2002.
II. The expression of the number of babies born per family in 2009.
Over a seven-year period, from 2002 to 2009, the number of babies born to married couples increased despite a decrease in marriages from 17,000 marriages in 2002.
In the given expression,
Identify the following with the given information,
I. The expression that represents the number of babies born in 2002.
II. The expression of the number of babies born per family in 2009.
To identify,
I. The expression that represents the number of babies born in 2002.
Recall the given information in this particular question.
It is known that in 2002 there are 17,000 marriages and represents .
Using this information to create a mathematical expression is as follows.
Now to identify,
II. The expression of the number of babies born per married couple in 2009.
Use the formula given
This part of the problem is asking for a ratio, but the variables that are given are percents.
Therefore, the 100’s are there because M and B are percent quantitie_s._ They are both added because M is a negative number.
So the number in the numerator is the percentage of babies that exist in 2009 compared to 2002 (a number that will be less than 100). The denominator is the percentage of the 2002 marriages that exists in 2009 (a number greater than 100).
Thus the solution is,
To identify,
I. The expression that represents the number of babies born in 2002.
Recall the given information in this particular question.
It is known that in 2002 there are 17,000 marriages and
Using this information to create a mathematical expression is as follows.
Now to identify,
II. The expression of the number of babies born per married couple in 2009.
Use the formula given
This part of the problem is asking for a ratio, but the variables that are given are percents.
Therefore, the 100’s are there because M and B are percent quantitie_s._ They are both added because M is a negative number.
So the number in the numerator is the percentage of babies that exist in 2009 compared to 2002 (a number that will be less than 100). The denominator is the percentage of the 2002 marriages that exists in 2009 (a number greater than 100).
Thus the solution is,
Compare your answer with the correct one above
A high-school music department is putting together a two-day music festival to highlight the students' talents. The schedule for the two days will adhere to the following rules:
1. Five musical performances are scheduled for each day.
2. The majority of the performances on one of the days will be composed of woodwind instruments (clarinets, flutes, saxophones, oboes, or bassoons)
3. The other day will primarily feature solo performances.
Currently, 8 of the performances (4 each day) have been scheduled. The music department must add one additional performance on each day:
Day 1
Smooth Jazz Group (10th Grade, Saxophone Trio)
Rock Your Socks Off (12th Grade, Vocal Group)
Dustin & Karen (11th Grade, Flute Duo)
James (11th Grade, Trumpet Solo)
Day 2
Adam (10th Grade, Vocal Solo)
John (11th Grade, Clarinet Solo)
Rachel (12th Grade, Brass Solo)
4 Blind Mice (9th Grade, Woodwind Quartet)
The music department must add one additional performance on each day.
Based on the rules above, identify a performance that following:
I. A performance that can be scheduled on either day.
II. A performance that cannot be scheduled on either day.
A high-school music department is putting together a two-day music festival to highlight the students' talents. The schedule for the two days will adhere to the following rules:
1. Five musical performances are scheduled for each day.
2. The majority of the performances on one of the days will be composed of woodwind instruments (clarinets, flutes, saxophones, oboes, or bassoons)
3. The other day will primarily feature solo performances.
Currently, 8 of the performances (4 each day) have been scheduled. The music department must add one additional performance on each day:
Day 1
Smooth Jazz Group (10th Grade, Saxophone Trio)
Rock Your Socks Off (12th Grade, Vocal Group)
Dustin & Karen (11th Grade, Flute Duo)
James (11th Grade, Trumpet Solo)
Day 2
Adam (10th Grade, Vocal Solo)
John (11th Grade, Clarinet Solo)
Rachel (12th Grade, Brass Solo)
4 Blind Mice (9th Grade, Woodwind Quartet)
The music department must add one additional performance on each day.
Based on the rules above, identify a performance that following:
I. A performance that can be scheduled on either day.
II. A performance that cannot be scheduled on either day.
Recall the criteria for this particular problem.
Five musicians are scheduled to play each day. To feature the departments strengths, the majority of the musicians on one of the days will be composed of woodwind instruments (clarinets, flutes, saxophones, oboes, bassoons) and the other day will be primarily solo musicians.
Looking at day one it is clear that represents the woodwind day and day two represents the solo day.
Therefore, for someone to be able to play either day that student must play a woodwind instrument and be doing a solo. For a musician(s) to play neither day it must be a group that is composed of instruments other than woodwind.
Also recall that violins are string instruments, trumpets are brass instruments, and vocal is ones voice.
Keeping all of this in mind, the correct answer is,
I. Susan (12th Grade, Flute Solo)
II. James & Jimmy (10th Grade, Vocal Duo)
Recall the criteria for this particular problem.
Five musicians are scheduled to play each day. To feature the departments strengths, the majority of the musicians on one of the days will be composed of woodwind instruments (clarinets, flutes, saxophones, oboes, bassoons) and the other day will be primarily solo musicians.
Looking at day one it is clear that represents the woodwind day and day two represents the solo day.
Therefore, for someone to be able to play either day that student must play a woodwind instrument and be doing a solo. For a musician(s) to play neither day it must be a group that is composed of instruments other than woodwind.
Also recall that violins are string instruments, trumpets are brass instruments, and vocal is ones voice.
Keeping all of this in mind, the correct answer is,
I. Susan (12th Grade, Flute Solo)
II. James & Jimmy (10th Grade, Vocal Duo)
Compare your answer with the correct one above
A Shark XI is a new model remote aircraft. Under ideal flying conditions the Shark XI's fuel is  nautical miles per liter
 ") when flying speed is constant at
when flying speed is constant at  nautical miles per hour
  \right )") where knots is the abbreviation for nautical miles per hour.
where knots is the abbreviation for nautical miles per hour.
Identify the following statements in terms of  and
and  .
.
I. Liters of fuel in one hour.
II. Liters of fuel in 80 nautical miles.
A Shark XI is a new model remote aircraft. Under ideal flying conditions the Shark XI's fuel is
Identify the following statements in terms of
I. Liters of fuel in one hour.
II. Liters of fuel in 80 nautical miles.
To identify,
I. Liters of fuel in one hour.
Recall the given information,
A Shark XI is a new model remote aircraft. Under ideal flying conditions the Shark XI's fuel is  nautical miles per liter
 ") when flying speed is constant at
when flying speed is constant at  nautical miles per hour
  \right )") where knots is the abbreviation for nautical miles per hour.
where knots is the abbreviation for nautical miles per hour.

To get liters per hour:

the nautical miles cancel out and the solution is

II. Liters of fuel in 80 nautical miles.

Now solving for liters results in the correct answer,

To identify,
I. Liters of fuel in one hour.
Recall the given information,
A Shark XI is a new model remote aircraft. Under ideal flying conditions the Shark XI's fuel is
To get liters per hour:
the nautical miles cancel out and the solution is
II. Liters of fuel in 80 nautical miles.
Now solving for liters results in the correct answer,
Compare your answer with the correct one above
The table displays the academic class spread among Dawn County schools in 2005.

Based on the given information in the table, select the options that can be proven to be true.
I. No class is offered in less than one-third of the schools.
II. Every school in the district offers either Gym or at least one Art class (Painting or Sculpting).
III. Math is an academic class that is offered in all schools in Dawn County.
The table displays the academic class spread among Dawn County schools in 2005.
Based on the given information in the table, select the options that can be proven to be true.
I. No class is offered in less than one-third of the schools.
II. Every school in the district offers either Gym or at least one Art class (Painting or Sculpting).
III. Math is an academic class that is offered in all schools in Dawn County.
Examining the table given, the truth of the statements can be identified.

Looking at option I. No class is offered in less than one-third of the schools.
It is seen that Sculpting is offered in 13% of the schools which is less than 33% therefore sculpting is offered in less than one-third of the schools thus making the statement false.
Looking at option II. Every school in the district offers either Gym or an Art class.
The table states that 5 schools offer Gym and a total of three schools offer Art (Painting or Sculpting). This makes a total of 8 schools but it is unknown if there are 8 different school or if the 5 schools that have gym also have an art class. Therefore this statement is false.
Looking at option III. Math is an academic class that all schools in Dawn County offer.
The table shows that the % of schools offering Math is 100% therefore this statement is true.
Examining the table given, the truth of the statements can be identified.
Looking at option I. No class is offered in less than one-third of the schools.
It is seen that Sculpting is offered in 13% of the schools which is less than 33% therefore sculpting is offered in less than one-third of the schools thus making the statement false.
Looking at option II. Every school in the district offers either Gym or an Art class.
The table states that 5 schools offer Gym and a total of three schools offer Art (Painting or Sculpting). This makes a total of 8 schools but it is unknown if there are 8 different school or if the 5 schools that have gym also have an art class. Therefore this statement is false.
Looking at option III. Math is an academic class that all schools in Dawn County offer.
The table shows that the % of schools offering Math is 100% therefore this statement is true.
Compare your answer with the correct one above

The table above give information for 2013 on the total passengers for 5 train stations in the western United States. These stations were chosen because in 2013 they were among the most popular. The table also includes the percent increase and decrease from the precious year.
Consider the following statements and determine whether the statements are true or false based on the information provided by the table.
I. The percent of change in the passenger count from 2012 created the rank identifier for 2013.
II. The train station that has the median number of passengers also has the median rank.
III. Over 50 percent of the stations that experienced a percentage increase are in the state of Utah.
Examining the table conclusions can be made on each of the statements.

Looking at option I. The percent of change in the passenger count from 2012 created the rank identifier for 2013.
Looking at the ranks, it is seen that rank 2 which is the highest given, belongs to Reno. Reno's station also had a percent decrease from the previous year. Therefore making this statement false.
Looking at option II. The train station that has the median passengers also has the median rank.
If the passenger counts were reorganized from lowest to highest is would look as follows,

The ranks if ordered in this same way would be as follows,

Since there are five entries, the median occurs at the third entry which would be passenger count 1014 and rank 6. Both of these belong to the train station at Glenwood Springs. Therefore making this statement true.
Looking at option III. Over 50 percent of the stations that experienced a percentage increase are in the state of Utah.
The stations that experienced a percentage increase belong to Glenwood Springs, Salt Lake City, and Sacramento. Glenwood Springs is a city in Colorado, Salt Lake City is a city in Utah, and Sacramento is a city in California. Only one station is in Utah therefore making this statement false.
Examining the table conclusions can be made on each of the statements.
Looking at option I. The percent of change in the passenger count from 2012 created the rank identifier for 2013.
Looking at the ranks, it is seen that rank 2 which is the highest given, belongs to Reno. Reno's station also had a percent decrease from the previous year. Therefore making this statement false.
Looking at option II. The train station that has the median passengers also has the median rank.
If the passenger counts were reorganized from lowest to highest is would look as follows,
The ranks if ordered in this same way would be as follows,
Since there are five entries, the median occurs at the third entry which would be passenger count 1014 and rank 6. Both of these belong to the train station at Glenwood Springs. Therefore making this statement true.
Looking at option III. Over 50 percent of the stations that experienced a percentage increase are in the state of Utah.
The stations that experienced a percentage increase belong to Glenwood Springs, Salt Lake City, and Sacramento. Glenwood Springs is a city in Colorado, Salt Lake City is a city in Utah, and Sacramento is a city in California. Only one station is in Utah therefore making this statement false.
Compare your answer with the correct one above
The table above give information for 2013 on the total passengers for 5 train stations in the western United States. These stations were chosen because in 2013 they were among the most popular. The table also includes the percent increase and decrease from the precious year.
Consider the following statements and determine whether the statements are true or false based on the information provided by the table.
I. The percent of change in the passenger count from 2012 created the rank identifier for 2013.
II. The train station that has the median number of passengers also has the median rank.
III. Over 50 percent of the stations that experienced a percentage increase are in the state of Utah.
Examining the table conclusions can be made on each of the statements.
Looking at option I. The percent of change in the passenger count from 2012 created the rank identifier for 2013.
Looking at the ranks, it is seen that rank 2 which is the highest given, belongs to Reno. Reno's station also had a percent decrease from the previous year. Therefore making this statement false.
Looking at option II. The train station that has the median passengers also has the median rank.
If the passenger counts were reorganized from lowest to highest is would look as follows,
The ranks if ordered in this same way would be as follows,
Since there are five entries, the median occurs at the third entry which would be passenger count 1014 and rank 6. Both of these belong to the train station at Glenwood Springs. Therefore making this statement true.
Looking at option III. Over 50 percent of the stations that experienced a percentage increase are in the state of Utah.
The stations that experienced a percentage increase belong to Glenwood Springs, Salt Lake City, and Sacramento. Glenwood Springs is a city in Colorado, Salt Lake City is a city in Utah, and Sacramento is a city in California. Only one station is in Utah therefore making this statement false.
Compare your answer with the correct one above
The table displays the academic class spread among Dawn County schools in 2005.

Based on the given information in the table, select the options that can be proven to be true.
I. At least half the school's in Dawn County support advanced placement courses.
II. The majority of schools's in Dawn County participate in offering a type of foreign language to their students.
III. The core subjects such as English and Math enroll the majority of students.
The table displays the academic class spread among Dawn County schools in 2005.
Based on the given information in the table, select the options that can be proven to be true.
I. At least half the school's in Dawn County support advanced placement courses.
II. The majority of schools's in Dawn County participate in offering a type of foreign language to their students.
III. The core subjects such as English and Math enroll the majority of students.
Examining the table given, the truth of the statements can be identified.

Looking at option I. At least half the school's in Dawn County support advanced placement courses,
advanced placement courses at AP Calculus and AP English. Since 50% of schools offer each this statement is true.
Looking at option II. The majority of schools's in Dawn County participate in offering a type of foreign language to their students,
the foreign languages are French, Latin, German, and Spanish. French, German, and Spanish are offered in 4 school which is half the schools however, it is not known if they are offered in the same four schools or in different schools. Latin is offered in three schools and again, it is not known if it is offered in the same or different schools as the other foreign languages. Therefore, this statement is false.
Looking at option III. The core subjects such as English and Math enroll the majority of students,
the majority of students will need to be over 50% of the students. Since Math has 100% student enrollment and English has 75% then, the majority of students are enrolled in core subjects. Therefore this statement is true.
Examining the table given, the truth of the statements can be identified.
Looking at option I. At least half the school's in Dawn County support advanced placement courses,
advanced placement courses at AP Calculus and AP English. Since 50% of schools offer each this statement is true.
Looking at option II. The majority of schools's in Dawn County participate in offering a type of foreign language to their students,
the foreign languages are French, Latin, German, and Spanish. French, German, and Spanish are offered in 4 school which is half the schools however, it is not known if they are offered in the same four schools or in different schools. Latin is offered in three schools and again, it is not known if it is offered in the same or different schools as the other foreign languages. Therefore, this statement is false.
Looking at option III. The core subjects such as English and Math enroll the majority of students,
the majority of students will need to be over 50% of the students. Since Math has 100% student enrollment and English has 75% then, the majority of students are enrolled in core subjects. Therefore this statement is true.
Compare your answer with the correct one above
Email #1
Email from wedding coordinator to bride and groom
February 12, at 10:13am
"The final headcount for booking the pavilion for the reception is today. Right now we have a rough estimate of 425 people. Is this still true and if so, do we know how many people will be having the chicken dinner?"
Email #2
Email from the bride to the wedding coordinator
February 12, at 10:27am
"We are still waiting on 40 invitations to RSVP; we gave a deadline of February 15. Is there a possibility for an extension to the 15th? Of the current 425 guests 375 have opted for the chicken dinner."
Email #3
Email from the wedding coordinator to the bride
February 12, at 11:02am
"I will reach out to the pavilion to see if an extension is possible and get back to you this afternoon. We can always assume for more since the pavilion does offer a refund if any changes are made at least one week prior to the wedding."
Based on the given information in the emails, determine whether the statements are justified.
I. The wedding coordinator is not willing to extend the guest headcount deadline.
II. The bride does not have a specific, expected date to receive RSVPs.
III. The wedding coordinator gives additional options to the bride in case the pavilion will not give an extension.
To determine which statements are justified, look at the information given in the emails.
For statement I. The wedding coordinator is not willing to extend the guest headcount deadline. Look at the bold statement in email #3,
Email from the wedding coordinator to the bride
February 12, at 11:02am
I will reach out to the pavilion to see if an extension is possible and get back to you this afternoon. We can always assume for more since the pavilion does offer a refund if any chances are made at least one week prior to the wedding.
Therefore, the wedding coordinator is willing to extend the guest count if at all possible. Thus, this statement is not justified.
For statement II. The bride does not have a specific, expected date to receive RSVPs. Look at the bold statement in email #2,
Email from the bride to the wedding coordinator
February 12, at 10:27am
We are still waiting on 40 invitations to RSVP; we gave a deadline of February 15. Is there a possibility for an extension to the 15th? Of the current 425 guests 375 have opted for the chicken dinner.
Therefore, the bride does give a deadline for the RSVPs. Thus, this statement is not justified.
For statement III. The wedding coordinator gives additional options to the bride in case the pavilion will not give an extension. Look at the bold statement in email #3,
Email from the wedding coordinator to the bride
February 12, at 11:02am
I will reach out to the pavilion to see if an extension is possible and get back to you this afternoon. We can always assume for more since the pavilion does offer a refund if any changes are made at least one week prior to the wedding.
Since the wedding coordinator gives additional options to the bride, the statement is justified.
Compare your answer with the correct one above
Techniques
At a gym there are three different paths an individual can take to obtaining membership. The first option is personal training. The second option is group fitness classes and the last option is individual direction. Members are only allowed to partake in individual direction after 5 personal training sessions and 10 group fitness classes.
Personnel
For personal training, there must be one trainer per individual. For group fitness classes there must be one trainer per eight individuals. For individual direction, no trainer is required; however, only 25 members can partake in individual direction at a time. At this particular gym there are 12 trainers.
Price
The price of membership depends on the technique the individual chooses. Personal training costs between $40 and $75 per session, depending on the trainer. Group fitness classes cost $20 per session. Individual direction costs $15 per visit.
Based on the given information, determine whether each of the statements is justified.
I. An individual who is experienced in fitness and has taken 3 group classes can choose to pay for the individual direction membership.
II. An individual who has a budget of $160 a month to spend on fitness after going through the personal training and group sessions can attend 8 classes per month.
III. Tina has completed all the necessary requirements to have an individual direction membership; Tina would make the 26th member of this type.
Look at each of the statements and the given information in the paragraphs to determine whether they are justified or not.
I. An individual who is experienced in fitness and has taken 3 group classes can choose to pay for the individual direction membership.
Look at the bolded sentence in the techniques paragraph,
At a gym there are three different paths an individual can take to obtaining membership. The first option is personal training. The second option is group fitness classes and the last option is individual direction. Members are only allowed to partake in individual direct after 5 personal training sessions and 10 group fitness classes.
Therefore, statement I. is not justified.
II. An individual who has a budget of $160 a month to spend on fitness after going through the personal training and group sessions can attend 8 classes per month.
Look at the bolded sentence in the price paragraph,
The price of membership depends on the technique the individual chooses. Personal training costs any where between $40 and $75 per session depending on the trainer. Group fitness classes cost $20 per session and individual direction costs $15 per visit.

Therefore, statement II. is justified.
III. Tina has completed all the necessary requirements to have an individual direction membership; Tina would make the 26th member of this type.
Look at the bolded sentence is the personnel,
For personal training, there must be one trainer per individual. For group fitness classes there must be one trainer per eight individuals. For individual direction, no trainer is required however, only 25 members can part take in individual direction at a time. At this particular gym there are 12 trainers.
Therefore, statement III. is not justified.
Look at each of the statements and the given information in the paragraphs to determine whether they are justified or not.
I. An individual who is experienced in fitness and has taken 3 group classes can choose to pay for the individual direction membership.
Look at the bolded sentence in the techniques paragraph,
At a gym there are three different paths an individual can take to obtaining membership. The first option is personal training. The second option is group fitness classes and the last option is individual direction. Members are only allowed to partake in individual direct after 5 personal training sessions and 10 group fitness classes.
Therefore, statement I. is not justified.
II. An individual who has a budget of $160 a month to spend on fitness after going through the personal training and group sessions can attend 8 classes per month.
Look at the bolded sentence in the price paragraph,
The price of membership depends on the technique the individual chooses. Personal training costs any where between $40 and $75 per session depending on the trainer. Group fitness classes cost $20 per session and individual direction costs $15 per visit.
Therefore, statement II. is justified.
III. Tina has completed all the necessary requirements to have an individual direction membership; Tina would make the 26th member of this type.
Look at the bolded sentence is the personnel,
For personal training, there must be one trainer per individual. For group fitness classes there must be one trainer per eight individuals. For individual direction, no trainer is required however, only 25 members can part take in individual direction at a time. At this particular gym there are 12 trainers.
Therefore, statement III. is not justified.
Compare your answer with the correct one above
Type of Art
Pointillism is a type of art that is created by drawing numerous dots on paper. Watercolor paintings are created by combining paint and water to create different shades. Pottery is made by molding clay.
Time to Create a Piece
A pointillism piece that has dimensions of 12x18 takes on average 15 hours to create. A watercolor painting that is 17 x 23 takes on average 20 hours to create. A piece of pottery that has dimensions 6 x 2 x 4 takes 12 hours to create.
Exposition
An art school is holding an exposition to highlight their student artists. The school will commission their students to create new works of art specifically for the exposition. The exposition requires one-third of the artwork displayed to be watercolor paintings and one-fifth to be pottery pieces.
Based on the given information, determine whether each of the statements is justified.
I. There are 20 watercolor paintings, 12 pottery pieces, and 28 pointillism pieces in the art exposition.
II. Students that will be featured in the school's exposition require no more than one day's notice.
II. Timothy is known for his watercolor pieces and is expected to paint 4 for the school's exposition. Timothy can create all the pieces over the weekend (Saturday and Sunday).
I. There are 20 watercolor paintings, 12 pottery pieces, and 28 pointillism pieces in the art exposition.
Looking at the bolded sentence from the third paragraph,
A art school is holding an exposition to highlight their student talent. The exposition requires a third of the art work to be watercolor paintings and a fifth to be pottery pieces.


Therefore statement I. is justified.
II. Students that will be featured in the school's exposition require a least a days notice.
Looking at the bolded sentence from the second paragraph,
A pointillism piece that has dimensions of 12x18 takes on average 15 hours to create. A watercolor painting that is 17x23 takes on average 20 hours to create. A piece of pottery that has dimensions 6x2x4 takes 12 hours to create.
Since the longest an art piece takes to create is 20 hours, one days notice, although not desired, is acceptable. Therefore, statement II. is justified.
II. Timothy is known for his watercolor pieces and is expected to paint 4 for the school's exposition. Timothy can create all the pieces over the weekend (Saturday and Sunday).
Since a watercolor painting takes 20 hours and Timothy needs to create 4, that means it will take him 80 hours to complete them. Since there are only 24 hours in a day, Saturday and Sunday only gives 48 hours therefore, statement III. is not justified.
I. There are 20 watercolor paintings, 12 pottery pieces, and 28 pointillism pieces in the art exposition.
Looking at the bolded sentence from the third paragraph,
A art school is holding an exposition to highlight their student talent. The exposition requires a third of the art work to be watercolor paintings and a fifth to be pottery pieces.
Therefore statement I. is justified.
II. Students that will be featured in the school's exposition require a least a days notice.
Looking at the bolded sentence from the second paragraph,
A pointillism piece that has dimensions of 12x18 takes on average 15 hours to create. A watercolor painting that is 17x23 takes on average 20 hours to create. A piece of pottery that has dimensions 6x2x4 takes 12 hours to create.
Since the longest an art piece takes to create is 20 hours, one days notice, although not desired, is acceptable. Therefore, statement II. is justified.
II. Timothy is known for his watercolor pieces and is expected to paint 4 for the school's exposition. Timothy can create all the pieces over the weekend (Saturday and Sunday).
Since a watercolor painting takes 20 hours and Timothy needs to create 4, that means it will take him 80 hours to complete them. Since there are only 24 hours in a day, Saturday and Sunday only gives 48 hours therefore, statement III. is not justified.
Compare your answer with the correct one above
Email #1
Email from wedding coordinator to bride and groom
February 12, at 10:13am
"The final headcount for booking the pavilion for the reception is today. Right now we have a rough estimate of 425 people. Is this still true and if so, do we know how many people will be having the chicken dinner?"
Email #2
Email from the bride to the wedding coordinator
February 12, at 10:27am
"We are still waiting on 40 invitations to RSVP; we gave a deadline of February 15. Is there a possibility for an extension to the 15th? Of the current 425 guests 375 have opted for the chicken dinner."
Email #3
Email from the wedding coordinator to the bride
February 12, at 11:02am
"I will reach out to the pavilion to see if an extension is possible and get back to you this afternoon. We can always assume for more since the pavilion does offer a refund if any changes are made at least one week prior to the wedding."
Based on the given information in the emails, determine whether the statements are justified.
I. The wedding coordinator is not willing to extend the guest headcount deadline.
II. The bride does not have a specific, expected date to receive RSVPs.
III. The wedding coordinator gives additional options to the bride in case the pavilion will not give an extension.
To determine which statements are justified, look at the information given in the emails.
For statement I. The wedding coordinator is not willing to extend the guest headcount deadline. Look at the bold statement in email #3,
Email from the wedding coordinator to the bride
February 12, at 11:02am
I will reach out to the pavilion to see if an extension is possible and get back to you this afternoon. We can always assume for more since the pavilion does offer a refund if any chances are made at least one week prior to the wedding.
Therefore, the wedding coordinator is willing to extend the guest count if at all possible. Thus, this statement is not justified.
For statement II. The bride does not have a specific, expected date to receive RSVPs. Look at the bold statement in email #2,
Email from the bride to the wedding coordinator
February 12, at 10:27am
We are still waiting on 40 invitations to RSVP; we gave a deadline of February 15. Is there a possibility for an extension to the 15th? Of the current 425 guests 375 have opted for the chicken dinner.
Therefore, the bride does give a deadline for the RSVPs. Thus, this statement is not justified.
For statement III. The wedding coordinator gives additional options to the bride in case the pavilion will not give an extension. Look at the bold statement in email #3,
Email from the wedding coordinator to the bride
February 12, at 11:02am
I will reach out to the pavilion to see if an extension is possible and get back to you this afternoon. We can always assume for more since the pavilion does offer a refund if any changes are made at least one week prior to the wedding.
Since the wedding coordinator gives additional options to the bride, the statement is justified.
Compare your answer with the correct one above