SSAT Middle Level Quantitative Quiz
8 questions · no time limit
0:00
DATA ANALYSIS AND GRAPHS
Question 1 of 8
No time limit
Current
Answered
Flagged
Not seen
Refer to the following double bar graph comparing test scores for two classes. What is the difference between the number of students who scored 90-100 in Class A versus Class B? 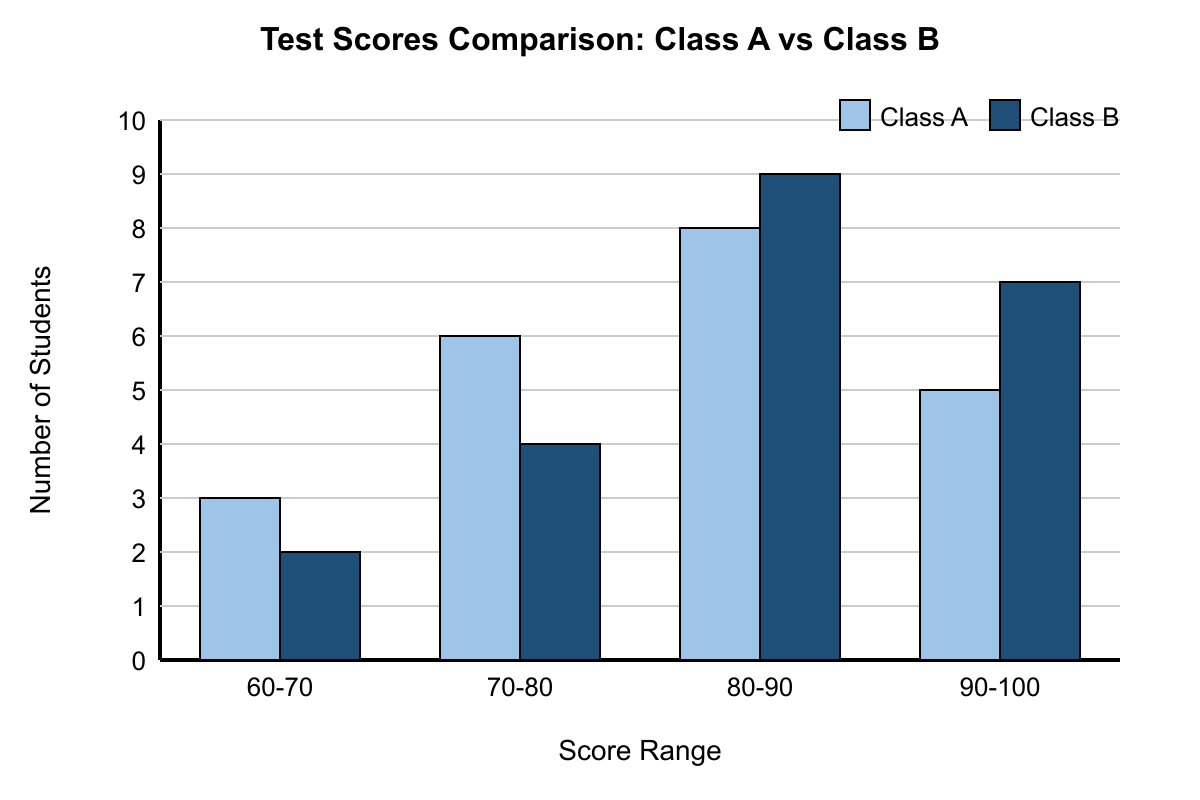
YOUR PROGRESS
8
QUESTIONS
Ready when you are
Answer in any order. Your progress shows here as you go.
QUESTIONS
KEYBOARD
Pick an answer ABCDE
Next question ↵→
Previous ←
Flag for review F