SSAT Middle Level Quantitative Quiz
11 questions · no time limit
0:00
DATA ANALYSIS AND GRAPHS
Question 1 of 11
No time limit
Current
Answered
Flagged
Not seen
Use the graph to analyze the number of cars passing through a toll booth each hour from 6 AM to 6 PM. Which conclusion about traffic patterns is best supported by the data? 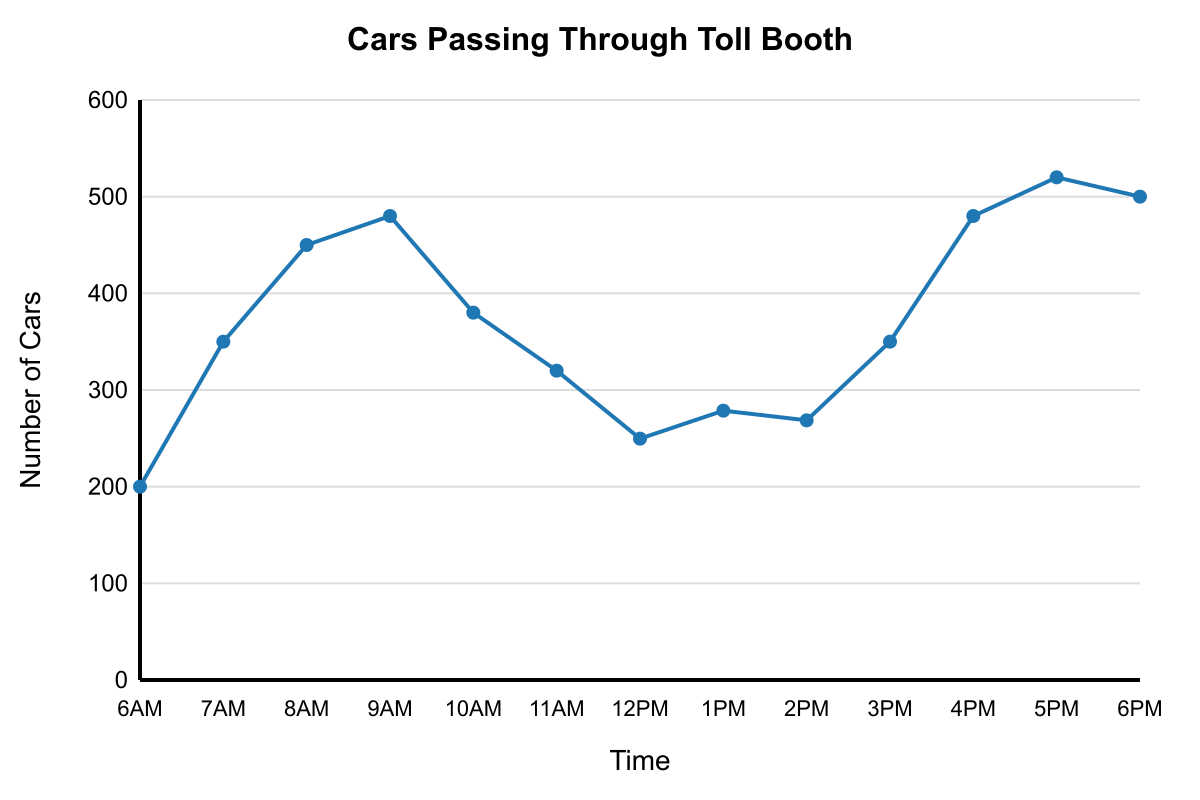
YOUR PROGRESS
11
QUESTIONS
Ready when you are
Answer in any order. Your progress shows here as you go.
QUESTIONS
KEYBOARD
Pick an answer ABCDE
Next question ↵→
Previous ←
Flag for review F