SSAT Middle Level Quantitative Quiz
14 questions · no time limit
0:00
DATA ANALYSIS AND GRAPHS
Question 1 of 14
No time limit
Current
Answered
Flagged
Not seen
The bar graph shows student participation in after-school activities. If the school adds a new activity that attracts 15% of current participants, approximately how many students would join the new activity? 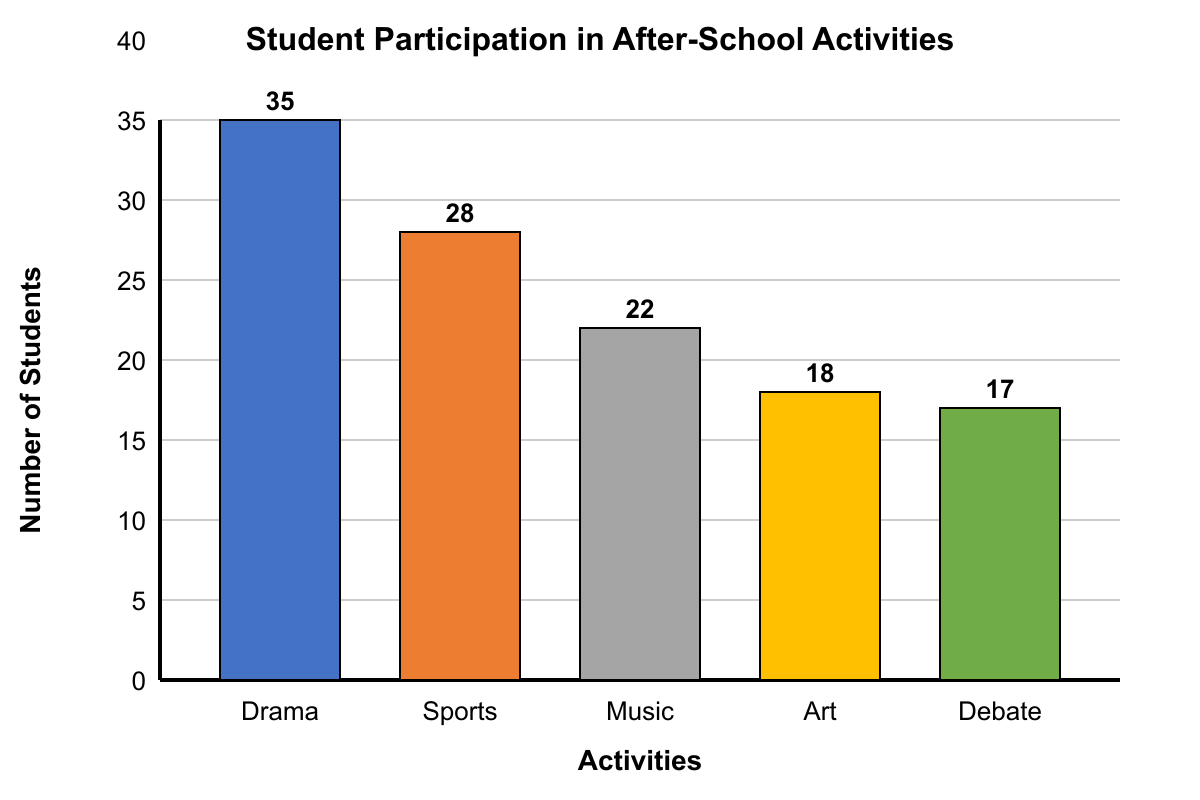
YOUR PROGRESS
14
QUESTIONS
Ready when you are
Answer in any order. Your progress shows here as you go.
QUESTIONS
KEYBOARD
Pick an answer ABCDE
Next question ↵→
Previous ←
Flag for review F