SHSAT Math Quiz
19 questions · no time limit
0:00
DATA ANALYSIS AND STATISTICS
Question 1 of 19
No time limit
Current
Answered
Flagged
Not seen
The bar graph shows the number of goals scored per game by two soccer teams over 8 games. Based on the graph, which of the following is closest to the positive difference between the mean goals per game of Team Red and the mean goals per game of Team Blue? 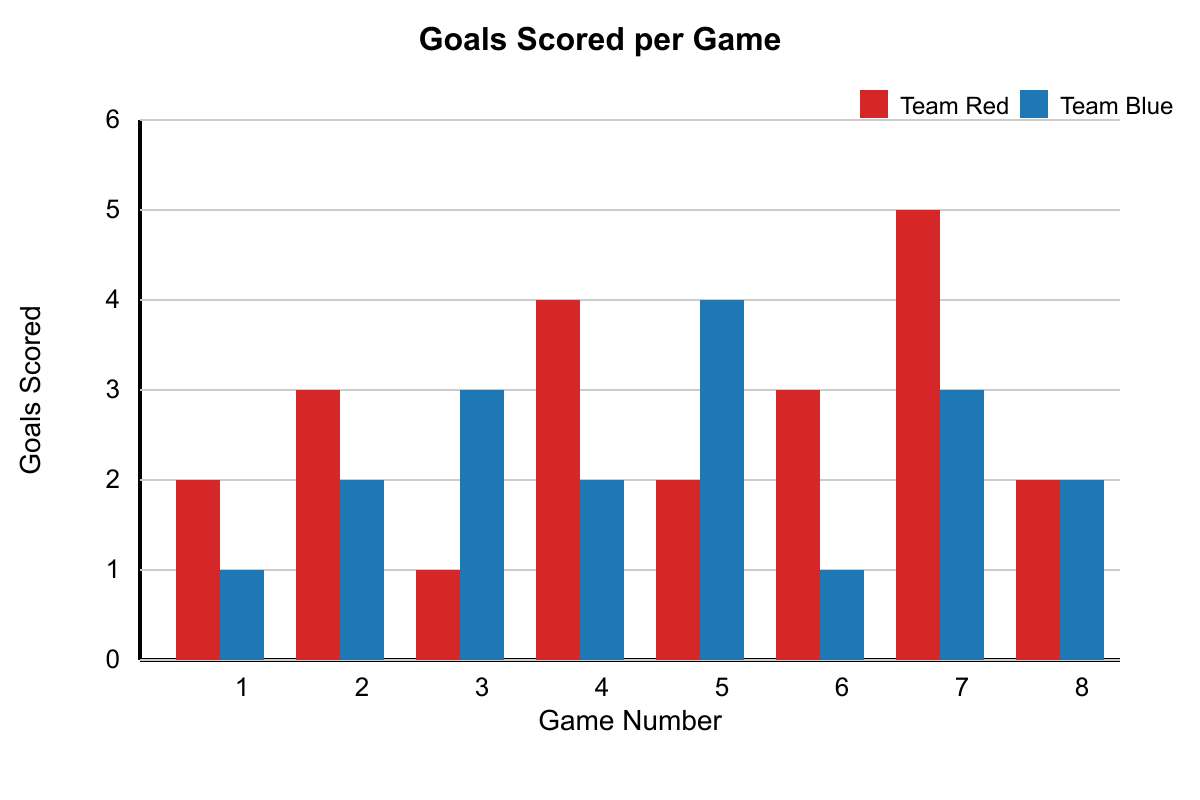
YOUR PROGRESS
19
QUESTIONS
Ready when you are
Answer in any order. Your progress shows here as you go.
QUESTIONS
KEYBOARD
Pick an answer ABCD
Next question ↵→
Previous ←
Flag for review F