Psychology Quiz
20 questions · no time limit
0:00
PERSONALITY & INDIVIDUAL DIFFERENCES
Question 1 of 20
No time limit
Current
Answered
Flagged
Not seen
The graph below shows the standard normal distribution of IQ scores. Based on the graph, what is the approximate IQ score that represents the threshold for the top 2.5% of the population? 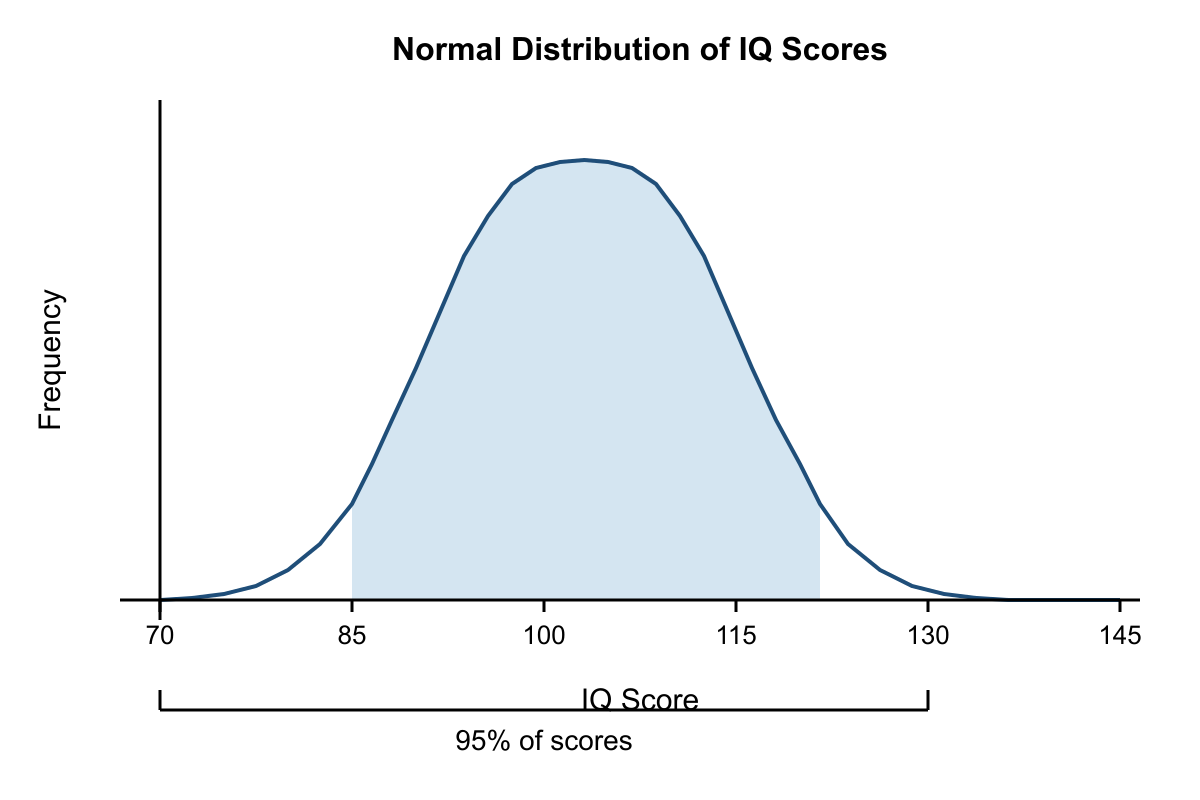
YOUR PROGRESS
20
QUESTIONS
Ready when you are
Answer in any order. Your progress shows here as you go.
QUESTIONS
KEYBOARD
Pick an answer ABCD
Next question ↵→
Previous ←
Flag for review F