Praxis Core Math Quiz
20 questions · no time limit
0:00
DATA INTERPRETATION/REPRESENTATION, STATISTICS, AND PROBABILITY
Question 1 of 20
No time limit
Current
Answered
Flagged
Not seen
The table shows the mean and standard deviation of daily sales (in hundreds of dollars) for a store over four consecutive weeks. Based on the table, during which week were daily sales most consistent? 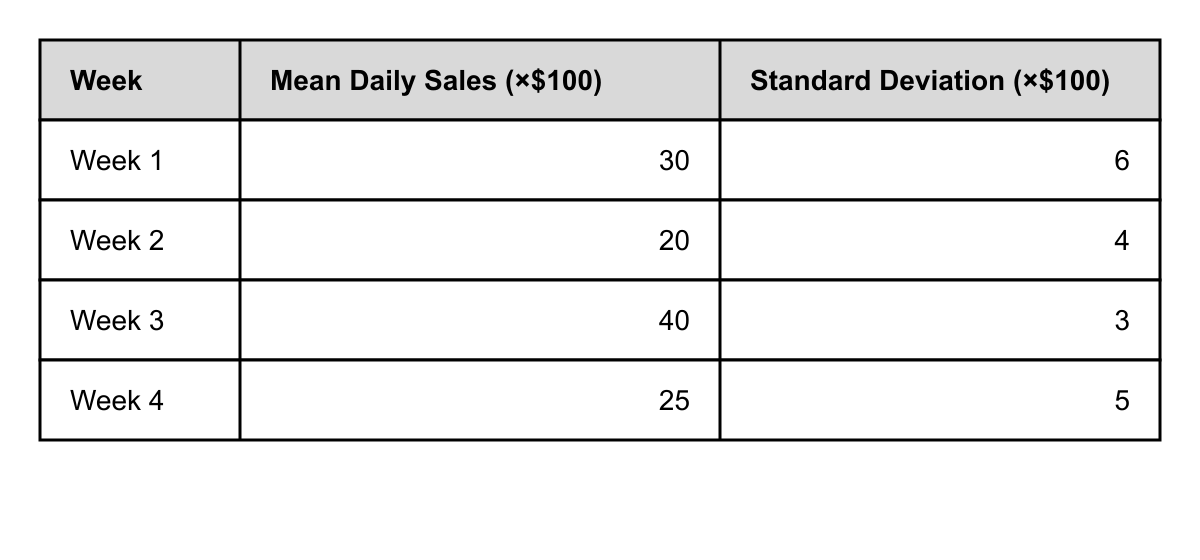
YOUR PROGRESS
20
QUESTIONS
Ready when you are
Answer in any order. Your progress shows here as you go.
QUESTIONS
KEYBOARD
Pick an answer ABCD
Next question ↵→
Previous ←
Flag for review F