Physical Chemistry 1 Quiz
18 questions · no time limit
0:00
PROBLEM-SOLVING & DATA SKILLS
Question 1 of 18
No time limit
Current
Answered
Flagged
Not seen
The van 't Hoff plot shown displays equilibrium data for collected using a flow reactor system. The plot shows good linearity (), but when the same reaction is studied in a static (closed) system, the van 't Hoff plot shows systematic deviation from linearity at higher temperatures. What is the most likely explanation for this difference? 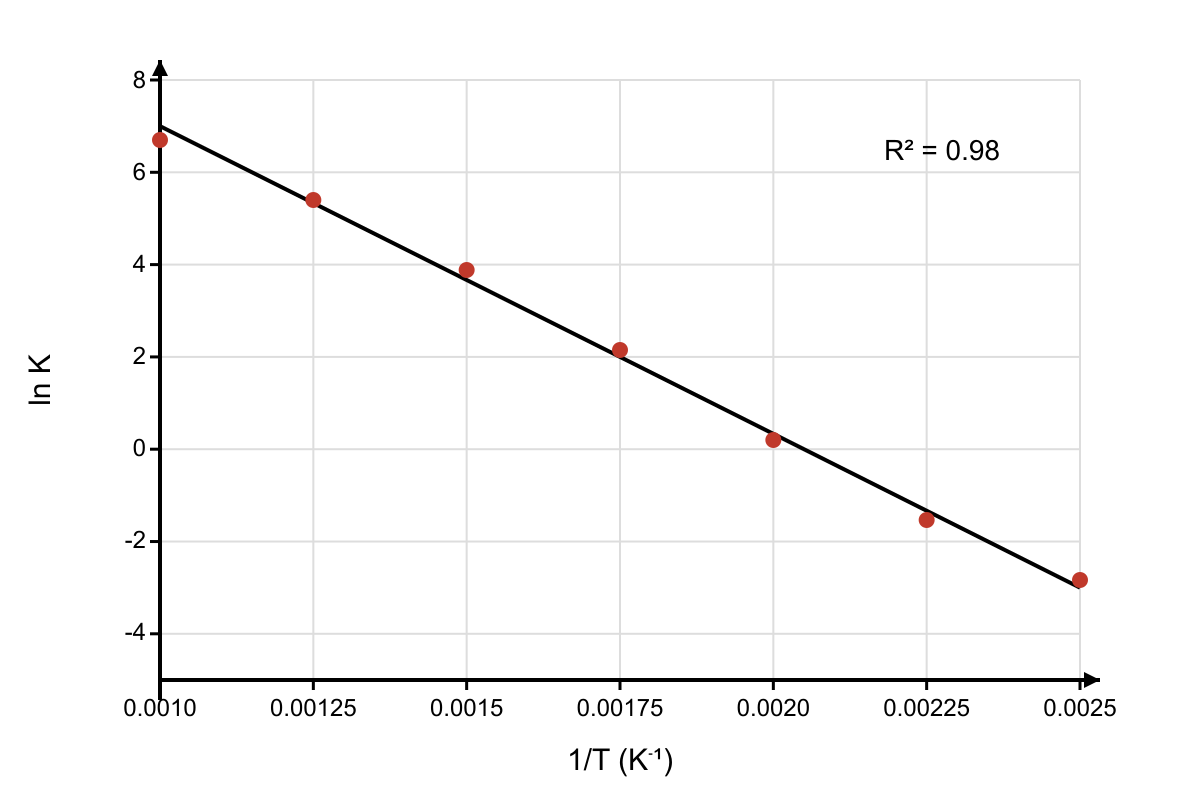
YOUR PROGRESS
18
QUESTIONS
Ready when you are
Answer in any order. Your progress shows here as you go.
QUESTIONS
KEYBOARD
Pick an answer ABCDE
Next question ↵→
Previous ←
Flag for review F