ISEE Upper Level Mathematics Achievement Quiz
18 questions · no time limit
0:00
STATISTICS AND DATA DISPLAYS
Question 1 of 18
No time limit
Current
Answered
Flagged
Not seen
The histogram shows the distribution of daily temperatures in degrees Fahrenheit for a city during the month of March. Based on this data, approximately what percentage of days had temperatures between 45°F and 65°F, inclusive? 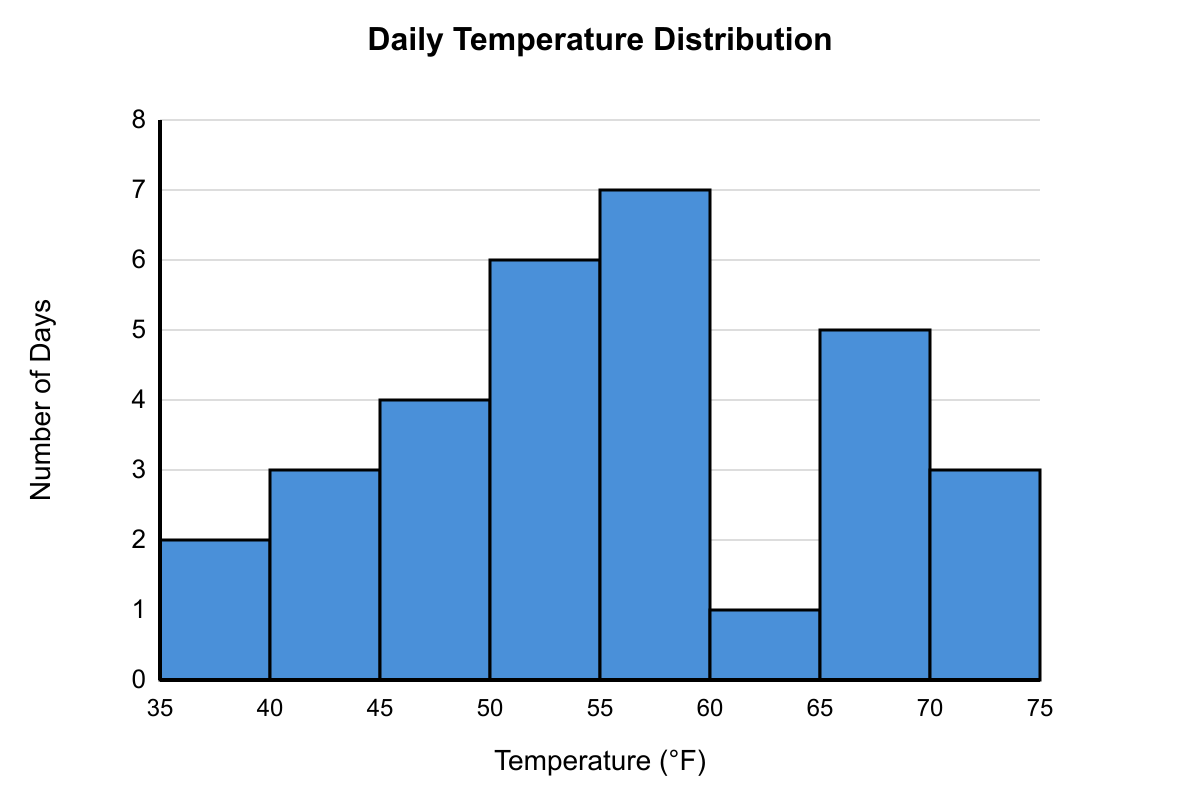
YOUR PROGRESS
18
QUESTIONS
Ready when you are
Answer in any order. Your progress shows here as you go.
QUESTIONS
KEYBOARD
Pick an answer ABCD
Next question ↵→
Previous ←
Flag for review F