Earth Science Quiz
8 questions · no time limit
0:00
OCEANOGRAPHY
Question 1 of 8
No time limit
Current
Answered
Flagged
Not seen
The graph shows the average salinity gradient for a halocline in a particular basin. If a CTD sensor is lowered from the top of this halocline at 50 m to the bottom at 200 m, what is the total expected increase in salinity? 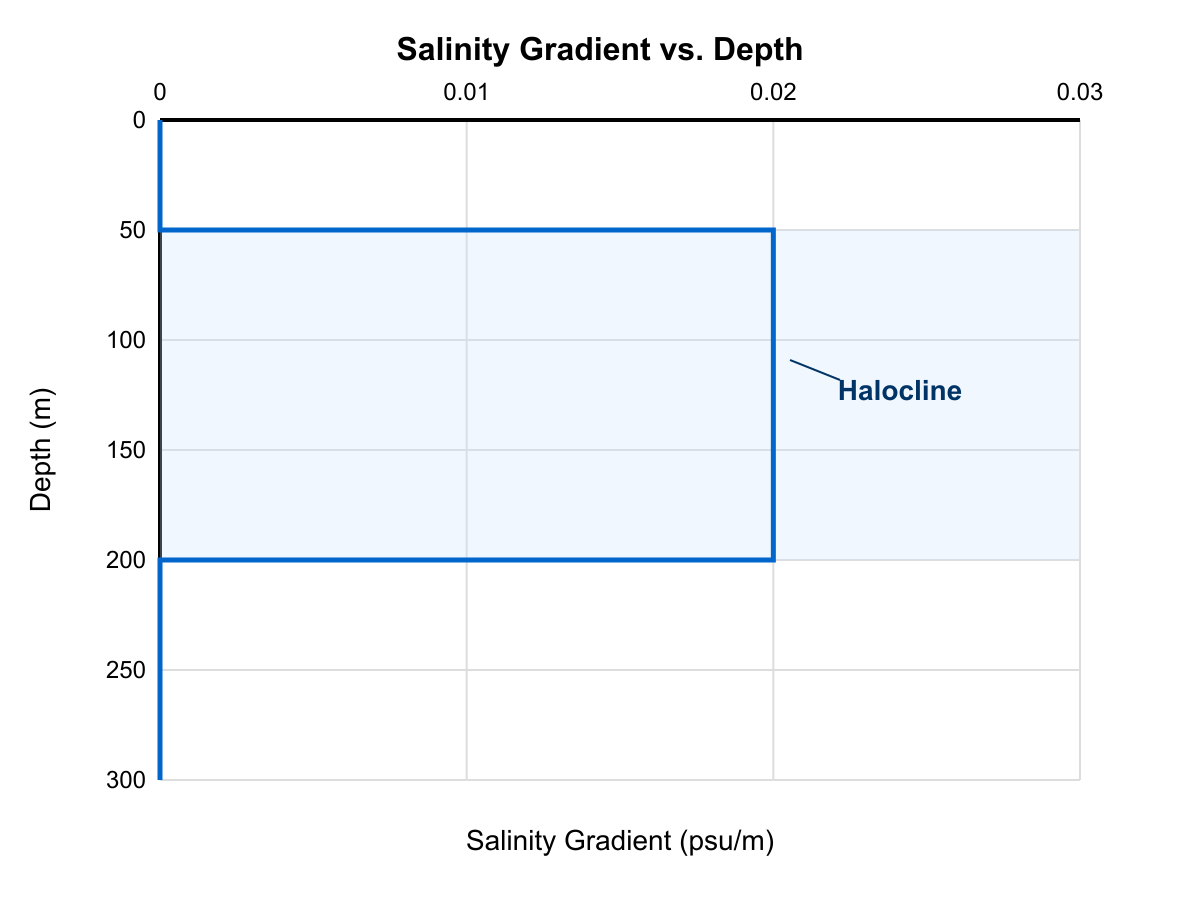
YOUR PROGRESS
8
QUESTIONS
Ready when you are
Answer in any order. Your progress shows here as you go.
QUESTIONS
KEYBOARD
Pick an answer ABCD
Next question ↵→
Previous ←
Flag for review F